FMCG Market Size 2026-2030
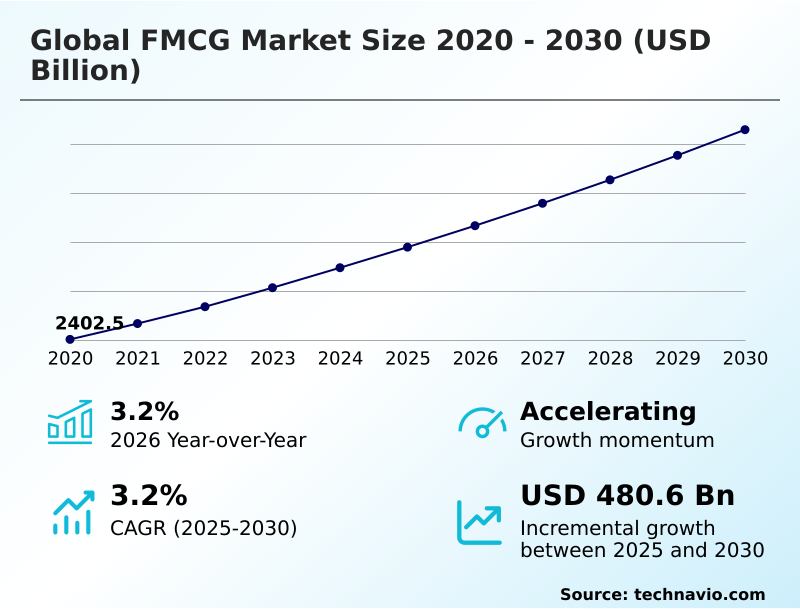
The fmcg market size is valued to increase by USD 480.6 billion, at a CAGR of 3.2% from 2025 to 2030. Accelerated digital transformation and AI integration will drive the fmcg market.
Major Market Trends & Insights
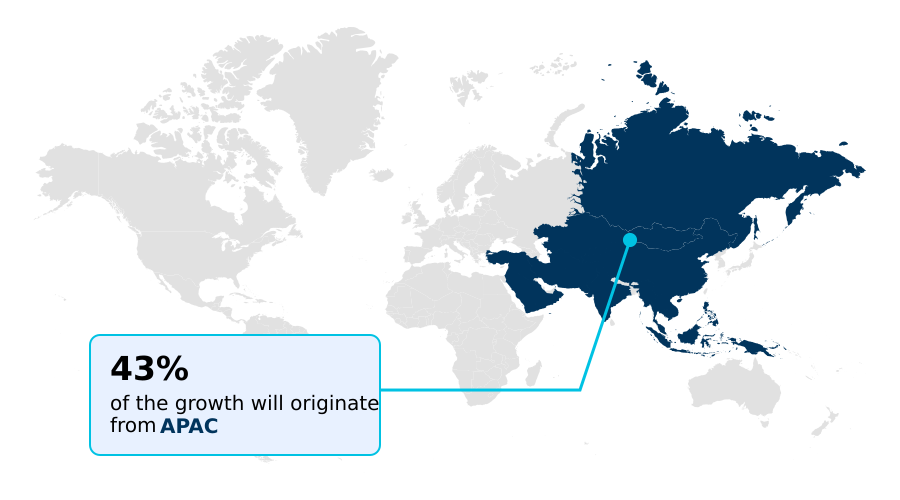
- APAC dominated the market and accounted for a 42.6% growth during the forecast period.
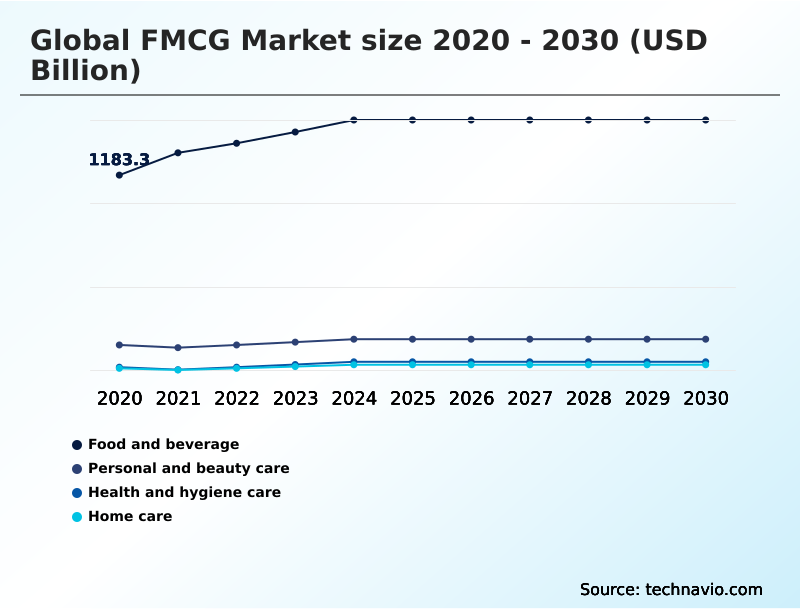
- By Type - Food and beverage segment was valued at USD 1414.7 billion in 2024
- By Distribution Channel - Offline segment accounted for the largest market revenue share in 2024
Market Size & Forecast
- Market Opportunities: USD 857.9 billion
- Market Future Opportunities: USD 480.6 billion
- CAGR from 2025 to 2030 : 3.2%
Market Summary
- The FMCG market is navigating a landscape of profound change, shaped by evolving consumer purchasing behaviour and technological advancement. A core driver is the integration of predictive analytics and machine learning algorithms, which are revolutionizing demand forecasting and inventory management. This allows organizations to move from reactive to proactive models, optimizing supply chain logistics.
- For instance, a company can now analyze real-time point of sale transactions and social media chatter through consumer sentiment analysis to dynamically adjust production, reducing waste by up to 15%. Concurrently, trends like the rise of quick commerce and the importance of digital shelf space are forcing a rethink of distribution.
- Challenges persist, including raw material cost volatility and geopolitical tensions, which are met with strategies like nearshoring manufacturing and building resilient sourcing networks. This dynamic environment demands agility, with firms leveraging agentic commerce workflows and cloud data platforms to create hyper personalized consumer experiences and maintain a competitive edge.
What will be the Size of the FMCG Market during the forecast period?
Get Key Insights on Market Forecast (PDF) Get Free Sample
How is the FMCG Market Segmented?
The fmcg industry research report provides comprehensive data (region-wise segment analysis), with forecasts and estimates in "USD billion" for the period 2026-2030, as well as historical data from 2020-2024 for the following segments.
- Type
- Food and beverage
- Personal and beauty care
- Health and hygiene care
- Home care
- Distribution channel
- Offline
- Online
- Product type
- Premium
- Mass market
- Private label
- Geography
- APAC
- China
- India
- Japan
- North America
- US
- Canada
- Mexico
- Europe
- Germany
- UK
- France
- Middle East and Africa
- Saudi Arabia
- UAE
- South Africa
- South America
- Brazil
- Argentina
- Colombia
- Rest of World (ROW)
- APAC
By Type Insights
The food and beverage segment is estimated to witness significant growth during the forecast period.
The food and beverage segment is undergoing a significant transformation, driven by evolving consumer dietary habits and a heightened focus on health and wellness.
Enterprises are moving beyond legacy products to embrace functional beverages, plant-based alternatives, and specialized nutritional formulations that address consumer demands for tangible benefits, including gut health categories.
This strategic pivot involves leveraging consumer sentiment analysis and generative design to accelerate innovation. Supply chain resilience is a key priority, with a focus on sustainable sourcing models to mitigate risk.
Many firms are implementing localized pricing strategies and optimizing portfolios, with some achieving a 15% improvement in forecast accuracy for new product launches through the use of predictive analytics and machine learning algorithms.
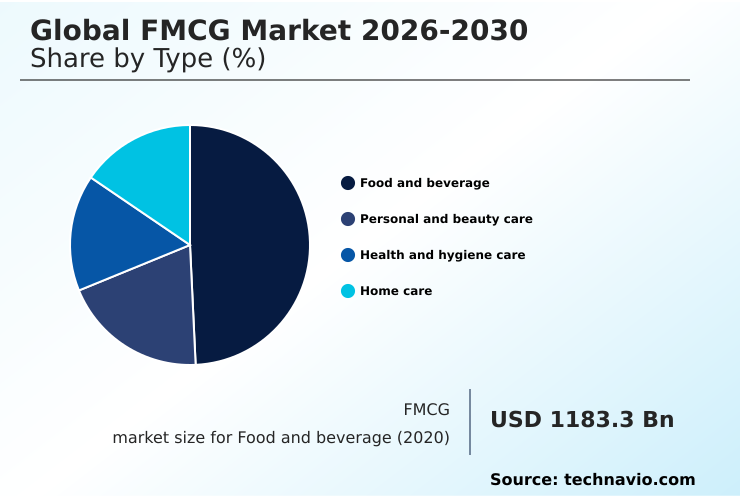
The Food and beverage segment was valued at USD 1414.7 billion in 2024 and showed a gradual increase during the forecast period.
Regional Analysis
APAC is estimated to contribute 42.6% to the growth of the global market during the forecast period.Technavio’s analysts have elaborately explained the regional trends and drivers that shape the market during the forecast period.
See How FMCG Market Demand is Rising in APAC Get Free Sample
The geographic landscape of the FMCG market is characterized by divergent regional growth trajectories, heavily influenced by local economic conditions and technological adoption rates.
In some developing markets, value growth has surged by over 13%, while more mature regions see modest gains. This disparity necessitates tailored approaches to market entry and expansion.
The proliferation of digital platforms is a unifying factor, with e-commerce now accounting for nearly 20% of total sales in certain advanced economies.
Success hinges on navigating regional complexities related to strategic corporate demergers, regenerative agriculture adoption, and adapting to unique consumer dietary habits. From active nutrition products in one region to the dominance of transactional platforms in another, localization is key.
Market Dynamics
Our researchers analyzed the data with 2025 as the base year, along with the key drivers, trends, and challenges. A holistic analysis of drivers will help companies refine their marketing strategies to gain a competitive advantage.
- The Global FMCG Market 2026-2030 is at a critical juncture where the impact of AI on FMCG supply chains is becoming a primary determinant of competitive advantage. Firms are implementing FMCG market strategies for inflationary pressures by leveraging consumer sentiment for FMCG branding to justify pricing and maintain loyalty.
- The role of quick commerce in FMCG growth cannot be overstated, fundamentally altering optimizing FMCG distribution channels and creating new challenges in FMCG e-commerce logistics. Sustainability is another core pillar, with sustainable packaging solutions in FMCG industry and regenerative agriculture for FMCG sourcing moving from niche concerns to mainstream strategic imperatives.
- This reflects broader consumer trends in plant-based FMCG products and the overarching health and wellness impact on beverage market. Success requires deep digital transformation in FMCG retail, using data analytics for FMCG demand forecasting to mitigate the risks of managing raw material volatility in FMCG.
- This data-driven approach is also crucial for AI-driven product innovation in FMCG and developing effective premiumization strategies in the personal care segment. Strategically, understanding the effects of demergers on FMCG portfolios and excelling at FMCG marketing on social commerce platforms are vital.
- Effective cost optimization in FMCG manufacturing, which can improve margins by several percentage points more than traditional methods, is essential for combating supply chain disruptions in FMCG and ensuring FMCG brand loyalty in the digital age.
What are the key market drivers leading to the rise in the adoption of FMCG Industry?
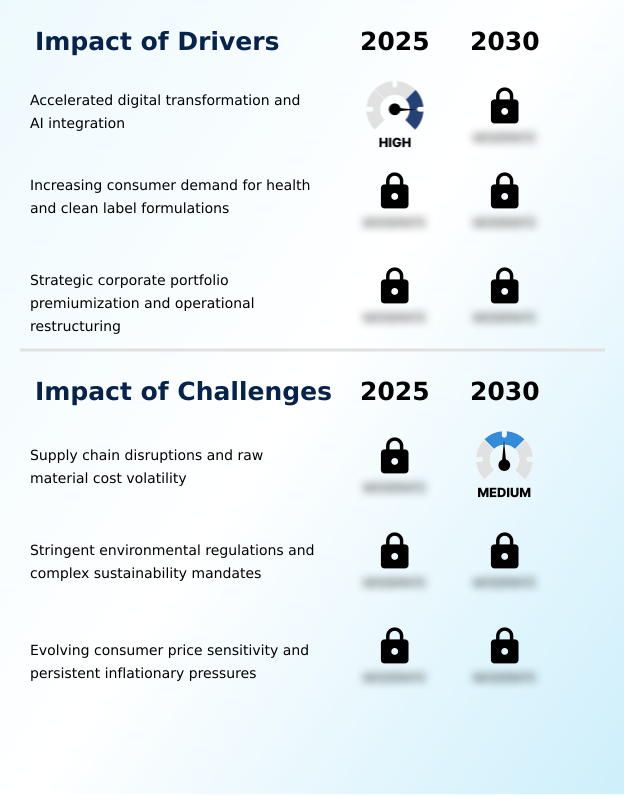
- Accelerated digital transformation, alongside the comprehensive integration of artificial intelligence, serves as a key driver for market expansion and operational efficiency.
- Fundamental operational overhauls, driven by the integration of agentic commerce workflows and cloud data platforms, are a primary driver for market expansion.
- The adoption of advanced cloud data platforms enables enterprises to process massive volumes of real-time data from point of sale transactions to social media trends.
- This allows for the creation of hyper personalized consumer experiences, which has been shown to improve customer retention by up to 5%.
- This technological pivot also facilitates corporate portfolio premiumization and core portfolio rationalization by providing clear data on product performance. Firms are also exploring nearshoring manufacturing and implementing resilient sourcing strategies to enhance agility and secure competitive advantages.
What are the market trends shaping the FMCG Industry?
- The expansion of quick commerce, coupled with its deep integration into digital media networks, is emerging as a significant market trend. This development is fundamentally reshaping retail distribution hierarchies and traditional consumer purchasing behaviors.
- The FMCG market is witnessing a profound structural shift driven by the exponential rise of quick commerce and deep integration with digital media networks. This has conditioned shoppers to expect unparalleled convenience, fundamentally altering consumer purchasing behaviour.
- This hyper-convenient distribution model is also a massive catalyst for category premiumization, with a reported 25% higher average spend on impulse buys through these channels. The ability to intercept consumers at the intersection of discovery and transaction is critical, impacting digital marketing strategies and return on investment metrics.
- To capitalize on this, organizations are investing in micro-fulfillment centers and demand forecasting technologies, reflecting a broader trend of operational restructuring across the industry.
What challenges does the FMCG Industry face during its growth?
- Pervasive supply chain disruptions and the extreme volatility of raw material costs present a key challenge affecting the industry's growth and profitability.
- The industry is grappling with unprecedented supply chain logistics challenges, including extreme raw material cost volatility and persistent logistical bottlenecks. Geopolitical tensions and climate-related disruptions have compromised the reliability of global supply chains for essential agricultural commodities and packaging materials. This has led to a surge in operational costs, with some companies seeing a 40% increase in transportation expenses alone.
- These inflationary pressures are exacerbated by stringent environmental regulations and complex sustainability mandates. Consequently, balancing consumer price sensitivity with rising costs strains corporate financial resources, making efficient inventory management more critical than ever. The packaging sector remains particularly vulnerable to these disruptions.
Exclusive Technavio Analysis on Customer Landscape
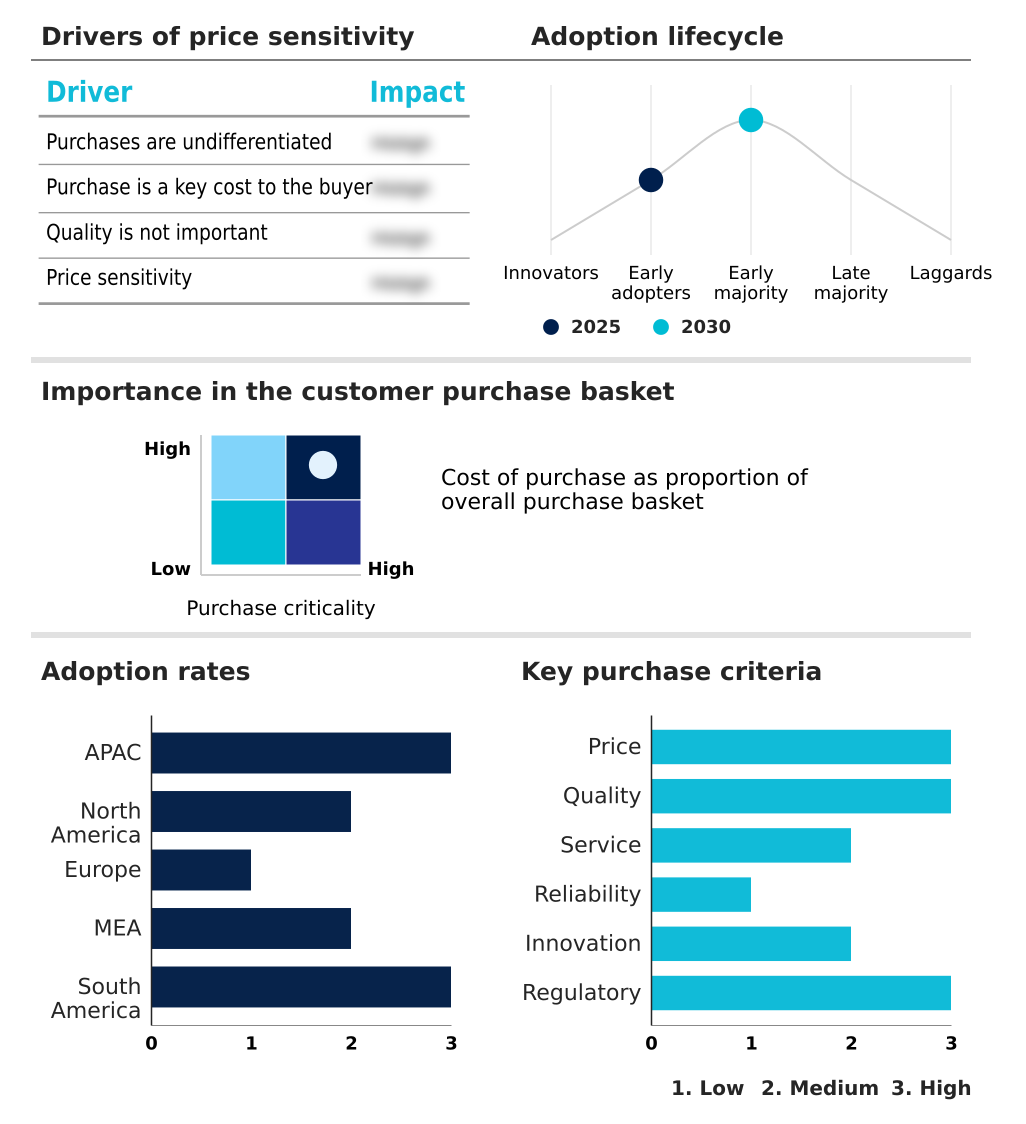
The fmcg market forecasting report includes the adoption lifecycle of the market, covering from the innovator’s stage to the laggard’s stage. It focuses on adoption rates in different regions based on penetration. Furthermore, the fmcg market report also includes key purchase criteria and drivers of price sensitivity to help companies evaluate and develop their market growth analysis strategies.
Customer Landscape of FMCG Industry
Competitive Landscape
Companies are implementing various strategies, such as strategic alliances, fmcg market forecast, partnerships, mergers and acquisitions, geographical expansion, and product/service launches, to enhance their presence in the industry.
Associated British Foods Plc - Offers a diversified portfolio of consumer staples, including grocery products, baking ingredients, breakfast cereals, edible oils, and sugar-based items for global households.
The industry research and growth report includes detailed analyses of the competitive landscape of the market and information about key companies, including:
- Associated British Foods Plc
- Beiersdorf AG
- Colgate Palmolive Co.
- Danone SA
- Edgewell Personal Care Co.
- General Mills Inc.
- Haleon Plc
- Henkel AG and Co. KGaA
- Kao Corp.
- Kimberly Clark Corp.
- Lion Corp.
- Mondelez International Inc.
- Nestle SA
- PepsiCo Inc.
- Procter and Gamble Co.
- Reckitt Benckiser Group Plc
- Spectrum Brands Inc.
- The Coca Cola Co.
- The Kraft Heinz Co.
- Unilever PLC
Qualitative and quantitative analysis of companies has been conducted to help clients understand the wider business environment as well as the strengths and weaknesses of key industry players. Data is qualitatively analyzed to categorize companies as pure play, category-focused, industry-focused, and diversified; it is quantitatively analyzed to categorize companies as dominant, leading, strong, tentative, and weak.
Recent Development and News in Fmcg market
- In May 2025, PepsiCo announced the strategic acquisition of the probiotic soda enterprise Poppi, a move designed to expand its functional beverage portfolio and address consumer demand for gut health solutions.
- In December 2025, Unilever completed the strategic demerger of its ice cream division, a move intended to allow the company to redirect resources and focus toward its high-growth premium beauty and wellness brands.
- In February 2026, Unilever established a landmark five-year strategic partnership with Google Cloud to integrate advanced artificial intelligence, agentic commerce workflows, and cloud data platforms across its global brand portfolio.
- In January 2026, Mars finalized the acquisition of Kellanova, a transaction that substantially expanded the combined organization's physical retail footprint and consolidated its shelf space dominance across major grocery networks.
Dive into Technavio’s robust research methodology, blending expert interviews, extensive data synthesis, and validated models for unparalleled FMCG Market insights. See full methodology.
| Market Scope | |
|---|---|
| Page number | 299 |
| Base year | 2025 |
| Historic period | 2020-2024 |
| Forecast period | 2026-2030 |
| Growth momentum & CAGR | Accelerate at a CAGR of 3.2% |
| Market growth 2026-2030 | USD 480.6 billion |
| Market structure | Fragmented |
| YoY growth 2025-2026(%) | 3.2% |
| Key countries | China, India, Japan, Indonesia, Australia, South Korea, US, Canada, Mexico, Germany, UK, France, Italy, Spain, The Netherlands, Saudi Arabia, UAE, South Africa, Egypt, Turkey, Brazil, Argentina and Colombia |
| Competitive landscape | Leading Companies, Market Positioning of Companies, Competitive Strategies, and Industry Risks |
Research Analyst Overview
- The FMCG market is undergoing a period of intense operational restructuring and core portfolio rationalization, driven by the need for greater agility. The integration of technologies like predictive analytics and machine learning algorithms is no longer optional, but essential for optimizing demand forecasting and managing point of sale transactions.
- This technological pivot is evident in boardroom decisions, where investments in advanced cloud data platforms are being prioritized to build resilient sourcing capabilities; such initiatives have been shown to reduce supply chain disruptions by up to 20%.
- The industry is leveraging generative design and consumer sentiment analysis to accelerate innovation, while agentic commerce workflows and cloud data platforms are enabling hyper personalized consumer experiences. Strategies such as corporate portfolio premiumization and localized pricing strategies are being adopted to navigate market complexities.
- The rise of quick commerce is reshaping the concept of digital shelf space, and firms are adapting through strategic corporate demergers and establishing sustainable sourcing models to meet both consumer and regulatory demands in a landscape defined by shifting consumer purchasing behaviour and the push toward nearshoring manufacturing.
What are the Key Data Covered in this FMCG Market Research and Growth Report?
-
What is the expected growth of the FMCG Market between 2026 and 2030?
-
USD 480.6 billion, at a CAGR of 3.2%
-
-
What segmentation does the market report cover?
-
The report is segmented by Type (Food and beverage, Personal and beauty care, Health and hygiene care, and Home care), Distribution Channel (Offline, and Online), Product Type (Premium, Mass market, and Private label) and Geography (APAC, North America, Europe, Middle East and Africa, South America)
-
-
Which regions are analyzed in the report?
-
APAC, North America, Europe, Middle East and Africa and South America
-
-
What are the key growth drivers and market challenges?
-
Accelerated digital transformation and AI integration, Supply chain disruptions and raw material cost volatility
-
-
Who are the major players in the FMCG Market?
-
Associated British Foods Plc, Beiersdorf AG, Colgate Palmolive Co., Danone SA, Edgewell Personal Care Co., General Mills Inc., Haleon Plc, Henkel AG and Co. KGaA, Kao Corp., Kimberly Clark Corp., Lion Corp., Mondelez International Inc., Nestle SA, PepsiCo Inc., Procter and Gamble Co., Reckitt Benckiser Group Plc, Spectrum Brands Inc., The Coca Cola Co., The Kraft Heinz Co. and Unilever PLC
-
Market Research Insights
- Market dynamics are increasingly influenced by a complex interplay of economic pressures and shifting consumer values. Intense inflationary pressures are heightening consumer price sensitivity, forcing brands to refine their value propositions. This has led to a reported 20% increase in the market share of private-label goods in some categories.
- Simultaneously, a growing focus on health and wellness is steering consumer dietary habits towards functional beverages and plant-based alternatives. This shift is compelling companies to innovate in nutritional formulations and explore high-growth gut health categories.
- Navigating these dynamics requires a delicate balance of cost control and investment in innovation, with successful firms demonstrating an average of 10% higher return on investment metrics on their new product development initiatives.
We can help! Our analysts can customize this fmcg market research report to meet your requirements.
 RIA -
RIA - 
