
Food Enzymes Market in Canada Size 2024-2028
The food enzymes market in Canada size is forecast to increase by USD 31.2 million, at a CAGR of 4% between 2023 and 2028.
- The market is experiencing significant growth, driven by the increasing awareness and demand for healthy and nutritional food. This trend is particularly evident in the food processing industry, where enzymes are extensively used to improve product quality, enhance functionality, and ensure food safety. However, the market faces challenges from the availability of substitutes, which can impact the pricing and market positioning of food enzymes. Despite these obstacles, companies can capitalize on the market's potential by focusing on innovation, product development, and strategic partnerships to meet the evolving demands of consumers and the food industry.
- By addressing these challenges and leveraging the opportunities presented by the growing awareness of healthy and nutritional food, players in the market can effectively navigate the competitive landscape and position themselves for long-term success.
What will be the Size of the Food Enzymes Market in Canada during the forecast period?

Explore in-depth regional segment analysis with market size data - historical 2018-2022 and forecasts 2024-2028 - in the full report.
Request Free Sample
The market continues to evolve, driven by the dynamic interplay of various factors. Meat tenderization enzymes, for instance, are increasingly being utilized in the meat processing industry to enhance product quality and consumer satisfaction. Simultaneously, advancements in enzyme purification methods enable the production of high-purity enzymes for food processing applications. Juice clarification enzymes play a crucial role in the beverage industry, ensuring clarity and enhancing the sensory properties of various beverages. Immunobilized enzyme technology offers advantages such as increased stability and reusability, making it a preferred choice for industrial-scale enzyme production. High-fructose corn syrup and cellulase enzyme kinetics are subjects of ongoing research, with potential applications in the production of bio-based sweeteners and the conversion of agricultural waste into value-added products.
Enzyme characterization techniques are essential for understanding enzyme properties and optimizing their use in various applications. Industrial enzyme production adheres to stringent regulatory compliance, ensuring the safety and efficacy of enzymes used in food processing. Plant-derived enzymes and microbial enzyme sources are popular choices due to their sustainability and cost-effectiveness. Enzyme stability studies and activity assays are crucial for understanding enzyme behavior under various conditions. Baking enzyme systems, amylase enzyme production, and animal-derived enzymes are essential components of the baking and dairy industries, respectively. Protease enzyme applications include meat tenderization, cheese production, and the production of bio-based detergents.
Enzyme reaction kinetics and reactor design are critical aspects of optimizing enzyme production and reducing costs. Biotechnological advancements have led to the production of recombinant enzymes and biocatalytic enzyme reactions, offering advantages such as improved specificity and efficiency. Dairy enzyme technology and enzyme cost optimization are ongoing areas of research and development, with potential applications in the production of functional dairy products and cost savings for manufacturers. Lipase enzyme catalysis and pectinase enzyme activity are subjects of ongoing research, with potential applications in the production of bio-based fuels and chemicals. Enzyme immobilization matrices offer advantages such as increased stability and reusability, making them a preferred choice for various industrial applications.
In summary, the market is characterized by continuous innovation and evolution, driven by the ongoing research and development in various sectors. Enzymes play a crucial role in enhancing product quality, optimizing production processes, and reducing costs, making them essential components of the food processing industry.
How is this Food Enzymes in Canada Industry segmented?
The food enzymes in Canada industry research report provides comprehensive data (region-wise segment analysis), with forecasts and estimates in "USD million" for the period 2024-2028, as well as historical data from 2018-2022 for the following segments.
- Product
- Carbohydrase
- Protease
- Lipase
- Others
- Application
- Bakery
- Confectionery
- Beverages
- Dairy and frozen desserts
- Meat products
- Source
- Microbial
- Plant-Based
- Animal-Based
- Distribution Channel
- B2B
- Specialty Stores
- Online Retail
- Geography
- North America
- Canada
- North America
By Product Insights
The carbohydrase segment is estimated to witness significant growth during the forecast period.
The Canadian food enzymes market experienced significant activity in 2023, with the carbohydrase segment leading the way. Carbohydrases, which include alpha- and beta-amylase, glucoamylase, cellulases, lactase, hemicellulases, glucose isomerase, pectinase, and other enzymes that break down carbohydrates, held a prominent position. The demand for these enzymes is driven by their extensive use in various industries, such as brewing and dairy, where amylase, alpha-galactosidase, and lactase are commonly employed. Carbohydrases play a crucial role in starch and ethanol processing, with amylase being particularly significant in the production of starch-based sweeteners and ethanol. Enzyme purification methods are essential in ensuring the production of high-quality carbohydrase, which is critical for maintaining consistent product performance and regulatory compliance.
Industrial enzyme production relies on various sources, including plant-derived and microbial, and immobilized enzyme technology is used to improve stability and productivity. Enzyme characterization techniques and activity assays are employed to understand enzyme properties, such as substrate specificity, reaction kinetics, and stability studies. Enzyme immobilization matrices, animal-derived enzymes, and protease enzyme applications are other areas of interest in the food enzymes market. Dairy enzyme technology and cost optimization are also significant trends, with lipase enzyme catalysis and pectinase enzyme activity gaining attention due to their potential applications in various food and beverage processes.

The Carbohydrase segment was valued at USD 70.80 million in 2018 and showed a gradual increase during the forecast period.
Market Dynamics
Our researchers analyzed the data with 2023 as the base year, along with the key drivers, trends, and challenges. A holistic analysis of drivers will help companies refine their marketing strategies to gain a competitive advantage.
B2B enzyme strategies leverage biotech enzyme technologies for food processing. Food enzyme prospects 2024 include enzymes for dairy processing and plant-based enzyme solutions, driving demand. Enzyme logistics analytics optimize supply, while Canada enzyme benchmarks highlight DuPont. Sustainable enzyme sourcing aligns with clean-label processing trends. Enzyme regulations 2024-2028 steer enzyme demand in Ontario 2024. Premium enzyme products and food enzyme forecasts enhance growth. Enzymes for bakery chains and custom enzyme blends target niches. Food enzyme hurdles and innovations address cost barriers, with enzyme supplier networks and enzyme cost tactics boosting margins. Canada enzyme insights and biotech enzyme breakthroughs accelerate momentum.
What are the key market drivers leading to the rise in the adoption of Food Enzymes in Canada Industry?
- The increasing consciousness regarding healthy and nutritious food choices is the primary market trend-driver. The market has experienced significant growth due to several factors. Increased health consciousness and food safety concerns, coupled with rising per capita income and spending expenditure, have fueled the demand for processed foods. This trend is driven by the changing lifestyle and food habits of individuals, urbanization, and the growing population of young families and working women. The convenience offered by processed foods, especially in the context of time-constrained modern lifestyles, has further boosted market growth. Additionally, the limited availability of fresh farm produce and the need to maintain food freshness for extended periods have increased the demand for food enzymes.
- Recombinant enzyme production and biocatalytic enzyme reactions have become essential in optimizing enzyme costs and enhancing the efficiency of dairy enzyme technology. Lipase enzyme catalysis and pectinase enzyme activity are particularly important in food processing applications. Overall, the market is poised for continued growth due to these market dynamics.
What are the market trends shaping the Food Enzymes in Canada Industry?
- The food processing industry is experiencing a significant increase in demand, representing a notable market trend. This growing need is driven by various factors, including population growth and changing consumer preferences.
- Food enzymes, derived from microorganisms using advanced technologies, play a crucial role in the food industry by enhancing the shelf-life and quality of various food products. Proteases, lipases, and carbohydrases are some commonly used enzymes in meat tenderization, bakery, dairy, frozen food, oils and fats, confectioneries, and other food applications. These enzymes help maintain the nutritional content of food products, especially in the complex food supply chain. The increasing demand for processed and packaged food products due to food security and safety concerns is driving the growth of the market. Advanced enzyme purification methods, such as immobilized enzyme technology, are employed to ensure the highest quality and consistency in food enzymes.
- Enzyme characterization techniques and cellulase enzyme kinetics are essential in understanding the properties and behavior of food enzymes. In food processing, juice clarification enzymes are used to improve the clarity and stability of fruit and vegetable juices. High-fructose corn syrup is often processed using enzymes to convert corn starch into fructose and glucose. The market is expected to grow due to the increasing awareness of consumers regarding the health and nutritional benefits of food enzymes. These enzymes contribute to improving digestion, reducing food waste, and enhancing the taste and texture of food products. As the food industry continues to evolve, the demand for food enzymes is anticipated to increase, making it an attractive market for investors and businesses.
What challenges does the Food Enzymes in Canada Industry face during its growth?
- The availability of substitutes poses a significant challenge to the industry's growth trajectory. In today's competitive business landscape, companies must continually innovate and differentiate themselves to maintain market share and profitability. The emergence of viable alternatives can disrupt supply chains, erode market position, and negatively impact revenue growth.
- The Canadian food enzymes market faces competition from emulsifiers, which share similar functionalities and are widely used in the food and beverage industry, particularly in bakery and dairy products. Commonly used emulsifiers include glycerol monostearate (GMS), diacetyl tartaric acid esters of mono- and diglycerides (DATEM), calcium stearoyl-2-lactylate (CSL), and sodium stearoyl-2-lactylate (SSL). The European and Asian Pacific markets are experiencing intense competition regarding the use of emulsifiers and enzymes due to their functional superiority and versatility. Emulsifiers are essential for food manufacturers to stabilize immiscible substances or emulsions, offsetting the substitution effect of enzymes. Enzyme regulatory compliance, industrial enzyme production, enzyme stability studies, and enzyme activity assays are crucial factors influencing the market.
- Plant-derived enzymes, such as brewing enzyme blends, are gaining popularity due to their sustainability and specificity towards various substrates. Glucose isomerase activity and enzyme substrate specificity are essential considerations in the production and application of food enzymes.
Exclusive Customer Landscape
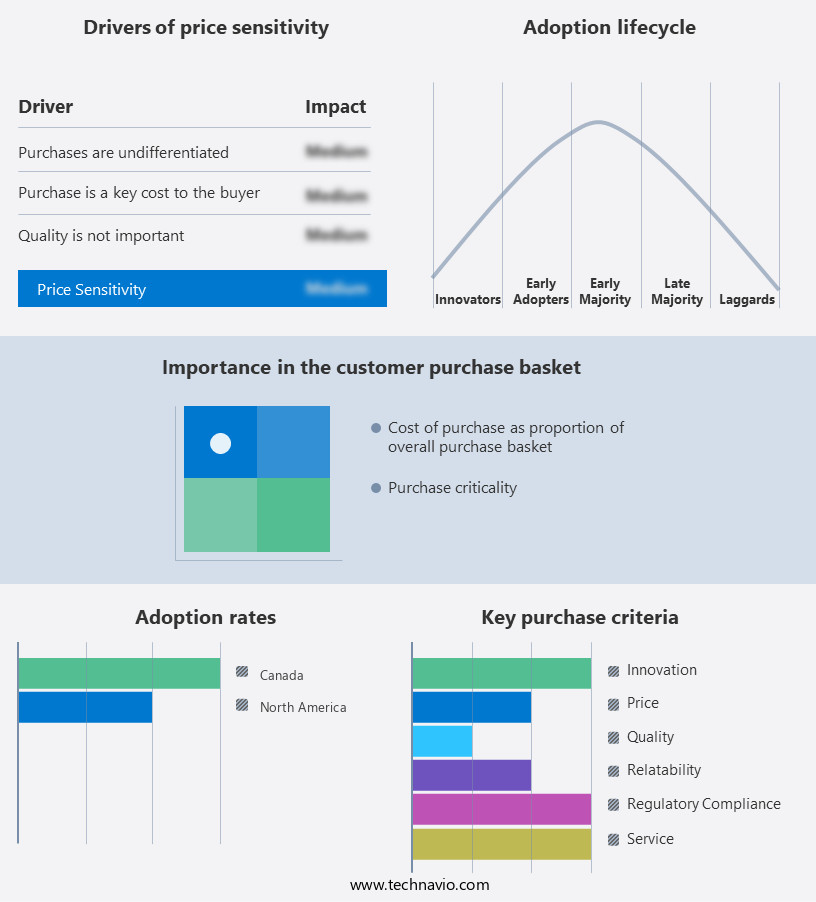
The food enzymes market in Canada forecasting report includes the adoption lifecycle of the market, covering from the innovator's stage to the laggard's stage. It focuses on adoption rates in different regions based on penetration. Furthermore, the food enzymes market in Canada report also includes key purchase criteria and drivers of price sensitivity to help companies evaluate and develop their market growth analysis strategies.
Customer Landscape
Key Companies & Market Insights
Companies are implementing various strategies, such as strategic alliances, food enzymes market in Canada forecast, partnerships, mergers and acquisitions, geographical expansion, and product/service launches, to enhance their presence in the industry.
Associated British Foods Plc - The company specializes in providing baking enzymes under the brand name Veron, enhancing the quality and consistency of baked goods through scientific fermentation processes. These enzymes optimize dough development, improve texture, and boost shelf life, making them a valuable addition to the baking industry.
The industry research and growth report includes detailed analyses of the competitive landscape of the market and information about key companies, including:
- Associated British Foods Plc
- BASF SE
- BRENNTAG SE
- DuPont de Nemours Inc.
- Jiagen Biotechnologies Inc.
- Kerry Group Plc
- Koninklijke DSM NV
- Novo Holdings AS
- Puratos
- Ultra Bio Logics Inc.
Qualitative and quantitative analysis of companies has been conducted to help clients understand the wider business environment as well as the strengths and weaknesses of key industry players. Data is qualitatively analyzed to categorize companies as pure play, category-focused, industry-focused, and diversified; it is quantitatively analyzed to categorize companies as dominant, leading, strong, tentative, and weak.
Recent Development and News in Food Enzymes Market In Canada
- In January 2024, Danisco Canada, a DuPont Nutrition & Biosciences business, announced the expansion of its enzyme production capacity at its facility in Laval, Quebec. This USD30 million investment aimed to meet the growing demand for food enzymes in the Canadian market and globally (DuPont press release).
- In March 2024, Novozymes, a leading enzyme producer, entered into a strategic partnership with Arla Foods, a major dairy cooperative in Canada. The collaboration focused on developing sustainable dairy solutions using Novozymes' enzyme technologies (Novozymes press release).
- In May 2024, Merck KGaA, Darmstadt, Germany, completed the acquisition of VersaChem Corporation, a Canadian enzyme technology company. This acquisition expanded Merck's portfolio in industrial enzymes and biotechnology (Merck KGaA press release).
- In April 2025, Health Canada granted regulatory approval for the use of Novozymes' Funcing® FGX-100, a fungal protease, in the production of cheese. This approval marked the first time a food enzyme was approved for this specific application in Canada (Novozymes press release).
Research Analyst Overview
- The Canadian food enzymes market witnesses dynamic activity driven by the increasing demand for enzyme-enhanced food products. Transaminase enzymes, with their crucial role in amino acid metabolism, are in high demand for protein hydrolysis. Bacterial sources dominate enzyme production, particularly for oxidoreductase enzymes like catalase, which plays a significant role in food preservation. Fungal sources are preferred for carbohydrase enzymes due to their specificity and efficiency. Enzyme quality control is paramount, ensuring optimal enzyme reaction conditions and substrate binding for hydrolytic enzymes like beta-amylase, papain, and chymotrypsin. Esterase enzymes, such as pectin methyl esterase, are essential for food processing, while protease enzymes, like trypsin and rennet, facilitate protein coagulation and cheese production.
- Phytase enzymes are gaining popularity for their application in animal feed, and enzyme-catalyzed reactions continue to revolutionize food processing. Lactase enzyme treatment enhances lactose digestion, while bromelain and invertase enzymes contribute to improved food texture and flavor. Xylanase enzyme production is on the rise, addressing the growing demand for fiber-rich food products. Enzyme process control and optimization are key market trends, ensuring efficient enzyme utilization and consistent product quality. Glucose oxidase activity and alpha-amylase hydrolysis are critical processes in food manufacturing, contributing to the overall growth of the Canadian food enzymes market.
Dive into Technavio's robust research methodology, blending expert interviews, extensive data synthesis, and validated models for unparalleled Food Enzymes Market in Canada insights. See full methodology.
|
Market Scope |
|
|
Report Coverage |
Details |
|
Page number |
147 |
|
Base year |
2023 |
|
Historic period |
2018-2022 |
|
Forecast period |
2024-2028 |
|
Growth momentum & CAGR |
Accelerate at a CAGR of 4% |
|
Market growth 2024-2028 |
USD 31.2 million |
|
Market structure |
Concentrated |
|
YoY growth 2023-2024(%) |
3.9 |
|
Key countries |
Canada and North America |
|
Competitive landscape |
Leading Companies, Market Positioning of Companies, Competitive Strategies, and Industry Risks |
What are the Key Data Covered in this Food Enzymes Market in Canada Research and Growth Report?
- CAGR of the Food Enzymes in Canada industry during the forecast period
- Detailed information on factors that will drive the growth and forecasting between 2024 and 2028
- Precise estimation of the size of the market and its contribution of the industry in focus to the parent market
- Accurate predictions about upcoming growth and trends and changes in consumer behaviour
- Growth of the market across Canada
- Thorough analysis of the market's competitive landscape and detailed information about companies
- Comprehensive analysis of factors that will challenge the food enzymes market in Canada growth of industry companies
We can help! Our analysts can customize this food enzymes market in Canada research report to meet your requirements.