
US Foodservice Market Size 2025-2029
US foodservice market size is forecast to increase by USD 3118.7 billion, at a CAGR of 30.6% between 2024 and 2029. The increasing trend towards snacking and indulgence consumption, the highly diverse population's growing preference for ethnic cuisine, and the rising competition from the unorganized fast food sector.
Major Market Trends & Insights
- North America dominated the market and accounted for a 100% during the forecast period.
- Based upon the Type, the Fast foodservice segment was valued at USD 128.20 billion in 2022
- Based on the Solution , the Conventional segment accounted for the largest market revenue share in 2022
Market Size & Forecast
- Market Opportunities: USD 3118.7 billion
- Future Opportunities: USD 934.17 billion
- CAGR : 30.6%
The first driver, the shift towards snacking and indulgence, is fueled by consumers' busy lifestyles and changing eating habits. This trend presents opportunities for foodservice providers to offer convenient, on-the-go food options and innovative, indulgent menu items. The second driver, the diverse population's cravings for ethnic cuisine, adds complexity to the market landscape. Foodservice providers must cater to a wide range of cultural preferences and dietary needs while maintaining quality and authenticity.
This challenge requires a deep understanding of consumer demographics and culinary trends. The third driver, the unorganized fast food sector's growing presence, intensifies competition in the market. Established foodservice providers must differentiate themselves by offering superior quality, innovation, and customer experience to maintain market share. This competition necessitates strategic planning, operational efficiency, and a focus on customer satisfaction. Companies that successfully navigate these challenges will capitalize on the market's potential for growth and innovation.
What will be the size of the US Foodservice Market during the forecast period?

- The global foodservice market is experiencing a continuous shift driven by digital integration, sustainability, and performance optimization. Businesses are leveraging POS integration and online ordering apps to enhance transaction efficiency and streamline service. Strategic tools such as menu optimization techniques, cost accounting methods, and inventory control techniques are being adopted to improve operational accuracy and profitability. Ensuring food safety compliance and enforcing ingredient traceability are now critical, especially as data-driven systems gain traction.
- Improving employee performance and satisfaction is also central, supported by staff scheduling software, employee engagement initiatives, and a structured performance management system. Restaurants are also investing in supplier relationship management, restaurant technology, purchasing optimization, and energy conservation practices to reduce waste and ensure sustainability. Customer-facing strategies include customer communication channels, digital menu boards, and online reputation management, all of which contribute to stronger customer retention strategies and increased loyalty program effectiveness. Corporate event catering, private events, and wedding catering provide opportunities for growth, while financial reporting and payroll management are essential for maintaining transparency and compliance. Worker's compensation, health insurance, and franchise technology are important considerations for business owners.
- Recent analysis revealed the implementation of customer-centric features led to a 27% increase in customer satisfaction metrics across leading outlets. By comparison, businesses utilizing structured sales performance analysis and pricing model optimization observed a 19% improvement in revenue outcomes. This gap highlights the measurable impact of coordinated operational improvement strategies, particularly those supported by customer data analytics, feedback analysis tools, and profitability analysis. Integrated delivery logistics management and consistent customer experience management continue to define how the foodservice market evolves across digital and physical touchpoints.
How is this market segmented?
The market research report provides comprehensive data (region-wise segment analysis), with forecasts and estimates in "USD billion" for the period 2025-2029, as well as historical data from 2019-2023 for the following segments.
- Type
- Fast foodservice
- Restaurant
- Cafes and bars
- Others
- Solution
- Conventional
- Centralized
- Ready-prepared
- Assembly-serve
- Sector
- Commercial
- Non-commercial
- Business Segment
- Chains
- Independent
- Service Model
- Dine-In
- Delivery
- Takeaway
- Target Audience
- Families
- Millennials
- Professionals
- Health Focus
- Organic
- Plant-Based
- Gluten-Free
- Geography
- North America
- US
- North America
By Type Insights
The fast foodservice segment is estimated to witness significant growth during the forecast period.
The US foodservice market is a dynamic and evolving industry, encompassing various segments such as table service, casual dining, banquet halls, and quick service restaurants. Table service establishments prioritize staff training and customer service to deliver an exceptional dining experience. Casual dining and banquet halls cater to large groups and special occasions, offering diverse menus and flexible event spaces. Revenue management, food waste reduction, and menu engineering are crucial strategies for optimizing operations and profitability. Food delivery services have gained popularity, with third-party platforms and restaurant partnerships streamlining the ordering process. Refrigeration units, restaurant design, and supply chain management are essential components of the industry, ensuring efficient and sustainable food handling and sourcing.
Ingredient sourcing, data analytics, and pricing strategies enable operators to make informed decisions and cater to changing consumer preferences. Menu design, marketing automation, and catering equipment cater to diverse customer needs and expectations. Energy efficiency, social media marketing, and food safety audits are essential aspects of modern foodservice operations. Fine dining establishments emphasize exceptional service and culinary expertise, while fast casual restaurants offer quick and convenient options for consumers on the go. Online ordering platforms, order fulfillment, and customer loyalty programs are essential tools for enhancing the customer experience and driving repeat business. Contract catering and foodservice equipment providers offer customized solutions for various market segments, from schools and healthcare facilities to corporate offices and event venues.
Sustainable practices, portion control systems, and cooking ranges are increasingly important considerations for operators seeking to minimize their environmental footprint and maintain high-quality food offerings. The foodservice industry is subject to various regulations and standards, including health inspections and food safety audits, ensuring the safety and well-being of consumers. The market's continued growth and evolution reflect the industry's ability to adapt to changing consumer preferences and demands.
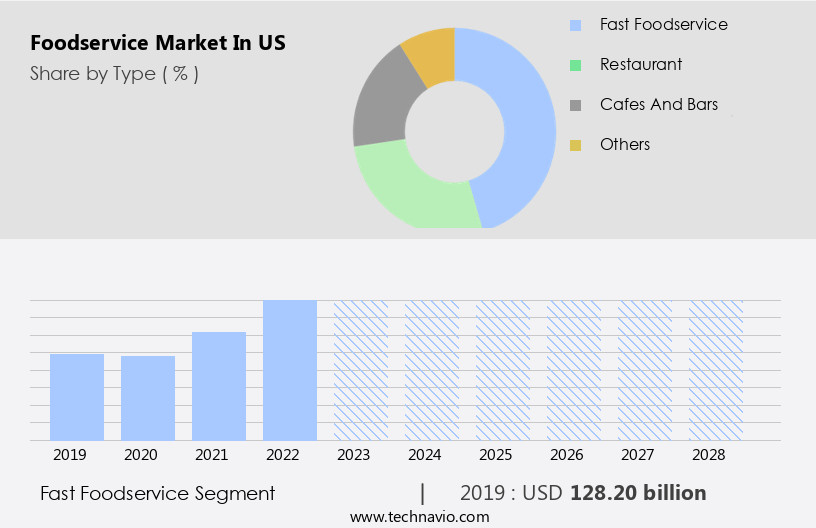
The Fast foodservice segment was valued at USD 128.20 billion in 2019 and showed a gradual increase during the forecast period.
Market Dynamics
Our researchers analyzed the data with 2024 as the base year, along with the key drivers, trends, and challenges. A holistic analysis of drivers will help companies refine their marketing strategies to gain a competitive advantage.
The global restaurant technology market continues to evolve as operators seek tools that directly influence operational efficiency and profitability. Key areas of focus include impact restaurant technology adoption and the effectiveness of online ordering systems, which streamline processes while expanding customer access. Restaurants are prioritizing improving kitchen workflow efficiency and reducing food waste in restaurants through integrated solutions. Enhancements in optimizing restaurant supply chains and enhancing customer service strategies directly contribute to improving restaurant profit margins and measuring customer satisfaction.
Employee retention is supported by high restaurant employee engagement, while tools like menu engineering and sales forecasting for restaurant business improve performance. Operators use data to assess the impact of pricing strategies, manage restaurant labor cost optimization, and deploy marketing automation tools for campaign precision. Evaluating the measuring ROI of marketing campaigns and impact of restaurant technology on operations helps in strategic planning. The adoption of sustainable practices is increasingly vital, ensuring long-term viability.
What are the US Foodservice Market drivers leading to the rise in adoption of the Industry?
- The primary factor fueling market growth is the heightened consumption of increased snacking and indulgence foods. The foodservice market in the US is witnessing significant shifts in consumer behavior, with an increasing preference for snacks and light meals over traditional sit-down meals. According to recent research, one in five new food products launched between January 2021 and June 2022 fell under the category of nuts and seeds, while one in eight were finger foods or potato-based snacks. Other popular snack subcategories include meat snacks, snack mixes, and fruit-based snacks. Approximately three in ten American children consume three or more snacks daily, and each additional snack is associated with a 9% increase in daily caloric intake.
- To stay competitive in this dynamic market, restaurant operators are leveraging data analytics to optimize pricing strategies, sales forecasting, food cost control, and menu design. Restaurant management software, online ordering platforms, and food safety audits are essential tools for ensuring profitability and customer loyalty. Space planning and efficient restaurant supply management are also critical to maintaining a harmonious and productive restaurant environment. Marketing automation and customer loyalty programs are increasingly important for attracting and retaining customers. By analyzing customer data, restaurants can tailor their marketing efforts and offer personalized promotions and discounts. In conclusion, the foodservice industry is undergoing significant changes, and operators must adapt to these shifts by leveraging technology, data analytics, and customer insights to remain competitive and profitable.
What are the US Foodservice Market trends shaping the Industry?
- A highly diverse population is currently embracing ethnic cuisines, marking a significant market trend. This culinary trend reflects the growing appreciation for cultural diversity and the desire to explore new flavors.
- The foodservice market is witnessing significant growth due to several key trends. One such trend is the increasing preference for ethnic cuisines, driven by the influx of immigrants and the expanding American palate. The Asian American population, which is the fastest-growing racial or ethnic group in the US, has introduced a diverse range of spicy cuisines from East and Southeast Asian countries and the Indian subcontinent. This trend is reflected in the market's response, with a favorable reception from consumers. Another trend shaping the foodservice industry is the focus on energy efficiency. Foodservice operators are increasingly investing in energy-efficient catering equipment and foodservice equipment to reduce operational costs and minimize their carbon footprint.
- Social media marketing is also becoming essential for foodservice businesses, enabling them to engage with customers, manage online reviews, and promote their brand. Contract catering and order fulfillment systems are other areas of growth, with businesses leveraging technology to streamline operations and improve customer experience. Driver management and inventory management systems are also critical for ensuring efficient delivery and reducing food waste. Hygiene practices remain a top priority, with food safety regulations driving the adoption of advanced hygiene technologies and practices. Quick service restaurants (QSRs) are also adopting technology to enhance the customer experience, with self-service kiosks, mobile ordering, and contactless payment options becoming increasingly popular. Overall, the foodservice market in the US is dynamic and evolving, with trends such as energy efficiency, social media marketing, and technology adoption shaping the industry's future.
How does US Foodservice Market face challenges during its growth?
- The unorganized fast food sector's increasing competition poses a significant challenge to the industry's growth trajectory. The foodservice market in the US faces challenges from the growing number of unorganized fast food companies. These companies, including those operating from street carts and trucks, offer affordable fast food options to price-conscious consumers. The presence of various consumer segments based on income levels in urban areas has led to an increase in the number of fast food restaurants. This trend is expected to continue during the forecast period, potentially hindering the growth of the formal foodservice industry. Labor management and health inspections are critical areas of focus for foodservice providers to maintain food safety standards.
- Sustainable practices, such as water conservation and sourcing strategies, are also gaining importance. Food processors invest in portion control systems and commercial ovens to improve efficiency and consistency. Buffet service remains popular in various settings, requiring commercial ovens and cooking ranges to ensure food quality and safety. Customer service is a key differentiator, with providers emphasizing harmonious and immersive experiences to attract and retain customers. To navigate these market dynamics, foodservice providers must adopt innovative strategies. This includes investing in technology for labor management and health inspections, implementing sustainable practices, and offering diverse menu options to cater to various consumer segments.
- By focusing on these areas, providers can maintain their competitive edge and meet the evolving demands of the foodservice market. In conclusion, the foodservice market in the US is undergoing significant changes, driven by the expansion of the unorganized fast food sector. Providers must address challenges in labor management, health inspections, and food safety standards while embracing sustainable practices and innovative technologies to remain competitive. By adapting to these trends, foodservice providers can capitalize on the growing demand for quality, affordable, and convenient food options.
Exclusive US Foodservice Market Customer Landscape
The market forecasting report includes the adoption lifecycle of the market, covering from the innovator's stage to the laggard's stage. It focuses on adoption rates in different regions based on penetration. Furthermore, the report also includes key purchase criteria and drivers of price sensitivity to help companies evaluate and develop their market growth analysis strategies.

Customer Landscape
Key Companies & Market Insights
Companies are implementing various strategies, such as strategic alliances, market forecast partnerships, mergers and acquisitions, geographical expansion, and product/service launches, to enhance their presence in the market.
The market research and growth report includes detailed analyses of the competitive landscape of the market and information about key companies, including:
- American Dairy Queen Corp.
- Chick fil A Inc.
- CKE Restaurants Holdings Inc.
- Dominos Pizza Inc.
- Inspire Brands Inc.
- Jack in the Box Inc.
- Marcos Franchising LLC
- McDonald Corp.
- MTY Food Group Inc.
- Papa Johns International Inc.
- Penn Station Inc.
- Pret A Manger
- Raising Canes Restaurants LLC
- Restaurant Brands International Inc.
- Shamrock Foods Co.
- Starbucks Corp.
- Sysco Corp.
- The Subway Group
- The Wendys Co.
- Wingstop Inc.
- YUM Brands Inc.
Qualitative and quantitative analysis of companies has been conducted to help clients understand the wider business environment as well as the strengths and weaknesses of key market players. Data is qualitatively analyzed to categorize companies as pure play, category-focused, industry-focused, and diversified; it is quantitatively analyzed to categorize companies as dominant, leading, strong, tentative, and weak.
Recent Development and News in Foodservice Market In US
- In January 2024, Sysco Corporation, a leading foodservice distributor in the US, announced the acquisition of US Foods Holding Corp. for approximately USD3.5 billion. This merger aimed to create a larger, more competitive player in the foodservice distribution sector (Sysco Corporation Press Release, 2024).
- In March 2024, McDonald's Corporation and DoorDash, a leading on-demand food delivery platform, announced a multi-year partnership to expand McDonald's delivery capabilities across the US. This collaboration allowed McDonald's to reach more customers through DoorDash's extensive network (McDonald's Corporation Press Release, 2024).
- In May 2024, Starbucks Coffee Company unveiled its new plant-based protein bowl, made in collaboration with Beyond Meat, at select stores in the US. This strategic partnership and product launch catered to the growing demand for plant-based food options in the foodservice industry (Starbucks Coffee Company Press Release, 2024).
- In January 2025, Grubhub and Uber Eats, two major food delivery platforms, announced their merger. The combined entity, Now Delivery, aimed to create a more competitive food delivery market in the US, offering a broader range of restaurant choices and delivery options to customers (Uber Technologies Inc. Press Release, 2025).
Research Analyst Overview
The US foodservice market is rapidly advancing, driven by integrated point of sale system and scalable online ordering platform solutions. Restaurants are adopting kitchen display system, inventory management software, and restaurant management system to boost operational efficiency metrics. Key focuses include supply chain optimization, food safety management system, and food cost control measures, supported by data analytics dashboard and financial reporting tools.
Strategic tools like menu engineering principles, pricing strategies analysis, and revenue management strategy improve profitability. Enhancing experience through table management system, labor scheduling software, customer relationship management, and customer feedback system is vital. Businesses also implement waste reduction strategies, food waste tracking, and energy efficiency improvements.
Staff training programs, customer service protocols, employee performance metrics, and customer satisfaction scores ensure service excellence. Growth is further accelerated through digital marketing campaigns, brand reputation management, sales forecasting techniques, and customer loyalty programs.
Buffet service and commercial ovens are staples in the industry, while cooking ranges and portion control systems optimize food production. The ongoing integration of technology, such as inventory management systems and delivery vehicles, enhances operational efficiency. The foodservice market in the US is a continually evolving landscape, with entities such as catering equipment, energy efficiency, social media marketing, fine dining, order fulfillment, online reviews, driver management, hygiene practices, catering services, contract catering, foodservice equipment, quick service, inventory management systems, delivery vehicles, labor management, health inspections, food safety standards, sustainable practices, food processors, portion control systems, cooking ranges, water conservation, sourcing strategies, buffet service, commercial ovens, customer service, and more, shaping the industry's future.
Dive into Technavio's robust research methodology, blending expert interviews, extensive data synthesis, and validated models for unparalleled Foodservice Market in US insights. See full methodology.
|
Market Scope |
|
|
Report Coverage |
Details |
|
Page number |
192 |
|
Base year |
2024 |
|
Historic period |
2019-2023 |
|
Forecast period |
2025-2029 |
|
Growth momentum & CAGR |
Accelerate at a CAGR of 30.6% |
|
Market growth 2025-2029 |
USD 3118.7 billion |
|
Market structure |
Fragmented |
|
YoY growth 2024-2025(%) |
30.0 |
|
Competitive landscape |
Leading Companies, Market Positioning of Companies, Competitive Strategies, and Industry Risks |
What are the Key Data Covered in this Market Research Report?
- CAGR of the market during the forecast period
- Detailed information on factors that will drive the market growth and forecasting between 2025 and 2029
- Precise estimation of the size of the market and its contribution of the market in focus to the parent market
- Accurate predictions about upcoming market growth and trends and changes in consumer behaviour
- Growth of the market across US
- Thorough analysis of the market's competitive landscape and detailed information about companies
- Comprehensive analysis of factors that will challenge the growth of market companies
We can help! Our analysts can customize this market research report to meet your requirements Get in touch