
Forging Market Analysis, Size, and Forecast 2026-2030: APAC (China, India, and Japan), Europe (Germany, Italy, and France), North America (US, Canada, and Mexico), South America (Brazil, Argentina, and Chile), Middle East and Africa (Saudi Arabia, UAE, and South Africa), and Rest of World (ROW)

Forging Market Analysis, Size, and Forecast 2026-2030:
APAC (China, India, and Japan), Europe (Germany, Italy, and France), North America (US, Canada, and Mexico), South America (Brazil, Argentina, and Chile), Middle East and Africa (Saudi Arabia, UAE, and South Africa), and Rest of World (ROW)

Published: Oct 2026 311 Pages SKU: IRTNTR40551

Market Overview at a Glance

$47.59 B
Market Opportunity
6.8%
CAGR 2025 - 2030
61.5%
APAC Growth
$65.15 B
Automotive segment 2024

Forging Market Size 2026-2030

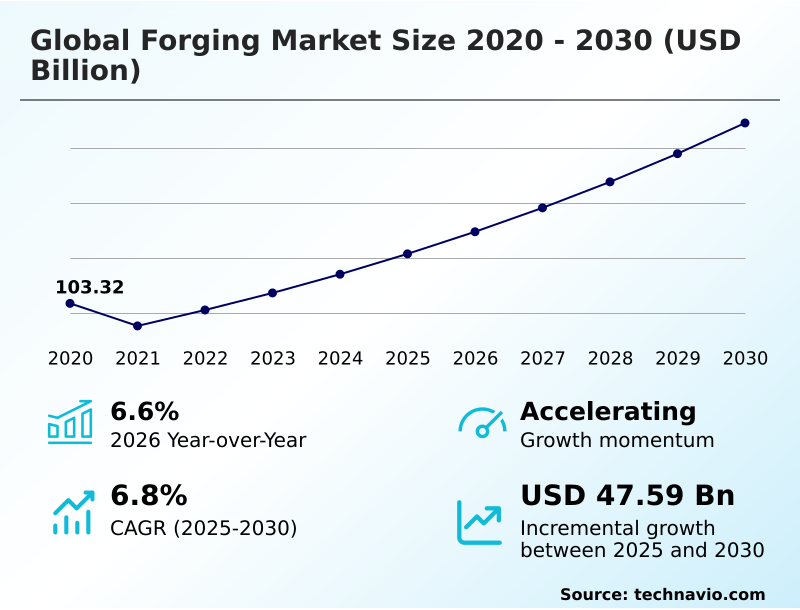
The forging market size is valued to increase by USD 47.59 billion, at a CAGR of 6.8% from 2025 to 2030. Automotive industry transition to electric vehicles and lightweighting will drive the forging market.

Major Market Trends & Insights

  • APAC dominated the market and accounted for a 61.5% growth during the forecast period.
  • By End-user - Automotive segment was valued at USD 65.15 billion in 2024
  • By Raw Material - Carbon steel segment accounted for the largest market revenue share in 2024

Market Size & Forecast

  • Market Opportunities: USD 65.60 billion
  • Market Future Opportunities: USD 47.59 billion
  • CAGR from 2025 to 2030 : 6.8%

Market Summary

  • The Forging Market exhibits sustained demand driven by persistent industrial modernization and the critical need for high-strength mechanical components. Expanding infrastructure initiatives and rapid automotive electrification require advanced metallurgical shaping processes to ensure structural integrity under extreme operational stress.
  • For instance, automotive original equipment manufacturers executing lightweighting strategies transition from cast to forged parts, directly achieving a 20% improvement in component tensile strength compared to traditional casting methodologies. This enhancement significantly optimizes unsprung mass and extends overall vehicle range.
  • A primary driver accelerating market adoption is aerospace sector expansion, where the uncompromising requirement for fatigue-resistant airframe and turbine structures compels manufacturers to rely extensively on precision thermomechanical processing. Conversely, stringent environmental mandates impose heavy operational constraints.
  • High energy consumption inherent in heating large metal billets exposes manufacturers to volatile utility costs and costly decarbonization compliance, acting as a major growth barrier. Consequently, capital allocations must continuously shift toward advanced induction heating technologies to maintain cost competitiveness while satisfying rigorous emissions protocols.

What will be the Size of the Forging Market during the forecast period?
Get Key Insights on Market Forecast (PDF) Get Free Sample

How is the Forging Market Segmented?

The forging industry research report provides comprehensive data (region-wise segment analysis), with forecasts and estimates in "USD million" for the period 2026-2030, as well as historical data from 2020-2024 for the following segments.

  • End-user
    • Automotive
    • Defense and aerospace
    • Shipbuilding
    • Others
  • Raw material
    • Carbon steel
    • Alloy steel
    • Aluminum
    • Magnesium
    • Others
  • Application
    • Closed die forging
    • Open die forging
    • Seamless rings
  • Geography
    • APAC
      • China
      • India
      • Japan
      • South Korea
      • Australia
      • Singapore
    • Europe
      • Germany
      • Italy
      • France
      • UK
      • Spain
      • The Netherlands
    • North America
      • US
      • Canada
      • Mexico
    • South America
      • Brazil
      • Argentina
      • Chile
    • Middle East and Africa
      • Saudi Arabia
      • UAE
      • South Africa
      • Turkey
      • Egypt

By End-user Insights

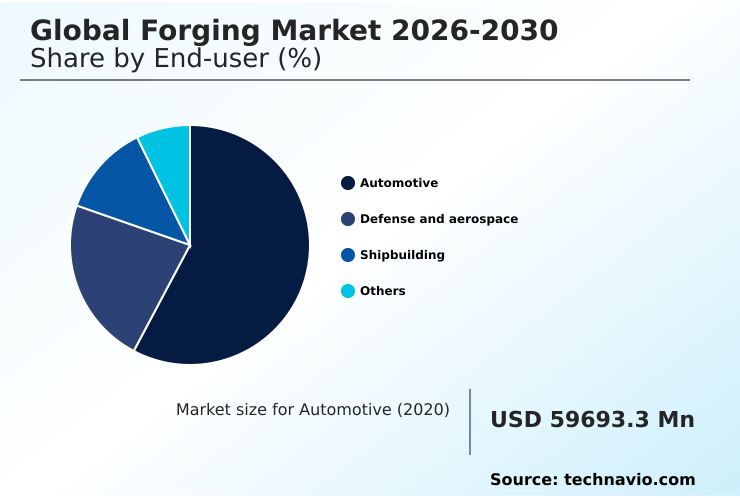
The automotive segment is estimated to witness significant growth during the forecast period.

The automotive segment heavily dictates processing standards throughout the industrial metal shaping sector, driven by stringent demands for vehicle durability and weight optimization.

As manufacturers transition powertrains, integrating a modern closed die forging press ensures optimal grain structure refinement flow, eliminating internal voids.

Unlike the specialized healthcare sector producing biocompatible titanium medical implants, automotive applications achieve a 15% improvement in processing efficiency due to high-volume standardized production. Engineering teams rely on directional strength optimization to manufacture highly resilient chassis parts.

Concurrently, producing critical aerospace turbine compressor disks demands specialized handling of tough nickel based superalloy components, shifting sourcing strategies to ensure unwavering compliance with essential safety tolerances.
Get Free Sample

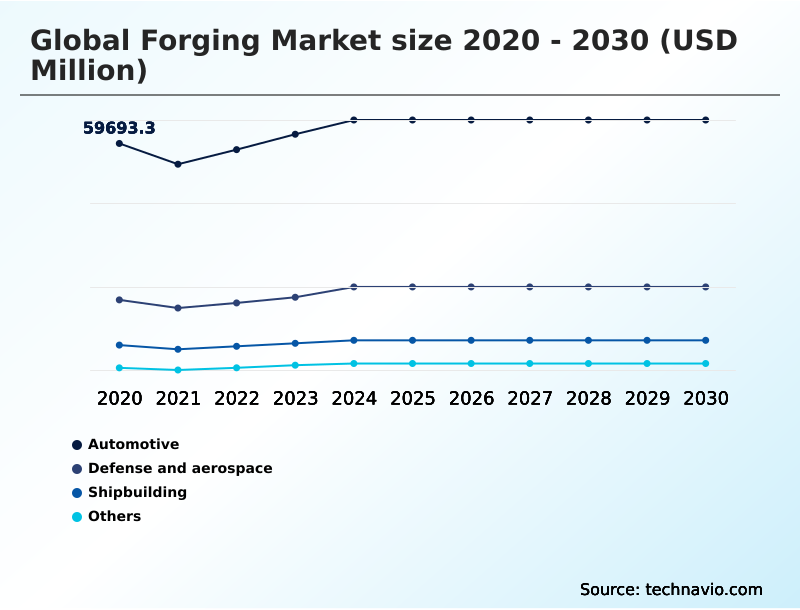
The Automotive segment was valued at USD 65.15 billion in 2024 and showed a gradual increase during the forecast period.
Get Free Sample

Regional Analysis

APAC is estimated to contribute 61.5% to the growth of the global market during the forecast period.Technavio’s analysts have elaborately explained the regional trends and drivers that shape the market during the forecast period.
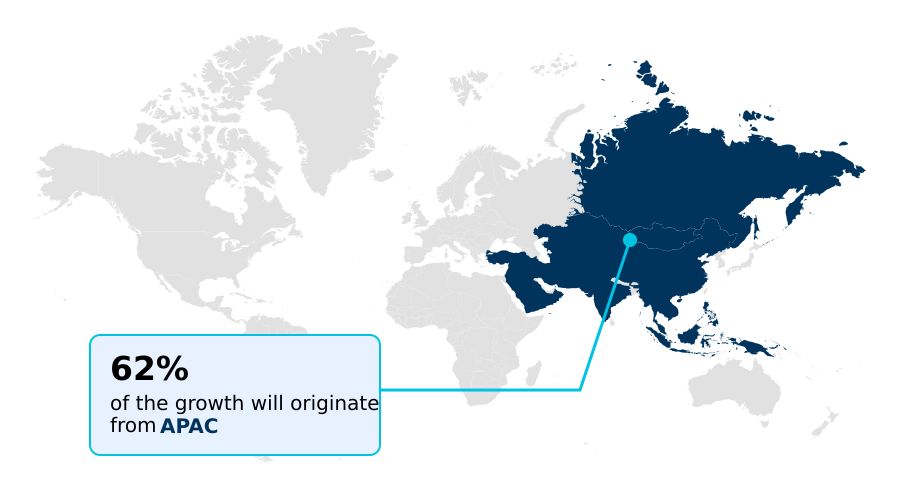
See How Forging Market Demand is Rising in APAC Get Free Sample

The regional distribution of the manufacturing sector reflects distinct industrial priorities and varying rates of technological adoption. APAC leads supply chain expansion, leveraging robust shipbuilding and heavy machinery bases to achieve a 25% higher production output compared to Europe.

This volume-centric approach heavily utilizes standard processes for manufacturing marine vessel propeller shafts and high pressure containment valves. In contrast, Europe prioritizes advanced material optimization, deploying the isothermal forging process to address stringent component specifications.

By utilizing precision seamless rolled ring forging, European operators successfully manufacture durable wind turbine main bearings and lightweight titanium alloy airframe structures, improving component fatigue life by 18%.

This strategic emphasis on quality allows regional supply chains to remain highly competitive across safety-critical infrastructure deployments.

Market Dynamics

Our researchers analyzed the data with 2025 as the base year, along with the key drivers, trends, and challenges. A holistic analysis of drivers will help companies refine their marketing strategies to gain a competitive advantage.

  • Advancements in heavy manufacturing constantly prioritize material efficiency and excellent structural reliability across diverse industrial supply chains. Enterprise manufacturers are actively transitioning toward a near net shape manufacturing process to eliminate exhaustive secondary machining, naturally lowering material waste during large-scale operations.
  • This strategy proves exceptionally beneficial when executing the isothermal forging of titanium alloys, where minimizing scrap directly protects profit margins against continuously volatile raw material expenses. Similarly, the deployment of a new induction heated precision forging line delivers exceptional thermal consistency, allowing facility operators to accelerate cycle times while improving finished part quality.
  • In the renewable energy sector, the demand for high-capacity power generation necessitates the production of robust seamless rolled ring wind bearings, ensuring stability under immense mechanical stress. Concurrently, the mass production of closed die automotive suspension components relies heavily on automated workflows, giving Tier-1 suppliers a 15% reduction in overall tooling wear compared to conventional casting methods.
  • This shift allows manufacturers to consistently align with demanding compliance standards while maintaining essential long-term cost competitiveness.
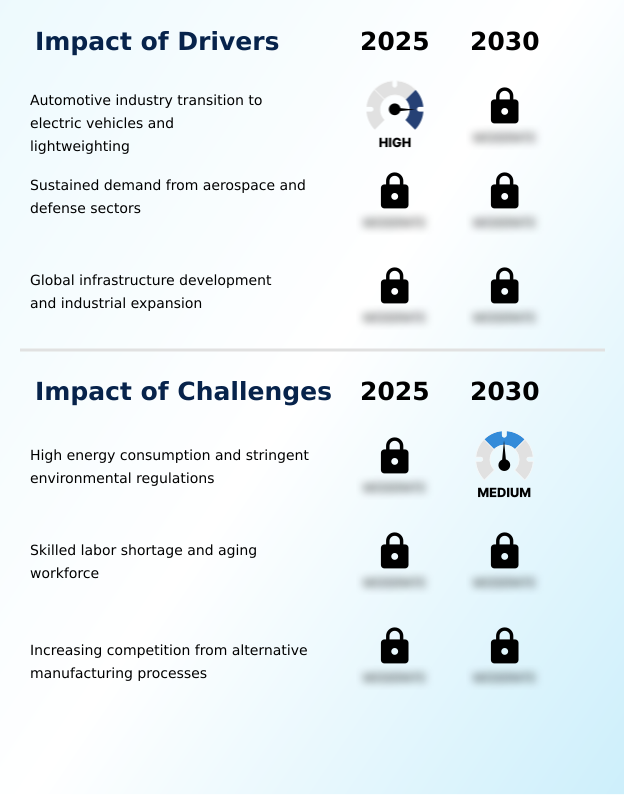
What are the key market drivers leading to the rise in the adoption of Forging Industry?

  • The rapid transition of the automotive industry toward electric vehicles and advanced lightweighting initiatives serves as the primary catalyst for market expansion.

  • The immediate demand for superior high strength to weight ratio components acts as a primary catalyst for profound operational shifts in heavy manufacturing.
  • Driven by strict automotive electrification mandates, OEMs prioritize unsprung mass reduction engineering to aggressively extend overall vehicle operating ranges. Utilizing complex geometry near net shape designs ensures robust crash-test survivability, actively enhancing heavy electric vehicle chassis subframes.
  • This material transition allows suppliers to lower targeted vehicle weight by 15%, generating substantial energy compliance advantages. Advanced processing techniques guarantee exceptional surface integrity and essential stress corrosion cracking prevention in safety-critical parts.
  • Furthermore, deploying precise rotational inertia reduction engineering cuts lifetime component warranty claims by 12%.

What are the market trends shaping the Forging Industry?

  • The integration of automation and Industry 4.0 technologies represents a significant manufacturing trend. This digital transformation optimizes production workflows and enhances precision across global supply chains.

  • The rapid integration of smart factory automated cells is fundamentally disrupting traditional manufacturing approaches by digitizing core production workflows. This technological evolution answers the urgent need for enhanced precision and strict operational cost control under modern compliance standards. By deploying finite element analysis simulation, engineers virtually identify defect risks before physical production begins.
  • Implementing metal flow optimization software helps plant managers achieve a 20% processing time reduction, significantly boosting daily throughput. Simultaneously, the installation of automated stations equipped with industrial robotics automation handling diminishes workplace injury risks and establishes immense production consistency. Leveraging predictive maintenance machinery data alongside near net shape forging techniques drives a 14% decrease in unplanned equipment downtime.

What challenges does the Forging Industry face during its growth?

  • High energy consumption and compliance with increasingly stringent environmental regulations constitute a critical challenge restricting overall industry growth.

  • Severe operational constraints stemming from soaring industrial energy consumption heavily challenge supply chain profitability. Heating enormous metal billets inherently generates massive utility overhead, forcing facility operators to prioritize extensive induction heating systems integration and sophisticated heat recovery decarbonization technologies. Achieving precise tolerances often causes substantial material loss during early fabrication stages.
  • Consequently, deploying rigid scrap rate minimization strategies alongside a rigorous porosity elimination process becomes essential to reduce raw material expenditure by a targeted 18%. While legacy processes struggle with extreme temperatures, ensuring adequate creep and oxidation resistance demands costly, specialized tooling.
  • Furthermore, the rising maturity of direct metal additive manufacturing intensifies competitive pressure, forcing factories to improve overall efficiency by 15%.

Exclusive Technavio Analysis on Customer Landscape

The forging market forecasting report includes the adoption lifecycle of the market, covering from the innovator’s stage to the laggard’s stage. It focuses on adoption rates in different regions based on penetration. Furthermore, the forging market report also includes key purchase criteria and drivers of price sensitivity to help companies evaluate and develop their market growth analysis strategies.
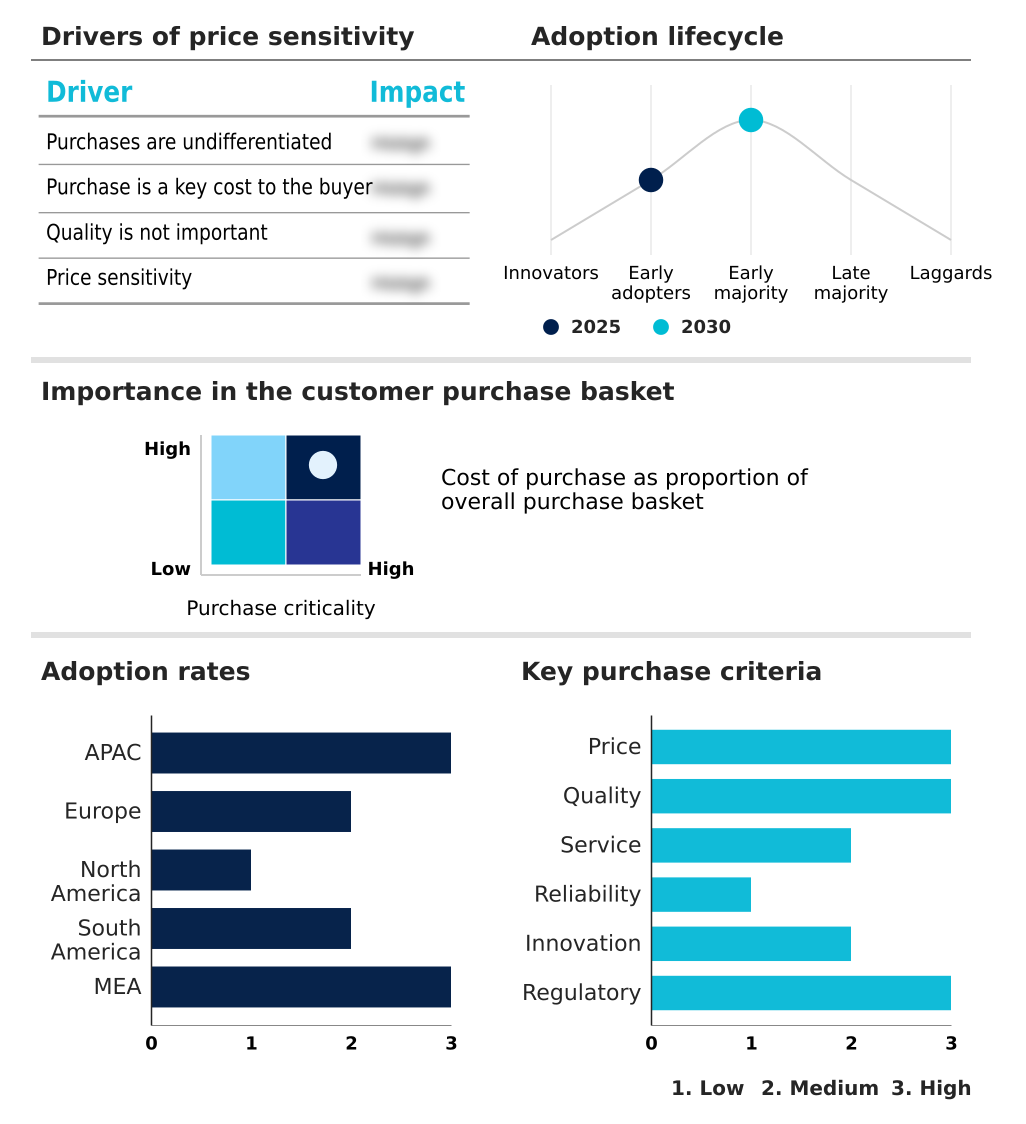
Customer Landscape of Forging Industry

Competitive Landscape

Companies are implementing various strategies, such as strategic alliances, forging market forecast, partnerships, mergers and acquisitions, geographical expansion, and product/service launches, to enhance their presence in the industry.

Alcoa Corp. - Delivering precision aluminum forgings, the entity provides specialized aerospace components and durable structural parts engineered to enhance lightweight performance and structural integrity across demanding high-stress industrial applications.

The industry research and growth report includes detailed analyses of the competitive landscape of the market and information about key companies, including:

  • Alcoa Corp.
  • Allegheny Technologies Inc.
  • American Axle Manufacturing
  • Arconic Corp.
  • Bharat Forge Ltd.
  • Bruck GmbH
  • CIE Automotive SA
  • CITIC Heavy Industries
  • ELLWOOD Group Inc.
  • Farinia SA
  • Forge Metal Group
  • HR Flanges Pvt Ltd
  • Larsen and Toubro Ltd.
  • Nippon Steel Corp.
  • Otto Fuchs KG
  • Ovako AB
  • Precision Castparts Corp.
  • Sypris Solutions Inc.
  • thyssenkrupp AG
  • voestalpine AG

Qualitative and quantitative analysis of companies has been conducted to help clients understand the wider business environment as well as the strengths and weaknesses of key industry players. Data is qualitatively analyzed to categorize companies as pure play, category-focused, industry-focused, and diversified; it is quantitatively analyzed to categorize companies as dominant, leading, strong, tentative, and weak.

Recent Development and News in Forging market

  • In the Diversified Metals and Mining industry, the rigorous implementation of the European Union Carbon Border Adjustment Mechanism compelled primary metal producers to optimize material efficiency by 15%, sequentially reducing raw material costs and directly impacting Forging demand by accelerating the shift toward low-carbon feedstocks.
  • Expanding investments in hydrometallurgical recycling frameworks increased the availability of secondary aluminum and high-grade titanium scrap by approximately 20%, lowering input volatility for downstream manufacturers and thereby enhancing supply chain resilience within the Forging market.
  • The rapid adoption of the ISO 14001 environmental management standard across tier-one mining operations mandated stricter emissions thresholds, forcing industrial processors to reduce energy intensity by a documented 10% benchmark, which subsequently generated heightened demand for energy-efficient forging components.
  • Strategic shifts toward direct lithium extraction and deep-shaft mechanization necessitated highly durable extraction machinery with 30% higher load capacities, driving heavy-equipment manufacturers to significantly increase the integration of shock-resistant Forging products capable of withstanding extreme underground operational stresses.

Dive into Technavio’s robust research methodology, blending expert interviews, extensive data synthesis, and validated models for unparalleled Forging Market insights. See full methodology.

Market Scope
Page number 311
Base year 2025
Historic period 2020-2024
Forecast period 2026-2030
Growth momentum & CAGR Accelerate at a CAGR of 6.8%
Market growth 2026-2030 USD 47590.3 million
Market structure Fragmented
YoY growth 2025-2026(%) 6.6%
Key countries China, India, Japan, South Korea, Australia, Singapore, Germany, Italy, France, UK, Spain, The Netherlands, US, Canada, Mexico, Brazil, Argentina, Chile, Saudi Arabia, UAE, South Africa, Turkey and Egypt
Competitive landscape Leading Companies, Market Positioning of Companies, Competitive Strategies, and Industry Risks

Request Free Sample

Research Analyst Overview

  • The industrial metal shaping sector is fundamentally restructuring its production paradigms to align with rigorous performance and sustainability metrics. Modern manufacturers aggressively implement advanced simulation software to predict localized stress distribution, drastically shortening early-stage product development lifecycles. Utilizing virtual reality prototypes allows engineering teams to map die designs completely digitally, averting costly physical trial and error phases entirely.
  • This shift to virtualization accelerates market readiness and tightly aligns with corporate budgeting mandates aimed at slashing pre-production expenditures. Facility operators utilizing these digitized workflows report a 22% reduction in initial prototyping costs. Furthermore, prioritizing streamlined material utilization directly mitigates the financial impact of volatile raw material pricing.
  • As global supply chains navigate advanced OEM specifications, utilizing automated fabrication provides critical flexibility for handling complex geometric constraints. Producing highly resilient turbine components ensures exceptional durability under extreme thermal loads, effectively reinforcing structural reliability and long-term compliance across critical industrial infrastructure projects.

What are the Key Data Covered in this Forging Market Research and Growth Report?

  • What is the expected growth of the Forging Market between 2026 and 2030?

    • USD 47.59 billion, at a CAGR of 6.8%

  • What segmentation does the market report cover?

    • The report is segmented by End-user (Automotive, Defense and aerospace, Shipbuilding, and Others), Raw Material (Carbon steel, Alloy steel, Aluminum, Magnesium, and Others), Application (Closed die forging, Open die forging, and Seamless rings) and Geography (APAC, Europe, North America, South America, Middle East and Africa)

  • Which regions are analyzed in the report?

    • APAC, Europe, North America, South America and Middle East and Africa

  • What are the key growth drivers and market challenges?

    • Automotive industry transition to electric vehicles and lightweighting, High energy consumption and stringent environmental regulations

  • Who are the major players in the Forging Market?

    • Alcoa Corp., Allegheny Technologies Inc., American Axle Manufacturing, Arconic Corp., Bharat Forge Ltd., Bruck GmbH, CIE Automotive SA, CITIC Heavy Industries, ELLWOOD Group Inc., Farinia SA, Forge Metal Group, HR Flanges Pvt Ltd, Larsen and Toubro Ltd., Nippon Steel Corp., Otto Fuchs KG, Ovako AB, Precision Castparts Corp., Sypris Solutions Inc., thyssenkrupp AG and voestalpine AG

Market Research Insights

  • The Forging Market demonstrates profound resilience as industrial sectors continually optimize their mechanical engineering workflows. By implementing advanced safety protocols, manufacturing facilities effectively monitor thermal dynamics, securing a 15% reduction in unplanned equipment downtime. The deployment of robotic manipulators enables safer and highly consistent billet transfer operations, directly decreasing manual labor costs and error margins.
  • Furthermore, utilizing automated data logs ensures precise microstructural integrity, yielding an 18% improvement in overall batch quality. With modernized reporting systems, administrators anticipate tool degradation before failure, improving capital equipment longevity. The integration of centralized networking significantly streamlines complex operational logistics, allowing enterprise suppliers to adapt quickly to stringent regulatory compliance matrices without compromising established mass production capabilities.

We can help! Our analysts can customize this forging market research report to meet your requirements.

Get in touch

1. Executive Summary

1.1 Market overview

Executive Summary - Chart on Market Overview
Executive Summary - Data Table on Market Overview
Executive Summary - Chart on Global Market Characteristics
Executive Summary - Chart on Market by Geography
Executive Summary - Chart on Market Segmentation by End-user
Executive Summary - Chart on Market Segmentation by Raw Material
Executive Summary - Chart on Market Segmentation by Application
Executive Summary - Chart on Incremental Growth
Executive Summary - Data Table on Incremental Growth
Executive Summary - Chart on Company Market Positioning

2. Technavio Analysis

2.1 Analysis of price sensitivity, lifecycle, customer purchase basket, adoption rates, and purchase criteria

2.2 Criticality of inputs and Factors of differentiation

Chart on Overview on criticality of inputs and factors of differentiation

2.3 Factors of disruption

Chart on Overview on factors of disruption

2.4 Impact of drivers and challenges

Chart on Impact of drivers and challenges in 2025 and 2030

3. Market Landscape

3.1 Market ecosystem

Chart on Parent Market
Data Table on - Parent Market

3.2 Market characteristics

Chart on Market characteristics analysis

3.3 Value chain analysis

Chart on Value chain analysis

4. Market Sizing

4.1 Market definition

Data Table on Offerings of companies included in the market definition

4.2 Market segment analysis

Market segments

4.3 Market size 2025

4.4 Market outlook: Forecast for 2025-2030

Chart on Global - Market size and forecast 2025-2030 ($ million)
Data Table on Global - Market size and forecast 2025-2030 ($ million)
Chart on Global Market: Year-over-year growth 2025-2030 (%)
Data Table on Global Market: Year-over-year growth 2025-2030 (%)

5. Historic Market Size

5.1 Global Forging Market 2020 - 2024

Historic Market Size - Data Table on Global Forging Market 2020 - 2024 ($ million)

5.2 End-user segment analysis 2020 - 2024

Historic Market Size - End-user Segment 2020 - 2024 ($ million)

5.3 Raw Material segment analysis 2020 - 2024

Historic Market Size - Raw Material Segment 2020 - 2024 ($ million)

5.4 Application segment analysis 2020 - 2024

Historic Market Size - Application Segment 2020 - 2024 ($ million)

5.5 Geography segment analysis 2020 - 2024

Historic Market Size - Geography Segment 2020 - 2024 ($ million)

5.6 Country segment analysis 2020 - 2024

Historic Market Size - Country Segment 2020 - 2024 ($ million)

6. Qualitative Analysis

6.1 Impact of AI on Global Forging Market

6.2 Impact of Geopolitical Conflicts on Global Forging Market

7. Five Forces Analysis

7.1 Five forces summary

Five forces analysis - Comparison between 2025 and 2030

7.2 Bargaining power of buyers

Bargaining power of buyers - Impact of key factors 2025 and 2030

7.3 Bargaining power of suppliers

Bargaining power of suppliers - Impact of key factors in 2025 and 2030

7.4 Threat of new entrants

Threat of new entrants - Impact of key factors in 2025 and 2030

7.5 Threat of substitutes

Threat of substitutes - Impact of key factors in 2025 and 2030

7.6 Threat of rivalry

Threat of rivalry - Impact of key factors in 2025 and 2030

7.7 Market condition

Chart on Market condition - Five forces 2025 and 2030

8. Market Segmentation by End-user

8.1 Market segments

Chart on End-user - Market share 2025-2030 (%)
Data Table on End-user - Market share 2025-2030 (%)

8.2 Comparison by End-user

Chart on Comparison by End-user
Data Table on Comparison by End-user

8.3 Automotive - Market size and forecast 2025-2030

Chart on Automotive - Market size and forecast 2025-2030 ($ million)
Data Table on Automotive - Market size and forecast 2025-2030 ($ million)
Chart on Automotive - Year-over-year growth 2025-2030 (%)
Data Table on Automotive - Year-over-year growth 2025-2030 (%)

8.4 Defense and aerospace - Market size and forecast 2025-2030

Chart on Defense and aerospace - Market size and forecast 2025-2030 ($ million)
Data Table on Defense and aerospace - Market size and forecast 2025-2030 ($ million)
Chart on Defense and aerospace - Year-over-year growth 2025-2030 (%)
Data Table on Defense and aerospace - Year-over-year growth 2025-2030 (%)

8.5 Shipbuilding - Market size and forecast 2025-2030

Chart on Shipbuilding - Market size and forecast 2025-2030 ($ million)
Data Table on Shipbuilding - Market size and forecast 2025-2030 ($ million)
Chart on Shipbuilding - Year-over-year growth 2025-2030 (%)
Data Table on Shipbuilding - Year-over-year growth 2025-2030 (%)

8.6 Others - Market size and forecast 2025-2030

Chart on Others - Market size and forecast 2025-2030 ($ million)
Data Table on Others - Market size and forecast 2025-2030 ($ million)
Chart on Others - Year-over-year growth 2025-2030 (%)
Data Table on Others - Year-over-year growth 2025-2030 (%)

8.7 Market opportunity by End-user

Market opportunity by End-user ($ million)
Data Table on Market opportunity by End-user ($ million)

9. Market Segmentation by Raw Material

9.1 Market segments

Chart on Raw Material - Market share 2025-2030 (%)
Data Table on Raw Material - Market share 2025-2030 (%)

9.2 Comparison by Raw Material

Chart on Comparison by Raw Material
Data Table on Comparison by Raw Material

9.3 Carbon steel - Market size and forecast 2025-2030

Chart on Carbon steel - Market size and forecast 2025-2030 ($ million)
Data Table on Carbon steel - Market size and forecast 2025-2030 ($ million)
Chart on Carbon steel - Year-over-year growth 2025-2030 (%)
Data Table on Carbon steel - Year-over-year growth 2025-2030 (%)

9.4 Alloy steel - Market size and forecast 2025-2030

Chart on Alloy steel - Market size and forecast 2025-2030 ($ million)
Data Table on Alloy steel - Market size and forecast 2025-2030 ($ million)
Chart on Alloy steel - Year-over-year growth 2025-2030 (%)
Data Table on Alloy steel - Year-over-year growth 2025-2030 (%)

9.5 Aluminum - Market size and forecast 2025-2030

Chart on Aluminum - Market size and forecast 2025-2030 ($ million)
Data Table on Aluminum - Market size and forecast 2025-2030 ($ million)
Chart on Aluminum - Year-over-year growth 2025-2030 (%)
Data Table on Aluminum - Year-over-year growth 2025-2030 (%)

9.6 Magnesium - Market size and forecast 2025-2030

Chart on Magnesium - Market size and forecast 2025-2030 ($ million)
Data Table on Magnesium - Market size and forecast 2025-2030 ($ million)
Chart on Magnesium - Year-over-year growth 2025-2030 (%)
Data Table on Magnesium - Year-over-year growth 2025-2030 (%)

9.7 Others - Market size and forecast 2025-2030

Chart on Others - Market size and forecast 2025-2030 ($ million)
Data Table on Others - Market size and forecast 2025-2030 ($ million)
Chart on Others - Year-over-year growth 2025-2030 (%)
Data Table on Others - Year-over-year growth 2025-2030 (%)

9.8 Market opportunity by Raw Material

Market opportunity by Raw Material ($ million)
Data Table on Market opportunity by Raw Material ($ million)

10. Market Segmentation by Application

10.1 Market segments

Chart on Application - Market share 2025-2030 (%)
Data Table on Application - Market share 2025-2030 (%)

10.2 Comparison by Application

Chart on Comparison by Application
Data Table on Comparison by Application

10.3 Closed die forging - Market size and forecast 2025-2030

Chart on Closed die forging - Market size and forecast 2025-2030 ($ million)
Data Table on Closed die forging - Market size and forecast 2025-2030 ($ million)
Chart on Closed die forging - Year-over-year growth 2025-2030 (%)
Data Table on Closed die forging - Year-over-year growth 2025-2030 (%)

10.4 Open die forging - Market size and forecast 2025-2030

Chart on Open die forging - Market size and forecast 2025-2030 ($ million)
Data Table on Open die forging - Market size and forecast 2025-2030 ($ million)
Chart on Open die forging - Year-over-year growth 2025-2030 (%)
Data Table on Open die forging - Year-over-year growth 2025-2030 (%)

10.5 Seamless rings - Market size and forecast 2025-2030

Chart on Seamless rings - Market size and forecast 2025-2030 ($ million)
Data Table on Seamless rings - Market size and forecast 2025-2030 ($ million)
Chart on Seamless rings - Year-over-year growth 2025-2030 (%)
Data Table on Seamless rings - Year-over-year growth 2025-2030 (%)

10.6 Market opportunity by Application

Market opportunity by Application ($ million)
Data Table on Market opportunity by Application ($ million)

11. Customer Landscape

11.1 Customer landscape overview

Analysis of price sensitivity, lifecycle, customer purchase basket, adoption rates, and purchase criteria

12. Geographic Landscape

12.1 Geographic segmentation

Chart on Market share by geography 2025-2030 (%)
Data Table on Market share by geography 2025-2030 (%)

12.2 Geographic comparison

Chart on Geographic comparison
Data Table on Geographic comparison

12.3 APAC - Market size and forecast 2025-2030

Chart on APAC - Market size and forecast 2025-2030 ($ million)
Data Table on APAC - Market size and forecast 2025-2030 ($ million)
Chart on APAC - Year-over-year growth 2025-2030 (%)
Data Table on APAC - Year-over-year growth 2025-2030 (%)
Chart on Regional Comparison - APAC
Data Table on Regional Comparison - APAC

12.3.1 China - Market size and forecast 2025-2030

Chart on China - Market size and forecast 2025-2030 ($ million)
Data Table on China - Market size and forecast 2025-2030 ($ million)
Chart on China - Year-over-year growth 2025-2030 (%)
Data Table on China - Year-over-year growth 2025-2030 (%)

12.3.2 India - Market size and forecast 2025-2030

Chart on India - Market size and forecast 2025-2030 ($ million)
Data Table on India - Market size and forecast 2025-2030 ($ million)
Chart on India - Year-over-year growth 2025-2030 (%)
Data Table on India - Year-over-year growth 2025-2030 (%)

12.3.3 Japan - Market size and forecast 2025-2030

Chart on Japan - Market size and forecast 2025-2030 ($ million)
Data Table on Japan - Market size and forecast 2025-2030 ($ million)
Chart on Japan - Year-over-year growth 2025-2030 (%)
Data Table on Japan - Year-over-year growth 2025-2030 (%)

12.3.4 South Korea - Market size and forecast 2025-2030

Chart on South Korea - Market size and forecast 2025-2030 ($ million)
Data Table on South Korea - Market size and forecast 2025-2030 ($ million)
Chart on South Korea - Year-over-year growth 2025-2030 (%)
Data Table on South Korea - Year-over-year growth 2025-2030 (%)

12.3.5 Australia - Market size and forecast 2025-2030

Chart on Australia - Market size and forecast 2025-2030 ($ million)
Data Table on Australia - Market size and forecast 2025-2030 ($ million)
Chart on Australia - Year-over-year growth 2025-2030 (%)
Data Table on Australia - Year-over-year growth 2025-2030 (%)

12.3.6 Singapore - Market size and forecast 2025-2030

Chart on Singapore - Market size and forecast 2025-2030 ($ million)
Data Table on Singapore - Market size and forecast 2025-2030 ($ million)
Chart on Singapore - Year-over-year growth 2025-2030 (%)
Data Table on Singapore - Year-over-year growth 2025-2030 (%)

12.4 Europe - Market size and forecast 2025-2030

Chart on Europe - Market size and forecast 2025-2030 ($ million)
Data Table on Europe - Market size and forecast 2025-2030 ($ million)
Chart on Europe - Year-over-year growth 2025-2030 (%)
Data Table on Europe - Year-over-year growth 2025-2030 (%)
Chart on Regional Comparison - Europe
Data Table on Regional Comparison - Europe

12.4.1 Germany - Market size and forecast 2025-2030

Chart on Germany - Market size and forecast 2025-2030 ($ million)
Data Table on Germany - Market size and forecast 2025-2030 ($ million)
Chart on Germany - Year-over-year growth 2025-2030 (%)
Data Table on Germany - Year-over-year growth 2025-2030 (%)

12.4.2 Italy - Market size and forecast 2025-2030

Chart on Italy - Market size and forecast 2025-2030 ($ million)
Data Table on Italy - Market size and forecast 2025-2030 ($ million)
Chart on Italy - Year-over-year growth 2025-2030 (%)
Data Table on Italy - Year-over-year growth 2025-2030 (%)

12.4.3 France - Market size and forecast 2025-2030

Chart on France - Market size and forecast 2025-2030 ($ million)
Data Table on France - Market size and forecast 2025-2030 ($ million)
Chart on France - Year-over-year growth 2025-2030 (%)
Data Table on France - Year-over-year growth 2025-2030 (%)

12.4.4 UK - Market size and forecast 2025-2030

Chart on UK - Market size and forecast 2025-2030 ($ million)
Data Table on UK - Market size and forecast 2025-2030 ($ million)
Chart on UK - Year-over-year growth 2025-2030 (%)
Data Table on UK - Year-over-year growth 2025-2030 (%)

12.4.5 Spain - Market size and forecast 2025-2030

Chart on Spain - Market size and forecast 2025-2030 ($ million)
Data Table on Spain - Market size and forecast 2025-2030 ($ million)
Chart on Spain - Year-over-year growth 2025-2030 (%)
Data Table on Spain - Year-over-year growth 2025-2030 (%)

12.4.6 The Netherlands - Market size and forecast 2025-2030

Chart on The Netherlands - Market size and forecast 2025-2030 ($ million)
Data Table on The Netherlands - Market size and forecast 2025-2030 ($ million)
Chart on The Netherlands - Year-over-year growth 2025-2030 (%)
Data Table on The Netherlands - Year-over-year growth 2025-2030 (%)

12.5 North America - Market size and forecast 2025-2030

Chart on North America - Market size and forecast 2025-2030 ($ million)
Data Table on North America - Market size and forecast 2025-2030 ($ million)
Chart on North America - Year-over-year growth 2025-2030 (%)
Data Table on North America - Year-over-year growth 2025-2030 (%)
Chart on Regional Comparison - North America
Data Table on Regional Comparison - North America

12.5.1 US - Market size and forecast 2025-2030

Chart on US - Market size and forecast 2025-2030 ($ million)
Data Table on US - Market size and forecast 2025-2030 ($ million)
Chart on US - Year-over-year growth 2025-2030 (%)
Data Table on US - Year-over-year growth 2025-2030 (%)

12.5.2 Canada - Market size and forecast 2025-2030

Chart on Canada - Market size and forecast 2025-2030 ($ million)
Data Table on Canada - Market size and forecast 2025-2030 ($ million)
Chart on Canada - Year-over-year growth 2025-2030 (%)
Data Table on Canada - Year-over-year growth 2025-2030 (%)

12.5.3 Mexico - Market size and forecast 2025-2030

Chart on Mexico - Market size and forecast 2025-2030 ($ million)
Data Table on Mexico - Market size and forecast 2025-2030 ($ million)
Chart on Mexico - Year-over-year growth 2025-2030 (%)
Data Table on Mexico - Year-over-year growth 2025-2030 (%)

12.6 South America - Market size and forecast 2025-2030

Chart on South America - Market size and forecast 2025-2030 ($ million)
Data Table on South America - Market size and forecast 2025-2030 ($ million)
Chart on South America - Year-over-year growth 2025-2030 (%)
Data Table on South America - Year-over-year growth 2025-2030 (%)
Chart on Regional Comparison - South America
Data Table on Regional Comparison - South America

12.6.1 Brazil - Market size and forecast 2025-2030

Chart on Brazil - Market size and forecast 2025-2030 ($ million)
Data Table on Brazil - Market size and forecast 2025-2030 ($ million)
Chart on Brazil - Year-over-year growth 2025-2030 (%)
Data Table on Brazil - Year-over-year growth 2025-2030 (%)

12.6.2 Argentina - Market size and forecast 2025-2030

Chart on Argentina - Market size and forecast 2025-2030 ($ million)
Data Table on Argentina - Market size and forecast 2025-2030 ($ million)
Chart on Argentina - Year-over-year growth 2025-2030 (%)
Data Table on Argentina - Year-over-year growth 2025-2030 (%)

12.6.3 Chile - Market size and forecast 2025-2030

Chart on Chile - Market size and forecast 2025-2030 ($ million)
Data Table on Chile - Market size and forecast 2025-2030 ($ million)
Chart on Chile - Year-over-year growth 2025-2030 (%)
Data Table on Chile - Year-over-year growth 2025-2030 (%)

12.7 Middle East and Africa - Market size and forecast 2025-2030

Chart on Middle East and Africa - Market size and forecast 2025-2030 ($ million)
Data Table on Middle East and Africa - Market size and forecast 2025-2030 ($ million)
Chart on Middle East and Africa - Year-over-year growth 2025-2030 (%)
Data Table on Middle East and Africa - Year-over-year growth 2025-2030 (%)
Chart on Regional Comparison - Middle East and Africa
Data Table on Regional Comparison - Middle East and Africa

12.7.1 Saudi Arabia - Market size and forecast 2025-2030

Chart on Saudi Arabia - Market size and forecast 2025-2030 ($ million)
Data Table on Saudi Arabia - Market size and forecast 2025-2030 ($ million)
Chart on Saudi Arabia - Year-over-year growth 2025-2030 (%)
Data Table on Saudi Arabia - Year-over-year growth 2025-2030 (%)

12.7.2 UAE - Market size and forecast 2025-2030

Chart on UAE - Market size and forecast 2025-2030 ($ million)
Data Table on UAE - Market size and forecast 2025-2030 ($ million)
Chart on UAE - Year-over-year growth 2025-2030 (%)
Data Table on UAE - Year-over-year growth 2025-2030 (%)

12.7.3 South Africa - Market size and forecast 2025-2030

Chart on South Africa - Market size and forecast 2025-2030 ($ million)
Data Table on South Africa - Market size and forecast 2025-2030 ($ million)
Chart on South Africa - Year-over-year growth 2025-2030 (%)
Data Table on South Africa - Year-over-year growth 2025-2030 (%)

12.7.4 Turkey - Market size and forecast 2025-2030

Chart on Turkey - Market size and forecast 2025-2030 ($ million)
Data Table on Turkey - Market size and forecast 2025-2030 ($ million)
Chart on Turkey - Year-over-year growth 2025-2030 (%)
Data Table on Turkey - Year-over-year growth 2025-2030 (%)

12.7.5 Egypt - Market size and forecast 2025-2030

Chart on Egypt - Market size and forecast 2025-2030 ($ million)
Data Table on Egypt - Market size and forecast 2025-2030 ($ million)
Chart on Egypt - Year-over-year growth 2025-2030 (%)
Data Table on Egypt - Year-over-year growth 2025-2030 (%)

12.8 Market opportunity by geography

Market opportunity by geography ($ million)
Data Tables on Market opportunity by geography ($ million)

13. Drivers, Challenges, and Opportunity

13.1 Market drivers

Automotive industry transition to electric vehicles and lightweighting
Sustained demand from aerospace and defense sectors
Global infrastructure development and industrial expansion

13.2 Market challenges

High energy consumption and stringent environmental regulations
Skilled labor shortage and aging workforce
Increasing competition from alternative manufacturing processes

13.3 Impact of drivers and challenges

Impact of drivers and challenges in 2025 and 2030

13.4 Market opportunities

Integration of automation and industry 4.0 technologies
Growing demand for lightweight and advanced materials
Increasing emphasis on near net shape forging

14. Competitive Landscape

14.1 Overview

14.2

Overview on criticality of inputs and factors of differentiation

14.3 Landscape disruption

Overview on factors of disruption

14.4 Industry risks

Impact of key risks on business

15. Competitive Analysis

15.1 Companies profiled

Companies covered

15.2 Company ranking index

15.3 Market positioning of companies

Matrix on companies position and classification

15.4 Alcoa Corp.

Alcoa Corp. - Overview
Alcoa Corp. - Business segments
Alcoa Corp. - Key news
Alcoa Corp. - Key offerings
Alcoa Corp. - Segment focus
SWOT

15.5 Allegheny Technologies Inc.

Allegheny Technologies Inc. - Overview
Allegheny Technologies Inc. - Business segments
Allegheny Technologies Inc. - Key offerings
Allegheny Technologies Inc. - Segment focus
SWOT

15.6 American Axle Manufacturing

American Axle Manufacturing - Overview
American Axle Manufacturing - Business segments
American Axle Manufacturing - Key offerings
American Axle Manufacturing - Segment focus
SWOT

15.7 Arconic Corp.

Arconic Corp. - Overview
Arconic Corp. - Product / Service
Arconic Corp. - Key offerings
SWOT

15.8 CIE Automotive SA

CIE Automotive SA - Overview
CIE Automotive SA - Product / Service
CIE Automotive SA - Key offerings
SWOT

15.9 CITIC Heavy Industries

CITIC Heavy Industries - Overview
CITIC Heavy Industries - Product / Service
CITIC Heavy Industries - Key offerings
SWOT

15.10 Farinia SA

Farinia SA - Overview
Farinia SA - Product / Service
Farinia SA - Key offerings
SWOT

15.11 Larsen and Toubro Ltd.

Larsen and Toubro Ltd. - Overview
Larsen and Toubro Ltd. - Business segments
Larsen and Toubro Ltd. - Key offerings
Larsen and Toubro Ltd. - Segment focus
SWOT

15.12 Nippon Steel Corp.

Nippon Steel Corp. - Overview
Nippon Steel Corp. - Business segments
Nippon Steel Corp. - Key offerings
Nippon Steel Corp. - Segment focus
SWOT

15.13 Otto Fuchs KG

Otto Fuchs KG - Overview
Otto Fuchs KG - Product / Service
Otto Fuchs KG - Key offerings
SWOT

15.14 Ovako AB

Ovako AB - Overview
Ovako AB - Product / Service
Ovako AB - Key offerings
SWOT

15.15 Precision Castparts Corp.

Precision Castparts Corp. - Overview
Precision Castparts Corp. - Product / Service
Precision Castparts Corp. - Key offerings
SWOT

15.16 Sypris Solutions Inc.

Sypris Solutions Inc. - Overview
Sypris Solutions Inc. - Business segments
Sypris Solutions Inc. - Key offerings
Sypris Solutions Inc. - Segment focus
SWOT

15.17 thyssenkrupp AG

thyssenkrupp AG - Overview
thyssenkrupp AG - Business segments
thyssenkrupp AG - Key offerings
thyssenkrupp AG - Segment focus
SWOT

15.18 voestalpine AG

voestalpine AG - Overview
voestalpine AG - Business segments
voestalpine AG - Key offerings
voestalpine AG - Segment focus
SWOT

16. Appendix

16.1 Scope of the report

Market definition
Objectives
Notes and caveats

16.2 Inclusions and exclusions checklist

Inclusions checklist
Exclusions checklist

16.3 Currency conversion rates for US$

16.4 Research methodology

16.5 Data procurement

Information sources

16.6 Data validation

16.7 Validation techniques employed for market sizing

16.8 Data synthesis

16.9 360 degree market analysis

16.10 List of abbreviations

Research Methodology

Technavio presents a detailed picture of the market by way of study, synthesis, and summation of data from multiple sources. The analysts have presented the various facets of the market with a particular focus on identifying the key industry influencers. The data thus presented is comprehensive, reliable, and the result of extensive research, both primary and secondary.

INFORMATION SOURCES

Primary sources

  • Manufacturers and suppliers
  • Channel partners
  • Industry experts
  • Strategic decision makers

Secondary sources

  • Industry journals and periodicals
  • Government data
  • Financial reports of key industry players
  • Historical data
  • Press releases

DATA ANALYSIS

Data Synthesis

  • Collation of data
  • Estimation of key figures
  • Analysis of derived insights

Data Validation

  • Triangulation with data models
  • Reference against proprietary databases
  • Corroboration with industry experts

REPORT WRITING

Qualitative

  • Market drivers
  • Market challenges
  • Market trends
  • Five forces analysis

Quantitative

  • Market size and forecast
  • Market segmentation
  • Geographical insights
  • Competitive landscape

Interested in this report?

Get your sample now to see our research methodology and insights!

Download Now

Frequently Asked Questions

Forging market growth will increase by USD 47590.3 million during 2026-2030.

The Forging market is expected to grow at a CAGR of 6.8% during 2026-2030.

Forging market is segmented by End-user (Automotive, Defense and aerospace, Shipbuilding, Others) Raw material (Carbon steel, Alloy steel, Aluminum, Magnesium, Others) Application (Closed die forging, Open die forging, Seamless rings)

Alcoa Corp., Allegheny Technologies Inc., American Axle Manufacturing, Arconic Corp., Bharat Forge Ltd., Bruck GmbH, CIE Automotive SA, CITIC Heavy Industries, ELLWOOD Group Inc., Farinia SA, Forge Metal Group, HR Flanges Pvt Ltd, Larsen and Toubro Ltd., Nippon Steel Corp., Otto Fuchs KG, Ovako AB, Precision Castparts Corp., Sypris Solutions Inc., thyssenkrupp AG, voestalpine AG are a few of the key vendors in the Forging market.

APAC will register the highest growth rate of 61.5% among the other regions. Therefore, the Forging market in APAC is expected to garner significant business opportunities for the vendors during the forecast period.

China, India, Japan, South Korea, Australia, Singapore, Germany, Italy, France, UK, Spain, The Netherlands, US, Canada, Mexico, Brazil, Argentina, Chile, Saudi Arabia, UAE, South Africa, Turkey, Egypt

  • Automotive industry transition to electric vehicles and lightweighting is the driving factor this market.

The Forging market vendors should focus on grabbing business opportunities from the End-user segment as it accounted for the largest market share in the base year.
RIA - Research AI Assistant
Ask RIA
