France Pet Food Market Size 2025-2029
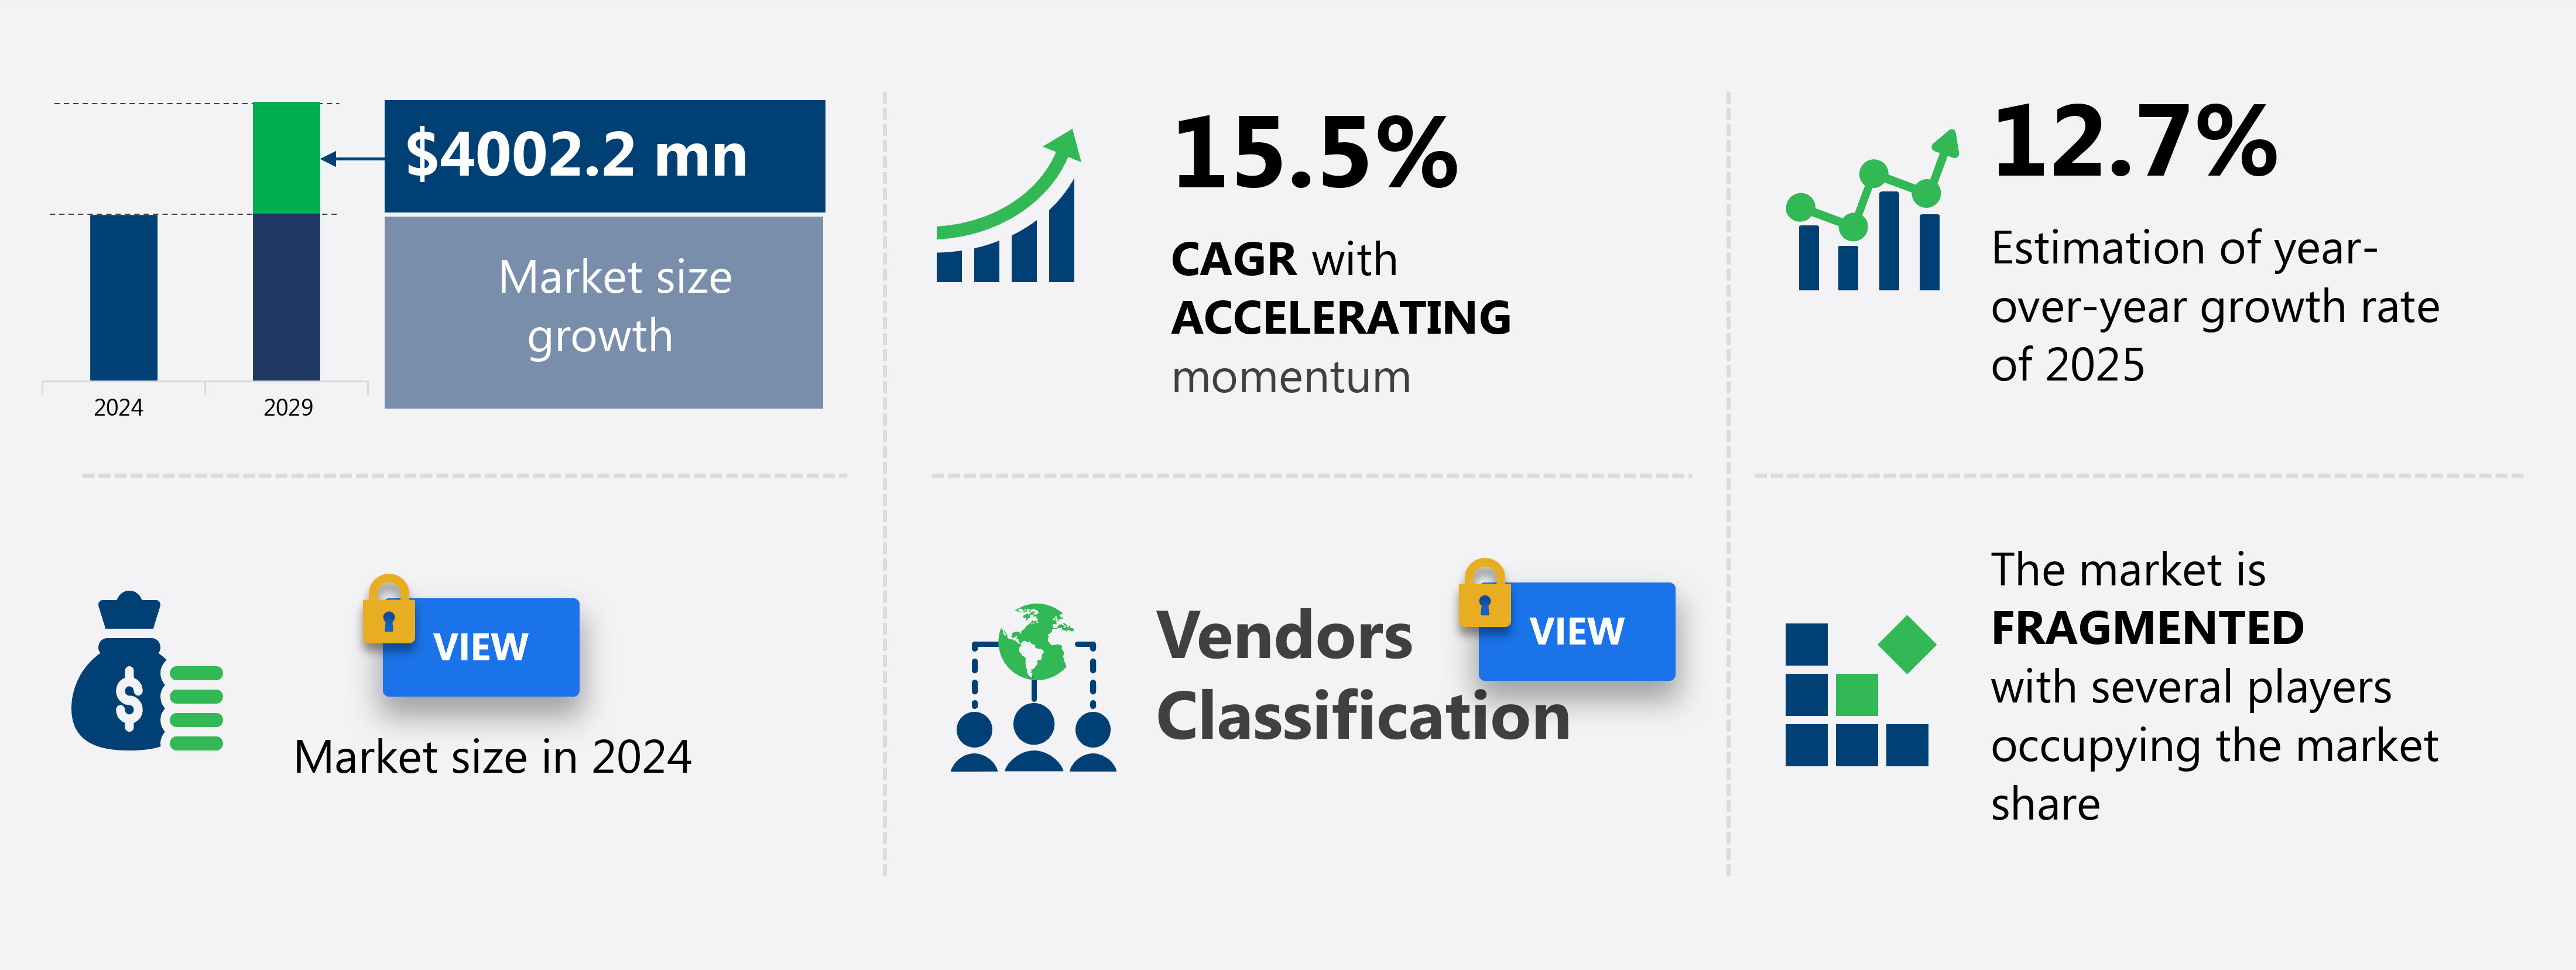
The france pet food market size is valued to increase USD 4 billion, at a CAGR of 15.5% from 2024 to 2029. Rising awareness of pet nutrition will drive the france pet food market.
Major Market Trends & Insights
- By Product - Dry food segment was valued at USD 1.1 billion in 2022
- By Type - Dog food segment accounted for the largest market revenue share in 2022
- CAGR from 2024 to 2029 : 15.5%
Market Summary
- The market is a dynamic and continually evolving sector, characterized by innovations in core technologies and applications, shifting consumer preferences, and regulatory developments. A significant trend in this market is the rising awareness among French pet owners regarding the importance of proper pet nutrition. According to a recent study, over 50% of French pet owners now opt for premium or super-premium pet food, prioritizing high-quality ingredients and specific health benefits. Another emerging trend is the growing demand for organic pet food, driven by concerns over pet allergies and food sensitivities.
- Despite these opportunities, the market faces challenges, including increasing competition and regulatory compliance requirements. As of 2021, the market is estimated to account for approximately 2.5 billion euros in sales, reflecting the significant potential for growth in this sector.
What will be the Size of the France Pet Food Market during the forecast period?
Get Key Insights on Market Forecast (PDF) Request Free Sample
How is the Pet Food in France Market Segmented ?
The pet food in france industry research report provides comprehensive data (region-wise segment analysis), with forecasts and estimates in "USD million" for the period 2025-2029, as well as historical data from 2019-2023 for the following segments.
- Product
- Dry food
- Snacks and treats
- Wet food
- Type
- Dog food
- Cat food
- Others
- Source
- Animal-based
- Plant-based
- Others
- Geography
- Europe
- France
- Europe
By Product Insights
The dry food segment is estimated to witness significant growth during the forecast period.
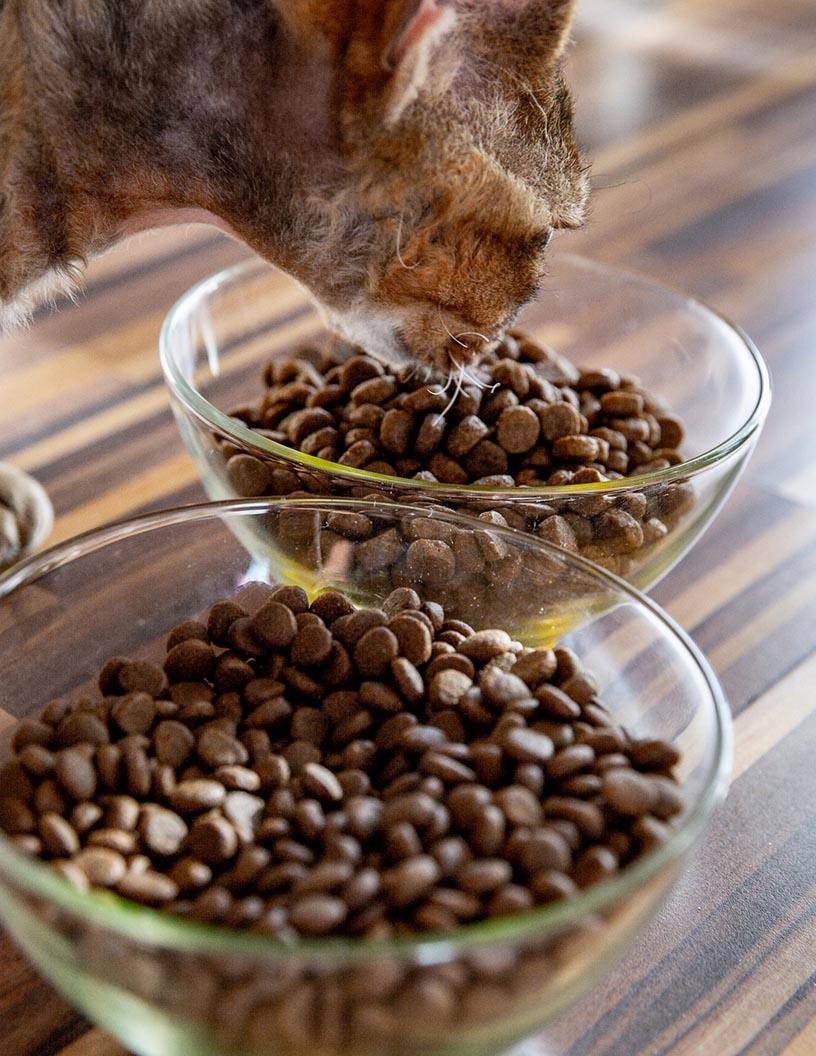
The market exhibits ongoing evolution, with dry food remaining a preferred choice for many pet owners. Dry food's popularity stems from its ease of transportation and extended shelf life compared to wet pet foods, such as canned food. Dry food, primarily composed of seed-based and grain-based proteins, offers a limited amount of animal-derived proteins. Convenience is further enhanced through the availability of dry food in packaging like stand-up zip lock pouches. However, the dry food segment faces challenges, including periodic health warnings and increasing recalls. Quality control testing, including nutritional labeling, mineral composition, and amino acid profile analysis, is crucial to ensure pet food safety and adherence to AAFCO nutrient profiles.
Ingredient sourcing, pet food processing, and preservation techniques also play significant roles in maintaining pet food quality. Regulations governing pet food manufacturing and pet food safety are stringently enforced to minimize microbial contamination and ensure fiber content, protein and fat digestibility, and vitamin levels meet industry standards.
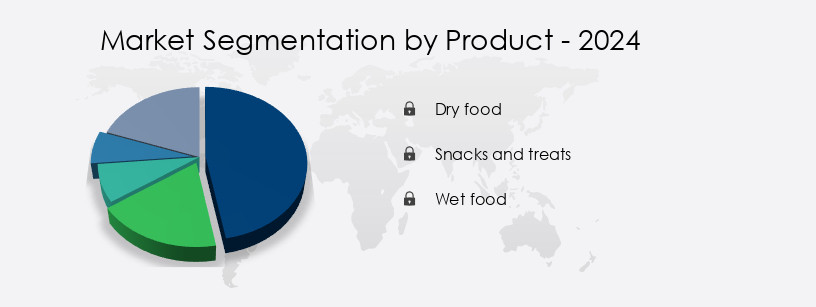
The Dry food segment was valued at USD 1.1 billion in 2019 and showed a gradual increase during the forecast period.
Market Dynamics
Our researchers analyzed the data with 2024 as the base year, along with the key drivers, trends, and challenges. A holistic analysis of drivers will help companies refine their marketing strategies to gain a competitive advantage.
The market is a significant and dynamic industry, characterized by various trends and factors shaping its growth. Pet food companies in France employ innovative sourcing strategies for ingredients, focusing on both local and international suppliers to ensure high-quality raw materials. The impact of processing on pet food nutrition remains a critical concern, with an increasing emphasis on maintaining nutritional value and palatability. Consumer perception of pet food quality is a primary driver for market growth, with packaging material selection playing a crucial role in enhancing product appeal and extending shelf life. Methods for pet food shelf life extension, such as high-pressure processing and vacuum packaging, are gaining popularity to address consumer demands for freshness and safety.
The effects of diet on pet health parameters are a key focus for pet food manufacturers, leading to the development of functional pet food products catering to specific health needs. Regulatory compliance with pet food labeling requirements is essential, as is the optimization of pet food formulation processes to meet these standards. Sustainable practices in the pet food supply chain are increasingly important, with a growing emphasis on reducing waste and optimizing production lines. Novel protein sources, such as insect-based proteins, are gaining traction as potential alternatives to traditional animal proteins. Consumer trends favoring functional pet food products are driving innovation, with a focus on improving pet health and wellbeing.
Quality control procedures in pet food manufacturing are essential for ensuring consistent product quality and safety. Measuring pet food palatability factors and determining nutrient profiles are critical components of the production process. Sensory evaluation methods and measuring digestibility indices are used to assess product quality and optimize formulations. Innovative pet food processing technologies, such as high-pressure processing and extrusion cooking, are transforming the industry, offering improved product quality, safety, and sustainability. The market is highly competitive, with a minority of players accounting for a significant share due to their ability to adapt to changing consumer demands and regulatory requirements.

What are the key market drivers leading to the rise in the adoption of Pet Food in France Industry?
- The significant rise in consumer awareness regarding the importance of proper pet nutrition serves as the primary catalyst for market growth.
- The French pet food market has witnessed significant growth due to the increasing awareness among pet owners regarding their pets' nutritional requirements. Homemade diets may not cater to the distinct nutritional needs of various pets. Consequently, potential health risks arise when pets are fed human food containing harmful ingredients. For instance, methylxanthines in chocolates can cause diarrhea, cardiac arrhythmias, convulsions, polyuria, and even death in dogs.
- Macadamia nuts pose a threat to cats and dogs, leading to depression, vomiting, muscle spasms, heat, and tachycardia. Despite the popularity of homemade diets using organic and vegetarian products, nutritional deficiencies remain a concern. The importance of balanced and complete pet nutrition has fueled the demand for commercially produced pet food in France.
What are the market trends shaping the Pet Food in France Industry?
- The increasing demand for organic pet food represents a significant market trend. Organic pet food continues to gain popularity among pet owners.
- Organic pet food, composed of raw materials free from pesticides, fertilizers, and chemicals, is gaining popularity among French pet owners. This shift is driven by the increasing awareness of pet health and wellness, as well as the pet humanization trend. Plant-based ingredients, grown without pesticides, artificial fertilizers, genetic modification, irradiation, and sewage sludge, and animal ingredients from animals raised on organic feed and given access to the outdoors, are the core components of organic pet food. The preference for organic options reflects the growing trend towards natural and organic food choices in human diets.
- This demand is not limited to France alone, as pet owners worldwide seek to provide the best possible nutrition for their pets. The ongoing evolution of the pet food market underscores the importance of catering to this consumer preference, making organic pet food a significant and dynamic sector.
What challenges does the Pet Food in France Industry face during its growth?
- The rise in pet allergies among pet owners poses a significant challenge to the industry's growth, necessitating continuous research and innovation to develop hypoallergenic pet breeds and products.
- Animals, particularly those with fur or feathers, can carry harmful bacteria like Campylobacter jejuni, leading to diseases such as cryptosporidiosis in humans, particularly children. Allergic reactions to animals are another common issue, with around 15%-30% of asthma and allergic rhinitis cases attributed to dogs or cats. Pet dander, saliva, and urine can trigger abnormal immune responses in sensitive individuals. The prevalence of pet-related allergies and diseases underscores the importance of animal hygiene and responsible pet ownership. This issue transcends various sectors, including healthcare, agriculture, and pet care industries, as they grapple with the health implications of animal contact.
- The ongoing research and development in these sectors aim to mitigate the risks associated with animal interactions, ensuring the well-being of both animals and humans.
Exclusive Technavio Analysis on Customer Landscape
The france pet food market forecasting report includes the adoption lifecycle of the market, covering from the innovator’s stage to the laggard’s stage. It focuses on adoption rates in different regions based on penetration. Furthermore, the france pet food market report also includes key purchase criteria and drivers of price sensitivity to help companies evaluate and develop their market growth analysis strategies.
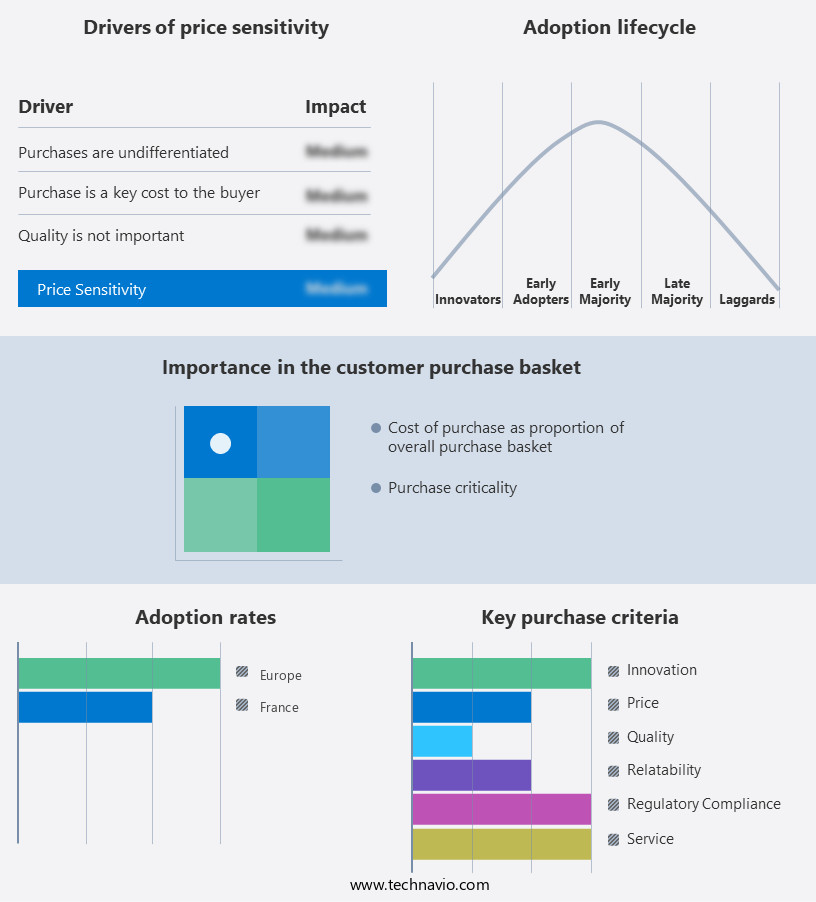
Customer Landscape of Pet Food in France Industry
Competitive Landscape
Companies are implementing various strategies, such as strategic alliances, france pet food market forecast, partnerships, mergers and acquisitions, geographical expansion, and product/service launches, to enhance their presence in the industry.
Agronutris - This company specializes in the production and distribution of high-quality pet food brands, including Liboost, Fairtil, and Ultrain. These offerings cater to diverse pet dietary needs, ensuring optimal nutrition and wellbeing for pets worldwide. The company's commitment to research and innovation drives the development of advanced pet food solutions.
The industry research and growth report includes detailed analyses of the competitive landscape of the market and information about key companies, including:
- Agronutris
- Archer Daniels Midland Co.
- Colgate Palmolive Co.
- dsm-firmenich
- Faunafeed
- Gersycoop
- Groupe Legris Industries
- Interquell GmbH
- Kerry Group Plc
- Manghebati SAS
- Nestle SA
- Nestor
- Orange Pet Nutrition Pvt. Ltd.
- Pets Choice Ltd.
- Roquette Freres SA
- sarl MINOTERIE FARGES
- SAS VERNON Pierre
- Tiernahrung Deuerer GmbH
- United Petfood Producers NV
- Valorex
Qualitative and quantitative analysis of companies has been conducted to help clients understand the wider business environment as well as the strengths and weaknesses of key industry players. Data is qualitatively analyzed to categorize companies as pure play, category-focused, industry-focused, and diversified; it is quantitatively analyzed to categorize companies as dominant, leading, strong, tentative, and weak.
Recent Development and News in Pet Food Market In France
- In January 2024, Mars, Incorporated, a leading global food company, announced the launch of a new line of pet food products under its popular brand, Pedigree, in France. The new range, Pedigree Vitality, focuses on providing balanced nutrition for adult dogs (Mars, Inc. Press Release, 2024).
- In March 2024, Nestlé Purina PetCare, a subsidiary of Swiss multinational food and drink processing conglomerate Nestlé, entered into a strategic partnership with French e-commerce platform Cdiscount to boost online sales of pet food products. The collaboration aimed to offer Cdiscount customers a wider selection of pet food options and improve delivery services (Nestlé Purina Press Release, 2024).
- In May 2025, Royal Canin, a French pet food manufacturer, completed the acquisition of a majority stake in German pet food company, Tierfood. The acquisition was expected to strengthen Royal Canin's position in the European pet food market and expand its product offerings (Royal Canin Press Release, 2025).
- In the same month, the French Ministry of Agriculture and Food announced the implementation of new regulations to improve pet food labeling and transparency. The new rules required pet food manufacturers to provide clearer information on ingredients, nutritional values, and origin (French Ministry of Agriculture and Food Press Release, 2025).
Dive into Technavio’s robust research methodology, blending expert interviews, extensive data synthesis, and validated models for unparalleled France Pet Food Market insights. See full methodology.
|
Market Scope |
|
|
Report Coverage |
Details |
|
Page number |
162 |
|
Base year |
2024 |
|
Historic period |
2019-2023 |
|
Forecast period |
2025-2029 |
|
Growth momentum & CAGR |
Accelerate at a CAGR of 15.5% |
|
Market growth 2025-2029 |
USD 4002.2 million |
|
Market structure |
Fragmented |
|
YoY growth 2024-2025(%) |
12.7 |
|
Key countries |
France |
|
Competitive landscape |
Leading Companies, Market Positioning of Companies, Competitive Strategies, and Industry Risks |
Research Analyst Overview
- The market continues to evolve, with significant shifts in consumer preferences and industry trends. One notable development is the increasing popularity of pouches pet food, which now accounts for a substantial market share. This format offers convenience and variety, appealing to pet owners seeking flexible feeding options. Nutritional labeling has become a crucial factor in pet food purchasing decisions. Transparency regarding amino acid profiles, mineral composition, and vitamin levels is essential for consumers, who demand high-quality, balanced diets for their pets. Quality control testing is rigorous to ensure pet food safety, with stringent regulations in place to prevent microbial contamination.
- Pet food processing techniques, such as extrusion and canning, have evolved to enhance palatability and digestibility. Ingredient sourcing is another critical area, with a growing focus on sustainable and ethically-sourced ingredients. The pet food industry places great importance on animal nutrition, ensuring that pet food meets the AAFCO nutrient profiles for various species and life stages. Pet food regulations are continually updated to maintain the highest standards of safety and quality. Shelf life testing and fat content analysis are essential components of quality control, ensuring that pet food remains safe and nutritent-rich throughout its lifecycle. The supply chain management of pet food ingredients is also a significant concern, with efforts to minimize disruptions and maintain consistency in product offerings.
- Both wet and dry pet food formats, including canned and extruded kibble, undergo extensive processing to ensure optimal texture, palatability, and nutritional value. The pet food manufacturing process is highly regulated, with strict adherence to quality control measures to prevent recalls and maintain consumer trust. In conclusion, the market is a dynamic and evolving industry, with a strong focus on quality, safety, and transparency. Consumer preferences and regulatory requirements continue to shape the market, driving innovation and growth in various areas, including pouches, nutritional labeling, and pet food processing.
What are the Key Data Covered in this France Pet Food Market Research and Growth Report?
-
What is the expected growth of the France Pet Food Market between 2025 and 2029?
-
USD 4 billion, at a CAGR of 15.5%
-
-
What segmentation does the market report cover?
-
The report segmented by Product (Dry food, Snacks and treats, and Wet food), Type (Dog food, Cat food, and Others), Source (Animal-based, Plant-based, and Others), and Geography (Europe)
-
-
Which regions are analyzed in the report?
-
France
-
-
What are the key growth drivers and market challenges?
-
Rising awareness of pet nutrition, Increasing instances of pet allergies among pet owners
-
-
Who are the major players in the Pet Food Market in France?
-
Key Companies Agronutris, Archer Daniels Midland Co., Colgate Palmolive Co., dsm-firmenich, Faunafeed, Gersycoop, Groupe Legris Industries, Interquell GmbH, Kerry Group Plc, Manghebati SAS, Nestle SA, Nestor, Orange Pet Nutrition Pvt. Ltd., Pets Choice Ltd., Roquette Freres SA, sarl MINOTERIE FARGES, SAS VERNON Pierre, Tiernahrung Deuerer GmbH, United Petfood Producers NV, and Valorex
-
Market Research Insights
- The market exhibits a dynamic landscape, shaped by evolving consumer preferences and regulatory requirements. Approximately 75% of pet food sales in France are attributed to meat-based diets, reflecting the country's cultural affinity for animal protein. In contrast, plant-based and novel protein sources, such as insect and algae protein, account for a growing share, driven by the increasing demand for sustainable and ethical food options. Consumer focus on pet health and wellbeing has led to a heightened emphasis on nutritional requirements, digestive health, and food safety standards. As a result, pet food manufacturers invest in research and development, integrating functional ingredients like probiotics and prebiotics, and implementing rigorous quality assurance processes.
- Moreover, ingredient traceability and sustainable sourcing practices have become essential, with 60% of consumers expressing a preference for locally sourced ingredients. These trends underscore the market's continuous evolution, with innovation in pet food technology, manufacturing efficiency, and packaging materials playing a crucial role in meeting the diverse needs of pet owners.
We can help! Our analysts can customize this france pet food market research report to meet your requirements.