Fraud Detection And Prevention Market Analysis, Size, and Forecast 2026-2030: North America (US, Canada, and Mexico), Europe (Germany, UK, and France), APAC (China, Japan, and India), South America (Brazil and Argentina), Middle East and Africa (Saudi Arabia, UAE, and South Africa), and Rest of World (ROW)

Fraud Detection And Prevention Market Analysis, Size, and Forecast 2026-2030:
North America (US, Canada, and Mexico), Europe (Germany, UK, and France), APAC (China, Japan, and India), South America (Brazil and Argentina), Middle East and Africa (Saudi Arabia, UAE, and South Africa), and Rest of World (ROW)

Published: Apr 2026 295 Pages SKU: IRTNTR75527

Market Overview at a Glance

$190.60 B
Market Opportunity
34.7%
CAGR 2025 - 2030
39.9%
North America Growth
$30.27 B
Solutions segment 2024

Fraud Detection And Prevention Market Size 2026-2030

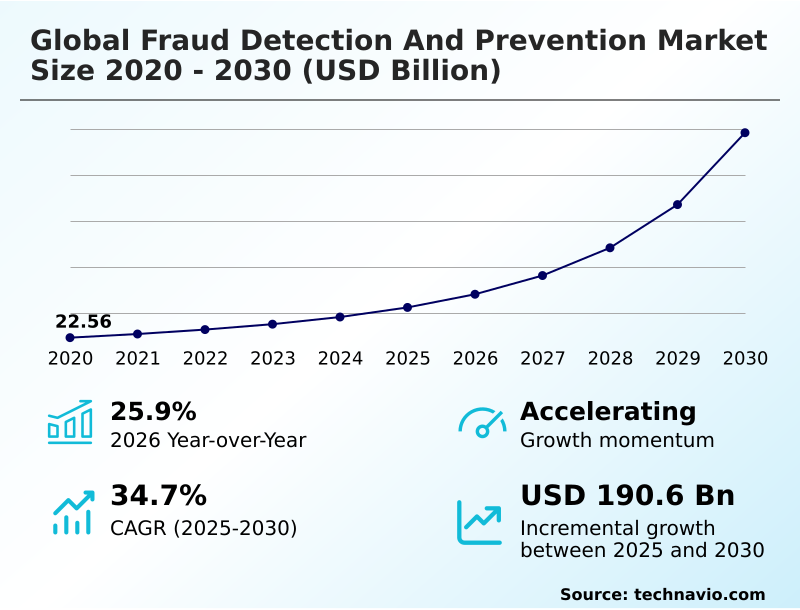
The fraud detection and prevention market size is valued to increase by USD 190.60 billion, at a CAGR of 34.7% from 2025 to 2030. Increase in adoption of cloud-based services will drive the fraud detection and prevention market.

Major Market Trends & Insights

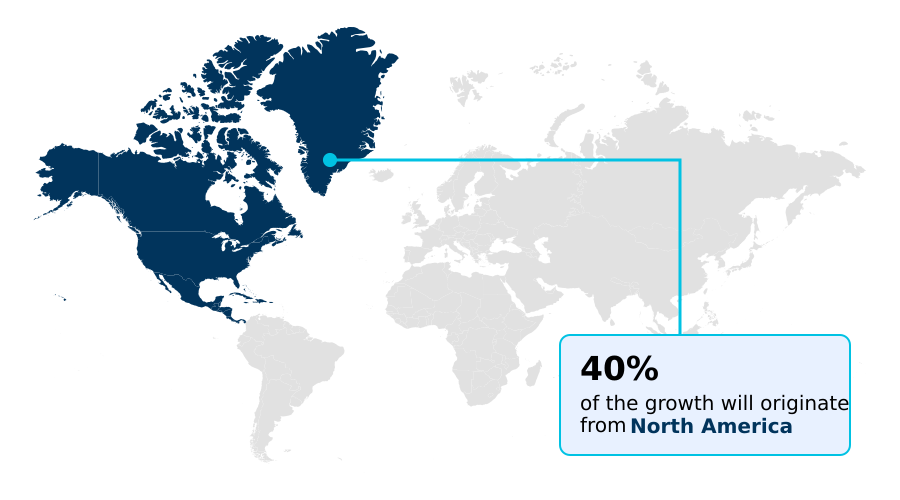
  • North America dominated the market and accounted for a 39.9% growth during the forecast period.
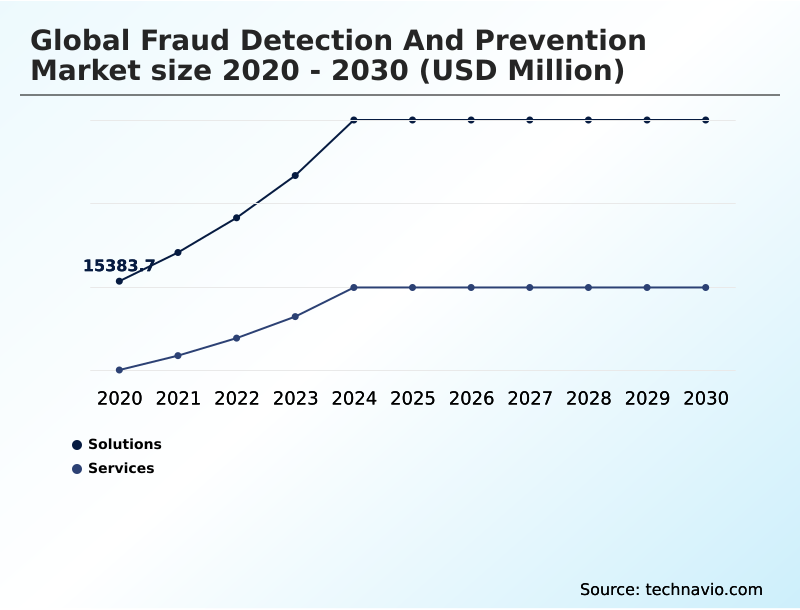
  • By Component - Solutions segment was valued at USD 30.27 billion in 2024
  • By End-user - Large enterprise segment accounted for the largest market revenue share in 2024

Market Size & Forecast

  • Market Opportunities: USD 223.56 billion
  • Market Future Opportunities: USD 190.60 billion
  • CAGR from 2025 to 2030 : 34.7%

Market Summary

  • The fraud detection and prevention market is rapidly evolving as organizations combat increasingly sophisticated threats in the digital economy. Growth is fueled by the surge in online transactions and the adoption of cloud-based services, which expand the attack surface for fraudulent activities.
  • A dominant trend is the shift from reactive, rule-based systems to proactive defense mechanisms leveraging artificial intelligence and machine learning. These advanced solutions utilize behavioral biometrics, anomaly detection, and predictive analytics to identify and neutralize threats in real time.
  • For instance, a financial institution can deploy AI-driven transaction monitoring to analyze millions of data points instantly, flagging suspicious patterns indicative of money laundering or account takeovers before significant losses occur. However, the market faces challenges from complex legacy IT infrastructure, which can create data silos and hinder the implementation of modern, integrated security protocols.
  • The high cost of deployment and the threat from open-source alternatives also temper market expansion. As cybercriminals continuously refine their tactics, the demand for innovative, adaptive, and scalable fraud prevention technologies remains a critical business imperative across all industries.

What will be the Size of the Fraud Detection And Prevention Market during the forecast period?

Get Key Insights on Market Forecast (PDF) Request Free Sample

How is the Fraud Detection And Prevention Market Segmented?

The fraud detection and prevention industry research report provides comprehensive data (region-wise segment analysis), with forecasts and estimates in "USD million" for the period 2026-2030, as well as historical data from 2020-2024 for the following segments.

  • Component
    • Solutions
    • Services
  • End-user
    • Large enterprise
    • SMEs
  • Application
    • Transaction monitoring
    • Compliance and risk management
    • Identity verification
    • Behavioral analytics
    • Others
  • Geography
    • North America
      • US
      • Canada
      • Mexico
    • Europe
      • Germany
      • UK
      • France
    • APAC
      • China
      • Japan
      • India
    • South America
      • Brazil
      • Argentina
    • Middle East and Africa
      • Saudi Arabia
      • UAE
      • South Africa
    • Rest of World (ROW)

By Component Insights

The solutions segment is estimated to witness significant growth during the forecast period.

The solutions segment is defined by platforms using deep learning models and risk scoring algorithms for proactive security. These systems incorporate predictive analytics and behavioral biometrics, moving beyond static rule-based engines.

A key aspect is cloud-based fraud management, enabling real-time threat detection and anomaly detection across vast datasets. These fraud prevention platforms deliver digital payment security that can reduce false positives by over 15%, enhancing user experience without compromising safety.

Utilizing machine learning algorithms and advanced authentication technologies, these solutions are critical for modern financial crime solutions and account takeover prevention in an increasingly digital economy.

Request Free Sample

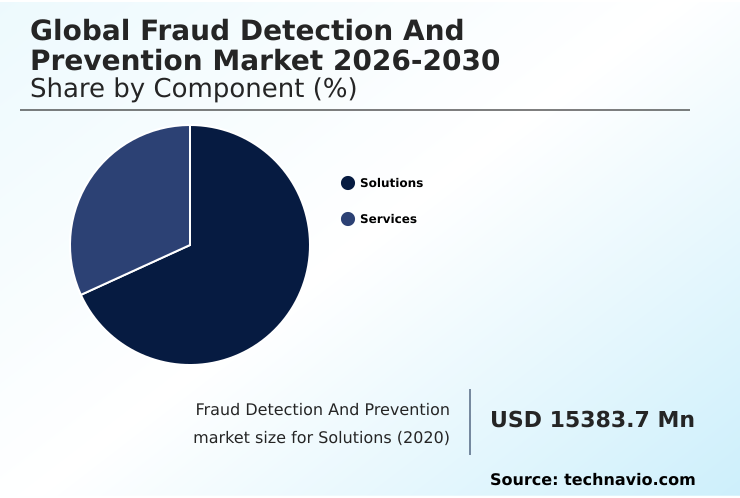
The Solutions segment was valued at USD 30.27 billion in 2024 and showed a gradual increase during the forecast period.

Request Free Sample

Regional Analysis

North America is estimated to contribute 39.9% to the growth of the global market during the forecast period.Technavio’s analysts have elaborately explained the regional trends and drivers that shape the market during the forecast period.

See How Fraud Detection And Prevention Market Demand is Rising in North America Request Free Sample

The geographic landscape reveals North America as the most technologically advanced market, with a growth rate of 35.3%, driven by stringent regulations and high investment in ai-powered fraud detection.

Europe follows closely with a 34.9% growth rate, focusing on compliance management software to adhere to strict data privacy laws.

Meanwhile, the APAC region, with a growth rate of 33.8%, is rapidly adopting mobile fraud prevention and payment gateway security to support its booming e-commerce sector.

This regional divergence underscores the varying priorities, from open banking security in mature markets to securing digital onboarding verification in emerging economies.

The use of ip intelligence and customer due diligence practices is becoming a global standard across these diverse regions.

Market Dynamics

Our researchers analyzed the data with 2025 as the base year, along with the key drivers, trends, and challenges. A holistic analysis of drivers will help companies refine their marketing strategies to gain a competitive advantage.

  • A comprehensive strategy for fraud mitigation begins with robust identity verification for digital onboarding, using advanced analytics for insurance fraud claims to vet new applicants. As customers interact with services, implementing a zero trust security model becomes essential. This is supported by real-time transaction monitoring for aml and the use of multi-factor authentication in mobile banking to secure every interaction.
  • Behind the scenes, ai models for detecting account takeover work continuously, bolstered by deep learning for financial crime patterns. Organizations are increasingly using device fingerprinting to stop bots and leveraging ip intelligence for blocking malicious traffic. The core of this defense is machine learning for payment fraud detection, which uses sophisticated risk scoring models for credit applications.
  • This approach significantly reduces false positives in fraud alerts, with some systems improving accuracy by over 40% compared to legacy rules. When an incident does occur, kyc and customer due diligence automation, alongside threat intelligence integration for cybersecurity, ensure a swift and compliant response.
  • This entire framework helps in preventing synthetic identity fraud in banking and managing chargeback fraud, creating a resilient security posture.

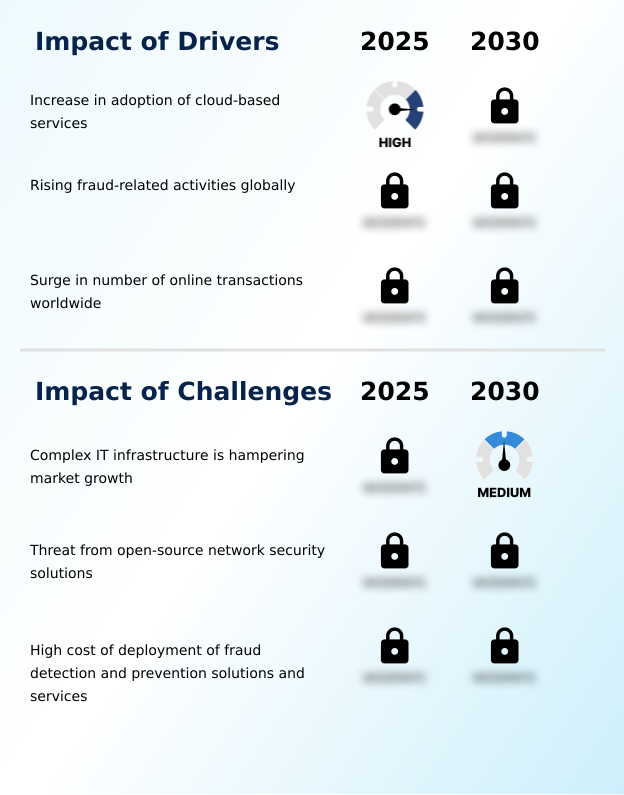
What are the key market drivers leading to the rise in the adoption of Fraud Detection And Prevention Industry?

  • The increasing adoption of cloud-based services is a key driver for the market, providing organizations with scalable and powerful analytics capabilities.

  • The increasing adoption of cloud-based services is a primary market driver, democratizing access to high-level security tools.
  • This shift enables organizations to deploy sophisticated machine learning algorithms and real-time fraud detection without the high capital expenditure of on-premise data centers, lowering the barrier to entry for robust security by up to 50%.
  • Cloud platforms facilitate the real-time analysis of vast datasets, essential for identifying emerging fraudulent patterns. This agility is vital, as evidenced by firms reporting a 70% faster deployment of security updates.
  • The integration of digital identity intelligence and account protection services within cloud environments provides a scalable and cost-effective method for organizations to meet evolving security demands.

What are the market trends shaping the Fraud Detection And Prevention Industry?

  • Technological advancements in fraud detection and prevention solutions are a dominant trend, driving the industry toward more autonomous and proactive defense mechanisms.

  • Technological advancement is reshaping the market with a strong emphasis on autonomous defense. The integration of artificial intelligence and deep learning is moving the industry from rigid, rules-based engines toward adaptive models that recognize subtle behavioral anomalies.
  • Key innovations include behavioral biometrics, which analyze user interaction patterns, improving security against account takeovers with a 40% higher accuracy rate than traditional methods. Firms leveraging these ai-driven risk analytics report a 25% reduction in false positives, enhancing customer experience.
  • The adoption of security information and event management (siem) systems coupled with cloud security services enables nearly instantaneous transaction verification, a critical capability in high-volume e-commerce environments.

What challenges does the Fraud Detection And Prevention Industry face during its growth?

  • The complexity of existing IT infrastructure presents a significant challenge, hampering the growth and integration of advanced fraud prevention systems.

  • Complex IT infrastructure is a significant challenge, hampering the integration of modern security protocols with legacy systems. Fragmented environments create data silos, making it difficult to deploy comprehensive monitoring tools like biometric security systems and fraud investigation tools, which can lead to a 30% increase in undetected cross-channel fraud.
  • This complexity often results in a high volume of false positives from endpoint security solutions, overwhelming analysts and increasing operational costs by 20%. The technical expertise required to overhaul these systems is often prohibitive, causing many firms to delay essential security upgrades, thereby slowing the adoption of advanced risk management solutions and cybersecurity services.

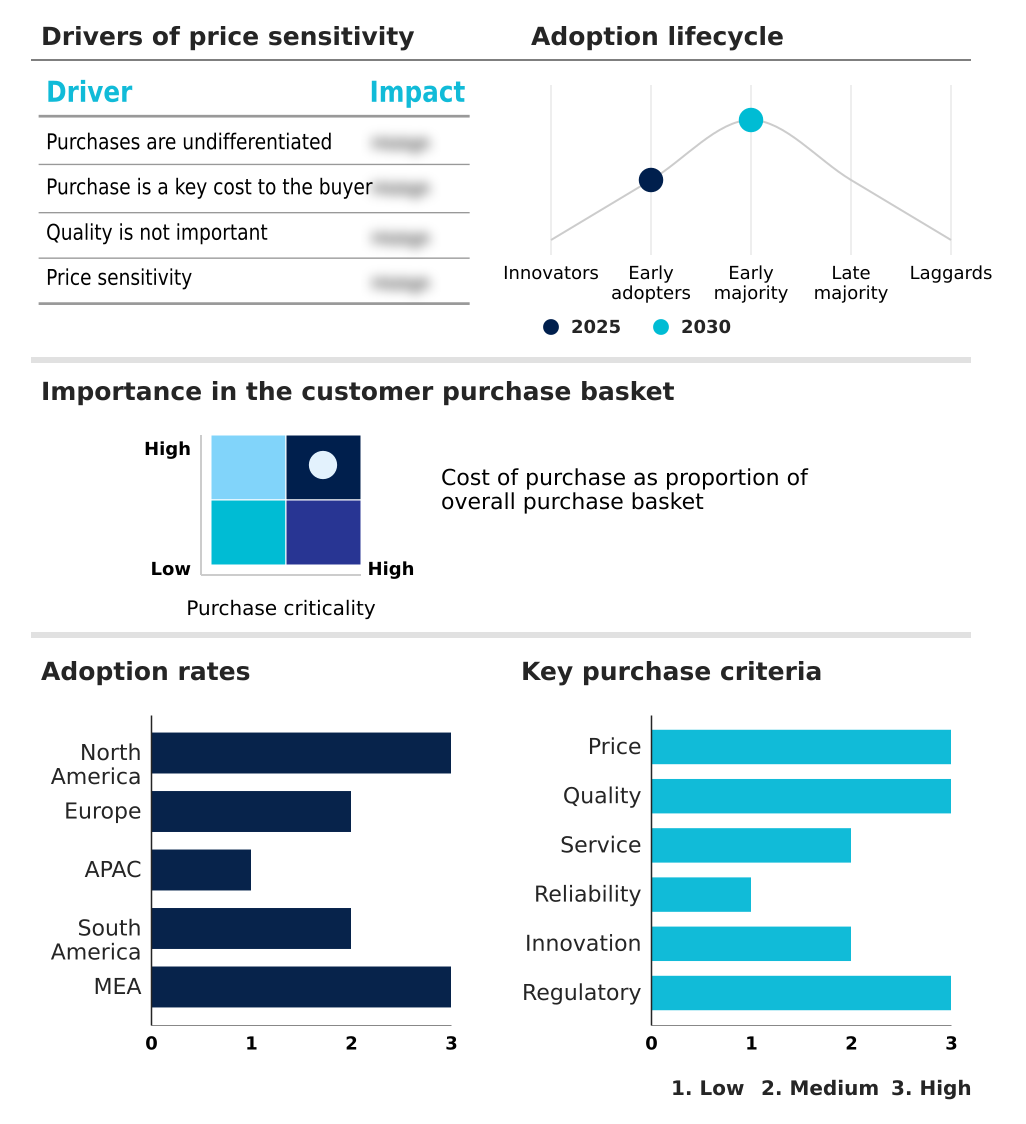
Exclusive Technavio Analysis on Customer Landscape

The fraud detection and prevention market forecasting report includes the adoption lifecycle of the market, covering from the innovator’s stage to the laggard’s stage. It focuses on adoption rates in different regions based on penetration. Furthermore, the fraud detection and prevention market report also includes key purchase criteria and drivers of price sensitivity to help companies evaluate and develop their market growth analysis strategies.

Customer Landscape of Fraud Detection And Prevention Industry

Competitive Landscape

Companies are implementing various strategies, such as strategic alliances, fraud detection and prevention market forecast, partnerships, mergers and acquisitions, geographical expansion, and product/service launches, to enhance their presence in the industry.

ACI Worldwide Inc. - Analytical solutions provide real-time fraud management, leveraging AI for enhanced risk scoring and identity verification across digital transactions.

The industry research and growth report includes detailed analyses of the competitive landscape of the market and information about key companies, including:

  • ACI Worldwide Inc.
  • Amazon Web Services Inc.
  • DataVisor Inc.
  • Equifax Inc.
  • Experian Plc
  • Fair Isaac Corp.
  • Feedzai
  • Fidelity National Information
  • Fiserv Inc.
  • IBM Corp.
  • LexisNexis Legal and Professional
  • Microsoft Corp.
  • NICE Ltd.
  • OneSpan Inc.
  • Quantexa Ltd.
  • SAP SE
  • SAS Institute Inc.
  • Signifyd Inc.
  • Software AG
  • TransUnion

Qualitative and quantitative analysis of companies has been conducted to help clients understand the wider business environment as well as the strengths and weaknesses of key industry players. Data is qualitatively analyzed to categorize companies as pure play, category-focused, industry-focused, and diversified; it is quantitatively analyzed to categorize companies as dominant, leading, strong, tentative, and weak.

Recent Development and News in Fraud detection and prevention market

  • In September 2024, a leading financial technology company launched a new suite of AI-powered tools focused on preventing synthetic identity fraud, a growing concern for digital lenders.
  • In January 2025, PayPal announced a major upgrade to its proprietary risk management solutions, utilizing a new generation of generative artificial intelligence to predict fraudulent patterns before transactions are even initiated.
  • In February 2025, Mastercard unveiled an advanced security framework specifically designed for large enterprise clients, combining quantum-resistant encryption with real-time threat intelligence to secure global supply chain payments.
  • In March 2025, Visa reported a significant reduction in false positives across its network following the implementation of a new transaction monitoring engine that uses neural networks to better distinguish between legitimate cross-border travel and fraudulent activity.

Dive into Technavio’s robust research methodology, blending expert interviews, extensive data synthesis, and validated models for unparalleled Fraud Detection And Prevention Market insights. See full methodology.

Market Scope
Page number 295
Base year 2025
Historic period 2020-2024
Forecast period 2026-2030
Growth momentum & CAGR Accelerate at a CAGR of 34.7%
Market growth 2026-2030 USD 190599.6 million
Market structure Fragmented
YoY growth 2025-2026(%) 25.9%
Key countries US, Canada, Mexico, Germany, UK, France, Italy, Spain, The Netherlands, China, Japan, India, South Korea, Australia, Indonesia, Brazil, Argentina, Chile, Saudi Arabia, UAE, South Africa, Israel and Turkey
Competitive landscape Leading Companies, Market Positioning of Companies, Competitive Strategies, and Industry Risks

Request Free Sample

Research Analyst Overview

  • The market's evolution is driven by the sophisticated interplay of ai-powered fraud detection, behavioral biometrics, and deep learning models. Boardroom decisions increasingly focus on investing in a holistic security posture that includes robust transaction monitoring and stringent anti-money laundering (aml) protocols, which can reduce compliance-related fines by up to 30%.
  • Core technologies such as machine learning algorithms and predictive analytics are fundamental for real-time fraud detection and effective anomaly detection. The integration of risk scoring algorithms, identity verification, and multi-factor authentication is critical for account takeover prevention and securing digital identity intelligence.
  • As enterprises migrate to the cloud, cloud-based fraud management, fortified by device fingerprinting, ip intelligence, and threat intelligence feeds, becomes paramount. Addressing challenges like synthetic identity fraud and chargeback fraud prevention requires advanced tools like graph analytics and a focus on financial crime compliance.
  • The entire ecosystem, from e-commerce fraud prevention to open banking security, relies on seamless data orchestration, feature engineering, and customer authentication methods to stay ahead of threats.

What are the Key Data Covered in this Fraud Detection And Prevention Market Research and Growth Report?

  • What is the expected growth of the Fraud Detection And Prevention Market between 2026 and 2030?

    • USD 190.60 billion, at a CAGR of 34.7%

  • What segmentation does the market report cover?

    • The report is segmented by Component (Solutions, and Services), End-user (Large enterprise, and SMEs), Application (Transaction monitoring, Compliance and risk management, Identity verification, Behavioral analytics, and Others) and Geography (North America, Europe, APAC, South America, Middle East and Africa)

  • Which regions are analyzed in the report?

    • North America, Europe, APAC, South America and Middle East and Africa

  • What are the key growth drivers and market challenges?

    • Increase in adoption of cloud-based services, Complex IT infrastructure is hampering market growth

  • Who are the major players in the Fraud Detection And Prevention Market?

    • ACI Worldwide Inc., Amazon Web Services Inc., DataVisor Inc., Equifax Inc., Experian Plc, Fair Isaac Corp., Feedzai, Fidelity National Information, Fiserv Inc., IBM Corp., LexisNexis Legal and Professional, Microsoft Corp., NICE Ltd., OneSpan Inc., Quantexa Ltd., SAP SE, SAS Institute Inc., Signifyd Inc., Software AG and TransUnion

Market Research Insights

  • Market dynamics are shaped by the need for robust risk management solutions and advanced identity verification services to combat sophisticated digital threats. The adoption of real-time threat detection capabilities is now standard, with firms reporting up to a 60% faster response time compared to manual investigation methods.
  • Furthermore, integrated fraud prevention platforms that combine network security monitoring with automated fraud alerts can reduce false positives by over 25%, significantly improving operational efficiency. Enterprises leveraging these e-commerce security solutions find that strengthening transaction security systems not only mitigates losses but also enhances customer trust, with some seeing a 10% improvement in customer retention in high-risk sectors.

We can help! Our analysts can customize this fraud detection and prevention market research report to meet your requirements.

Get in touch

1. Executive Summary

1.1 Market overview

Executive Summary - Chart on Market Overview
Executive Summary - Data Table on Market Overview
Executive Summary - Chart on Global Market Characteristics
Executive Summary - Chart on Market by Geography
Executive Summary - Chart on Market Segmentation by Component
Executive Summary - Chart on Market Segmentation by End-user
Executive Summary - Chart on Market Segmentation by Application
Executive Summary - Chart on Incremental Growth
Executive Summary - Data Table on Incremental Growth
Executive Summary - Chart on Company Market Positioning

2. Technavio Analysis

2.1 Analysis of price sensitivity, lifecycle, customer purchase basket, adoption rates, and purchase criteria

2.2 Criticality of inputs and Factors of differentiation

Chart on Overview on criticality of inputs and factors of differentiation

2.3 Factors of disruption

Chart on Overview on factors of disruption

2.4 Impact of drivers and challenges

Chart on Impact of drivers and challenges in 2025 and 2030

3. Market Landscape

3.1 Market ecosystem

Chart on Parent Market
Data Table on - Parent Market

3.2 Market characteristics

Chart on Market characteristics analysis

3.3 Value chain analysis

Chart on Value chain analysis

4. Market Sizing

4.1 Market definition

Data Table on Offerings of companies included in the market definition

4.2 Market segment analysis

Market segments

4.3 Market size 2025

4.4 Market outlook: Forecast for 2025-2030

Chart on Global - Market size and forecast 2025-2030 ($ million)
Data Table on Global - Market size and forecast 2025-2030 ($ million)
Chart on Global Market: Year-over-year growth 2025-2030 (%)
Data Table on Global Market: Year-over-year growth 2025-2030 (%)

5. Historic Market Size

5.1 Global Fraud Detection And Prevention Market 2020 - 2024

Historic Market Size - Data Table on Global Fraud Detection And Prevention Market 2020 - 2024 ($ million)

5.2 Component segment analysis 2020 - 2024

Historic Market Size - Component Segment 2020 - 2024 ($ million)

5.3 End-user segment analysis 2020 - 2024

Historic Market Size - End-user Segment 2020 - 2024 ($ million)

5.4 Application segment analysis 2020 - 2024

Historic Market Size - Application Segment 2020 - 2024 ($ million)

5.5 Geography segment analysis 2020 - 2024

Historic Market Size - Geography Segment 2020 - 2024 ($ million)

5.6 Country segment analysis 2020 - 2024

Historic Market Size - Country Segment 2020 - 2024 ($ million)

6. Qualitative Analysis

6.1 Impact of AI on Global Fraud Detection and Prevention Market

6.2 Impact of Geopolitical Conflicts on Global Fraud Detection and Prevention Market

7. Five Forces Analysis

7.1 Five forces summary

Five forces analysis - Comparison between 2025 and 2030

7.2 Bargaining power of buyers

Bargaining power of buyers - Impact of key factors 2025 and 2030

7.3 Bargaining power of suppliers

Bargaining power of suppliers - Impact of key factors in 2025 and 2030

7.4 Threat of new entrants

Threat of new entrants - Impact of key factors in 2025 and 2030

7.5 Threat of substitutes

Threat of substitutes - Impact of key factors in 2025 and 2030

7.6 Threat of rivalry

Threat of rivalry - Impact of key factors in 2025 and 2030

7.7 Market condition

Chart on Market condition - Five forces 2025 and 2030

8. Market Segmentation by Component

8.1 Market segments

Chart on Component - Market share 2025-2030 (%)
Data Table on Component - Market share 2025-2030 (%)

8.2 Comparison by Component

Chart on Comparison by Component
Data Table on Comparison by Component

8.3 Solutions - Market size and forecast 2025-2030

Chart on Solutions - Market size and forecast 2025-2030 ($ million)
Data Table on Solutions - Market size and forecast 2025-2030 ($ million)
Chart on Solutions - Year-over-year growth 2025-2030 (%)
Data Table on Solutions - Year-over-year growth 2025-2030 (%)

8.4 Services - Market size and forecast 2025-2030

Chart on Services - Market size and forecast 2025-2030 ($ million)
Data Table on Services - Market size and forecast 2025-2030 ($ million)
Chart on Services - Year-over-year growth 2025-2030 (%)
Data Table on Services - Year-over-year growth 2025-2030 (%)

8.5 Market opportunity by Component

Market opportunity by Component ($ million)
Data Table on Market opportunity by Component ($ million)

9. Market Segmentation by End-user

9.1 Market segments

Chart on End-user - Market share 2025-2030 (%)
Data Table on End-user - Market share 2025-2030 (%)

9.2 Comparison by End-user

Chart on Comparison by End-user
Data Table on Comparison by End-user

9.3 Large enterprise - Market size and forecast 2025-2030

Chart on Large enterprise - Market size and forecast 2025-2030 ($ million)
Data Table on Large enterprise - Market size and forecast 2025-2030 ($ million)
Chart on Large enterprise - Year-over-year growth 2025-2030 (%)
Data Table on Large enterprise - Year-over-year growth 2025-2030 (%)

9.4 SMEs - Market size and forecast 2025-2030

Chart on SMEs - Market size and forecast 2025-2030 ($ million)
Data Table on SMEs - Market size and forecast 2025-2030 ($ million)
Chart on SMEs - Year-over-year growth 2025-2030 (%)
Data Table on SMEs - Year-over-year growth 2025-2030 (%)

9.5 Market opportunity by End-user

Market opportunity by End-user ($ million)
Data Table on Market opportunity by End-user ($ million)

10. Market Segmentation by Application

10.1 Market segments

Chart on Application - Market share 2025-2030 (%)
Data Table on Application - Market share 2025-2030 (%)

10.2 Comparison by Application

Chart on Comparison by Application
Data Table on Comparison by Application

10.3 Transaction monitoring - Market size and forecast 2025-2030

Chart on Transaction monitoring - Market size and forecast 2025-2030 ($ million)
Data Table on Transaction monitoring - Market size and forecast 2025-2030 ($ million)
Chart on Transaction monitoring - Year-over-year growth 2025-2030 (%)
Data Table on Transaction monitoring - Year-over-year growth 2025-2030 (%)

10.4 Compliance and risk management - Market size and forecast 2025-2030

Chart on Compliance and risk management - Market size and forecast 2025-2030 ($ million)
Data Table on Compliance and risk management - Market size and forecast 2025-2030 ($ million)
Chart on Compliance and risk management - Year-over-year growth 2025-2030 (%)
Data Table on Compliance and risk management - Year-over-year growth 2025-2030 (%)

10.5 Identity verification - Market size and forecast 2025-2030

Chart on Identity verification - Market size and forecast 2025-2030 ($ million)
Data Table on Identity verification - Market size and forecast 2025-2030 ($ million)
Chart on Identity verification - Year-over-year growth 2025-2030 (%)
Data Table on Identity verification - Year-over-year growth 2025-2030 (%)

10.6 Behavioral analytics - Market size and forecast 2025-2030

Chart on Behavioral analytics - Market size and forecast 2025-2030 ($ million)
Data Table on Behavioral analytics - Market size and forecast 2025-2030 ($ million)
Chart on Behavioral analytics - Year-over-year growth 2025-2030 (%)
Data Table on Behavioral analytics - Year-over-year growth 2025-2030 (%)

10.7 Others - Market size and forecast 2025-2030

Chart on Others - Market size and forecast 2025-2030 ($ million)
Data Table on Others - Market size and forecast 2025-2030 ($ million)
Chart on Others - Year-over-year growth 2025-2030 (%)
Data Table on Others - Year-over-year growth 2025-2030 (%)

10.8 Market opportunity by Application

Market opportunity by Application ($ million)
Data Table on Market opportunity by Application ($ million)

11. Customer Landscape

11.1 Customer landscape overview

Analysis of price sensitivity, lifecycle, customer purchase basket, adoption rates, and purchase criteria

12. Geographic Landscape

12.1 Geographic segmentation

Chart on Market share by geography 2025-2030 (%)
Data Table on Market share by geography 2025-2030 (%)

12.2 Geographic comparison

Chart on Geographic comparison
Data Table on Geographic comparison

12.3 North America - Market size and forecast 2025-2030

Chart on North America - Market size and forecast 2025-2030 ($ million)
Data Table on North America - Market size and forecast 2025-2030 ($ million)
Chart on North America - Year-over-year growth 2025-2030 (%)
Data Table on North America - Year-over-year growth 2025-2030 (%)
Chart on Regional Comparison - North America
Data Table on Regional Comparison - North America

12.3.1 US - Market size and forecast 2025-2030

Chart on US - Market size and forecast 2025-2030 ($ million)
Data Table on US - Market size and forecast 2025-2030 ($ million)
Chart on US - Year-over-year growth 2025-2030 (%)
Data Table on US - Year-over-year growth 2025-2030 (%)

12.3.2 Canada - Market size and forecast 2025-2030

Chart on Canada - Market size and forecast 2025-2030 ($ million)
Data Table on Canada - Market size and forecast 2025-2030 ($ million)
Chart on Canada - Year-over-year growth 2025-2030 (%)
Data Table on Canada - Year-over-year growth 2025-2030 (%)

12.3.3 Mexico - Market size and forecast 2025-2030

Chart on Mexico - Market size and forecast 2025-2030 ($ million)
Data Table on Mexico - Market size and forecast 2025-2030 ($ million)
Chart on Mexico - Year-over-year growth 2025-2030 (%)
Data Table on Mexico - Year-over-year growth 2025-2030 (%)

12.4 Europe - Market size and forecast 2025-2030

Chart on Europe - Market size and forecast 2025-2030 ($ million)
Data Table on Europe - Market size and forecast 2025-2030 ($ million)
Chart on Europe - Year-over-year growth 2025-2030 (%)
Data Table on Europe - Year-over-year growth 2025-2030 (%)
Chart on Regional Comparison - Europe
Data Table on Regional Comparison - Europe

12.4.1 Germany - Market size and forecast 2025-2030

Chart on Germany - Market size and forecast 2025-2030 ($ million)
Data Table on Germany - Market size and forecast 2025-2030 ($ million)
Chart on Germany - Year-over-year growth 2025-2030 (%)
Data Table on Germany - Year-over-year growth 2025-2030 (%)

12.4.2 UK - Market size and forecast 2025-2030

Chart on UK - Market size and forecast 2025-2030 ($ million)
Data Table on UK - Market size and forecast 2025-2030 ($ million)
Chart on UK - Year-over-year growth 2025-2030 (%)
Data Table on UK - Year-over-year growth 2025-2030 (%)

12.4.3 France - Market size and forecast 2025-2030

Chart on France - Market size and forecast 2025-2030 ($ million)
Data Table on France - Market size and forecast 2025-2030 ($ million)
Chart on France - Year-over-year growth 2025-2030 (%)
Data Table on France - Year-over-year growth 2025-2030 (%)

12.4.4 Italy - Market size and forecast 2025-2030

Chart on Italy - Market size and forecast 2025-2030 ($ million)
Data Table on Italy - Market size and forecast 2025-2030 ($ million)
Chart on Italy - Year-over-year growth 2025-2030 (%)
Data Table on Italy - Year-over-year growth 2025-2030 (%)

12.4.5 Spain - Market size and forecast 2025-2030

Chart on Spain - Market size and forecast 2025-2030 ($ million)
Data Table on Spain - Market size and forecast 2025-2030 ($ million)
Chart on Spain - Year-over-year growth 2025-2030 (%)
Data Table on Spain - Year-over-year growth 2025-2030 (%)

12.4.6 The Netherlands - Market size and forecast 2025-2030

Chart on The Netherlands - Market size and forecast 2025-2030 ($ million)
Data Table on The Netherlands - Market size and forecast 2025-2030 ($ million)
Chart on The Netherlands - Year-over-year growth 2025-2030 (%)
Data Table on The Netherlands - Year-over-year growth 2025-2030 (%)

12.5 APAC - Market size and forecast 2025-2030

Chart on APAC - Market size and forecast 2025-2030 ($ million)
Data Table on APAC - Market size and forecast 2025-2030 ($ million)
Chart on APAC - Year-over-year growth 2025-2030 (%)
Data Table on APAC - Year-over-year growth 2025-2030 (%)
Chart on Regional Comparison - APAC
Data Table on Regional Comparison - APAC

12.5.1 China - Market size and forecast 2025-2030

Chart on China - Market size and forecast 2025-2030 ($ million)
Data Table on China - Market size and forecast 2025-2030 ($ million)
Chart on China - Year-over-year growth 2025-2030 (%)
Data Table on China - Year-over-year growth 2025-2030 (%)

12.5.2 Japan - Market size and forecast 2025-2030

Chart on Japan - Market size and forecast 2025-2030 ($ million)
Data Table on Japan - Market size and forecast 2025-2030 ($ million)
Chart on Japan - Year-over-year growth 2025-2030 (%)
Data Table on Japan - Year-over-year growth 2025-2030 (%)

12.5.3 India - Market size and forecast 2025-2030

Chart on India - Market size and forecast 2025-2030 ($ million)
Data Table on India - Market size and forecast 2025-2030 ($ million)
Chart on India - Year-over-year growth 2025-2030 (%)
Data Table on India - Year-over-year growth 2025-2030 (%)

12.5.4 South Korea - Market size and forecast 2025-2030

Chart on South Korea - Market size and forecast 2025-2030 ($ million)
Data Table on South Korea - Market size and forecast 2025-2030 ($ million)
Chart on South Korea - Year-over-year growth 2025-2030 (%)
Data Table on South Korea - Year-over-year growth 2025-2030 (%)

12.5.5 Australia - Market size and forecast 2025-2030

Chart on Australia - Market size and forecast 2025-2030 ($ million)
Data Table on Australia - Market size and forecast 2025-2030 ($ million)
Chart on Australia - Year-over-year growth 2025-2030 (%)
Data Table on Australia - Year-over-year growth 2025-2030 (%)

12.5.6 Indonesia - Market size and forecast 2025-2030

Chart on Indonesia - Market size and forecast 2025-2030 ($ million)
Data Table on Indonesia - Market size and forecast 2025-2030 ($ million)
Chart on Indonesia - Year-over-year growth 2025-2030 (%)
Data Table on Indonesia - Year-over-year growth 2025-2030 (%)

12.6 South America - Market size and forecast 2025-2030

Chart on South America - Market size and forecast 2025-2030 ($ million)
Data Table on South America - Market size and forecast 2025-2030 ($ million)
Chart on South America - Year-over-year growth 2025-2030 (%)
Data Table on South America - Year-over-year growth 2025-2030 (%)
Chart on Regional Comparison - South America
Data Table on Regional Comparison - South America

12.6.1 Brazil - Market size and forecast 2025-2030

Chart on Brazil - Market size and forecast 2025-2030 ($ million)
Data Table on Brazil - Market size and forecast 2025-2030 ($ million)
Chart on Brazil - Year-over-year growth 2025-2030 (%)
Data Table on Brazil - Year-over-year growth 2025-2030 (%)

12.6.2 Argentina - Market size and forecast 2025-2030

Chart on Argentina - Market size and forecast 2025-2030 ($ million)
Data Table on Argentina - Market size and forecast 2025-2030 ($ million)
Chart on Argentina - Year-over-year growth 2025-2030 (%)
Data Table on Argentina - Year-over-year growth 2025-2030 (%)

12.6.3 Chile - Market size and forecast 2025-2030

Chart on Chile - Market size and forecast 2025-2030 ($ million)
Data Table on Chile - Market size and forecast 2025-2030 ($ million)
Chart on Chile - Year-over-year growth 2025-2030 (%)
Data Table on Chile - Year-over-year growth 2025-2030 (%)

12.7 Middle East and Africa - Market size and forecast 2025-2030

Chart on Middle East and Africa - Market size and forecast 2025-2030 ($ million)
Data Table on Middle East and Africa - Market size and forecast 2025-2030 ($ million)
Chart on Middle East and Africa - Year-over-year growth 2025-2030 (%)
Data Table on Middle East and Africa - Year-over-year growth 2025-2030 (%)
Chart on Regional Comparison - Middle East and Africa
Data Table on Regional Comparison - Middle East and Africa

12.7.1 Saudi Arabia - Market size and forecast 2025-2030

Chart on Saudi Arabia - Market size and forecast 2025-2030 ($ million)
Data Table on Saudi Arabia - Market size and forecast 2025-2030 ($ million)
Chart on Saudi Arabia - Year-over-year growth 2025-2030 (%)
Data Table on Saudi Arabia - Year-over-year growth 2025-2030 (%)

12.7.2 UAE - Market size and forecast 2025-2030

Chart on UAE - Market size and forecast 2025-2030 ($ million)
Data Table on UAE - Market size and forecast 2025-2030 ($ million)
Chart on UAE - Year-over-year growth 2025-2030 (%)
Data Table on UAE - Year-over-year growth 2025-2030 (%)

12.7.3 South Africa - Market size and forecast 2025-2030

Chart on South Africa - Market size and forecast 2025-2030 ($ million)
Data Table on South Africa - Market size and forecast 2025-2030 ($ million)
Chart on South Africa - Year-over-year growth 2025-2030 (%)
Data Table on South Africa - Year-over-year growth 2025-2030 (%)

12.7.4 Israel - Market size and forecast 2025-2030

Chart on Israel - Market size and forecast 2025-2030 ($ million)
Data Table on Israel - Market size and forecast 2025-2030 ($ million)
Chart on Israel - Year-over-year growth 2025-2030 (%)
Data Table on Israel - Year-over-year growth 2025-2030 (%)

12.7.5 Turkey - Market size and forecast 2025-2030

Chart on Turkey - Market size and forecast 2025-2030 ($ million)
Data Table on Turkey - Market size and forecast 2025-2030 ($ million)
Chart on Turkey - Year-over-year growth 2025-2030 (%)
Data Table on Turkey - Year-over-year growth 2025-2030 (%)

12.8 Market opportunity by geography

Market opportunity by geography ($ million)
Data Tables on Market opportunity by geography ($ million)

13. Drivers, Challenges, and Opportunity

13.1 Market drivers

Increase in adoption of cloud-based services
Rising fraud-related activities globally
Surge in number of online transactions worldwide

13.2 Market challenges

Complex IT infrastructure is hampering market growth
Threat from open-source network security solutions
High cost of deployment of fraud detection and prevention solutions and services

13.3 Impact of drivers and challenges

Impact of drivers and challenges in 2025 and 2030

13.4 Market opportunities

Technological advancement in fraud detection and prevention solutions and services
Adoption of IoT in fraud detection and prevention
Rise in cyber-attacks across all verticals is increasing market demand

14. Competitive Landscape

14.1 Overview

14.2

Overview on criticality of inputs and factors of differentiation

14.3 Landscape disruption

Overview on factors of disruption

14.4 Industry risks

Impact of key risks on business

15. Competitive Analysis

15.1 Companies profiled

Companies covered

15.2 Company ranking index

15.3 Market positioning of companies

Matrix on companies position and classification

15.4 ACI Worldwide Inc.

ACI Worldwide Inc. - Overview
ACI Worldwide Inc. - Business segments
ACI Worldwide Inc. - Key offerings
ACI Worldwide Inc. - Segment focus
SWOT

15.5 Amazon Web Services Inc.

Amazon Web Services Inc. - Overview
Amazon Web Services Inc. - Product / Service
Amazon Web Services Inc. - Key offerings
SWOT

15.6 Equifax Inc.

Equifax Inc. - Overview
Equifax Inc. - Business segments
Equifax Inc. - Key offerings
Equifax Inc. - Segment focus
SWOT

15.7 Experian Plc

Experian Plc - Overview
Experian Plc - Business segments
Experian Plc - Key offerings
Experian Plc - Segment focus
SWOT

15.8 Fair Isaac Corp.

Fair Isaac Corp. - Overview
Fair Isaac Corp. - Business segments
Fair Isaac Corp. - Key news
Fair Isaac Corp. - Key offerings
Fair Isaac Corp. - Segment focus
SWOT

15.9 Fidelity National Information

Fidelity National Information - Overview
Fidelity National Information - Business segments
Fidelity National Information - Key offerings
Fidelity National Information - Segment focus
SWOT

15.10 Fiserv Inc.

Fiserv Inc. - Overview
Fiserv Inc. - Business segments
Fiserv Inc. - Key news
Fiserv Inc. - Key offerings
Fiserv Inc. - Segment focus
SWOT

15.11 IBM Corp.

IBM Corp. - Overview
IBM Corp. - Business segments
IBM Corp. - Key news
IBM Corp. - Key offerings
IBM Corp. - Segment focus
SWOT

15.12 LexisNexis Legal and Professional

LexisNexis Legal and Professional - Overview
LexisNexis Legal and Professional - Product / Service
LexisNexis Legal and Professional - Key offerings
SWOT

15.13 Microsoft Corp.

Microsoft Corp. - Overview
Microsoft Corp. - Business segments
Microsoft Corp. - Key news
Microsoft Corp. - Key offerings
Microsoft Corp. - Segment focus
SWOT

15.14 NICE Ltd.

NICE Ltd. - Overview
NICE Ltd. - Business segments
NICE Ltd. - Key offerings
NICE Ltd. - Segment focus
SWOT

15.15 SAP SE

SAP SE - Overview
SAP SE - Business segments
SAP SE - Key news
SAP SE - Key offerings
SAP SE - Segment focus
SWOT

15.16 SAS Institute Inc.

SAS Institute Inc. - Overview
SAS Institute Inc. - Product / Service
SAS Institute Inc. - Key offerings
SWOT

15.17 Software AG

Software AG - Overview
Software AG - Product / Service
Software AG - Key offerings
SWOT

15.18 TransUnion

TransUnion - Overview
TransUnion - Business segments
TransUnion - Key news
TransUnion - Key offerings
TransUnion - Segment focus
SWOT

16. Appendix

16.1 Scope of the report

Market definition
Objectives
Notes and caveats

16.2 Inclusions and exclusions checklist

Inclusions checklist
Exclusions checklist

16.3 Currency conversion rates for US$

16.4 Research methodology

16.5 Data procurement

Information sources

16.6 Data validation

16.7 Validation techniques employed for market sizing

16.8 Data synthesis

16.9 360 degree market analysis

16.10 List of abbreviations

Research Methodology

Technavio presents a detailed picture of the market by way of study, synthesis, and summation of data from multiple sources. The analysts have presented the various facets of the market with a particular focus on identifying the key industry influencers. The data thus presented is comprehensive, reliable, and the result of extensive research, both primary and secondary.

INFORMATION SOURCES

Primary sources

  • Manufacturers and suppliers
  • Channel partners
  • Industry experts
  • Strategic decision makers

Secondary sources

  • Industry journals and periodicals
  • Government data
  • Financial reports of key industry players
  • Historical data
  • Press releases

DATA ANALYSIS

Data Synthesis

  • Collation of data
  • Estimation of key figures
  • Analysis of derived insights

Data Validation

  • Triangulation with data models
  • Reference against proprietary databases
  • Corroboration with industry experts

REPORT WRITING

Qualitative

  • Market drivers
  • Market challenges
  • Market trends
  • Five forces analysis

Quantitative

  • Market size and forecast
  • Market segmentation
  • Geographical insights
  • Competitive landscape

Interested in this report?

Get your sample now to see our research methodology and insights!

Download Now

Frequently Asked Questions

Fraud Detection And Prevention market growth will increase by USD 190599.6 million during 2026-2030.

The Fraud Detection And Prevention market is expected to grow at a CAGR of 34.7% during 2026-2030.

Fraud Detection And Prevention market is segmented by Component (Solutions, Services) End-user (Large enterprise, SMEs) Application (Transaction monitoring, Compliance and risk management, Identity verification, Behavioral analytics, Others)

ACI Worldwide Inc., Amazon Web Services Inc., DataVisor Inc., Equifax Inc., Experian Plc, Fair Isaac Corp., Feedzai, Fidelity National Information, Fiserv Inc., IBM Corp., LexisNexis Legal and Professional, Microsoft Corp., NICE Ltd., OneSpan Inc., Quantexa Ltd., SAP SE, SAS Institute Inc., Signifyd Inc., Software AG, TransUnion are a few of the key vendors in the Fraud Detection And Prevention market.

North America will register the highest growth rate of 39.9% among the other regions. Therefore, the Fraud Detection And Prevention market in North America is expected to garner significant business opportunities for the vendors during the forecast period.

US, Canada, Mexico, Germany, UK, France, Italy, Spain, The Netherlands, China, Japan, India, South Korea, Australia, Indonesia, Brazil, Argentina, Chile, Saudi Arabia, UAE, South Africa, Israel, Turkey

  • Increase in adoption of cloud-based services is the driving factor this market.

The Fraud Detection And Prevention market vendors should focus on grabbing business opportunities from the Component segment as it accounted for the largest market share in the base year.
RIA - Research AI Assistant
Ask RIA