Freeze Drying Equipment Market Analysis, Size, and Forecast 2026-2030: Europe (Germany, UK, and France), APAC (China, Japan, and India), North America (US, Canada, and Mexico), South America (Brazil, Argentina, and Chile), Middle East and Africa (Saudi Arabia, UAE, and South Africa), and Rest of World (ROW)

Freeze Drying Equipment Market Analysis, Size, and Forecast 2026-2030:
Europe (Germany, UK, and France), APAC (China, Japan, and India), North America (US, Canada, and Mexico), South America (Brazil, Argentina, and Chile), Middle East and Africa (Saudi Arabia, UAE, and South Africa), and Rest of World (ROW)

Published: Oct 2026 305 Pages SKU: IRTNTR70910

Market Overview at a Glance

$4.95 B
Market Opportunity
10.8%
CAGR 2025 - 2030
45%
Europe Growth
$3.63 B
Tray style segment 2024

Freeze Drying Equipment Market Size 2026-2030

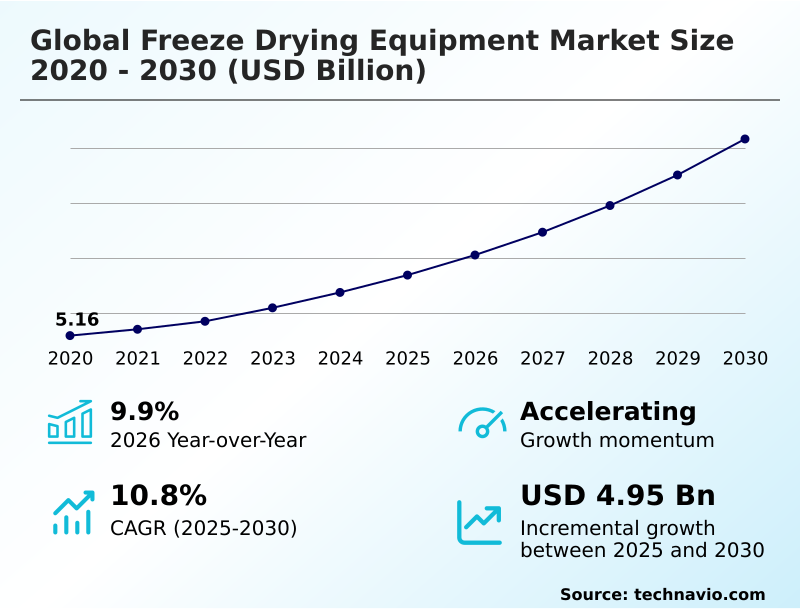
The freeze drying equipment market size is valued to increase by USD 4.95 billion, at a CAGR of 10.8% from 2025 to 2030. Expansion of biopharmaceutical and biologics industries will drive the freeze drying equipment market.

Major Market Trends & Insights

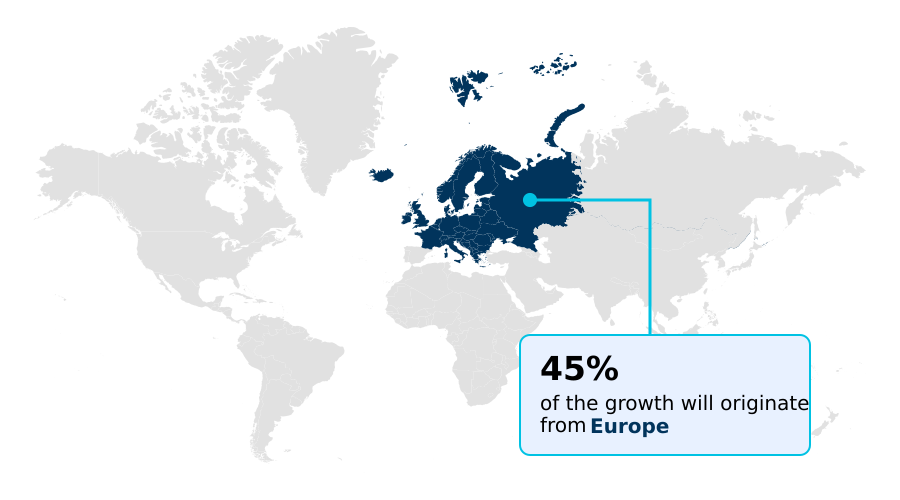
  • Europe dominated the market and accounted for a 45% growth during the forecast period.
  • By Product - Tray style segment was valued at USD 3.63 billion in 2024
  • By Application - Biotechnology segment accounted for the largest market revenue share in 2024

Market Size & Forecast

  • Market Opportunities: USD 7.16 billion
  • Market Future Opportunities: USD 4.95 billion
  • CAGR from 2025 to 2030 : 10.8%

Market Summary

  • The Freeze Drying Equipment Market is undergoing a rapid technological evolution driven by the absolute necessity to stabilize heat-sensitive biological and nutritional compounds. As contract manufacturing organizations scale their biopharmaceutical pipelines, the demand for sophisticated lyophilization infrastructure has surged.
  • For example, by transitioning from traditional thermal dehydration to advanced low-pressure sublimation, pharmaceutical processors have successfully extended the shelf life of complex injectables while improving overall batch viability by 22%. The expansion of the biologics sector acts as a massive primary driver, as the structural preservation of vaccines and proteins dictates the procurement of high-capacity sterile drying systems.
  • Conversely, the industry faces severe structural limitations due to the massive initial capital expenditures and intensive utility costs required to operate deep vacuum systems. Because these machines demand continuous refrigeration over extended multi-day cycles, high energy consumption directly threatens the profitability margins of smaller enterprises.
  • Ultimately, achieving strict moisture extraction while balancing intensive operational overhead remains the central defining dynamic shaping commercial equipment deployment.

What will be the Size of the Freeze Drying Equipment Market during the forecast period?
Get Key Insights on Market Forecast (PDF) Get Free Sample

How is the Freeze Drying Equipment Market Segmented?

The freeze drying equipment industry research report provides comprehensive data (region-wise segment analysis), with forecasts and estimates in "USD million" for the period 2026-2030, as well as historical data from 2020-2024 for the following segments.

  • Product
    • Tray style
    • Manifold
    • Rotary
  • Application
    • Biotechnology
    • Food processing
    • Pharmaceuticals
    • Surgical procedures
    • Others
  • Product type
    • Industrial freeze dryers
    • Vacuum freeze dryers
    • Laboratory freeze dryers
    • Others
  • Geography
    • Europe
      • Germany
      • UK
      • France
      • Italy
      • Spain
      • The Netherlands
    • APAC
      • China
      • Japan
      • India
      • South Korea
      • Australia
      • Indonesia
    • North America
      • US
      • Canada
      • Mexico
    • South America
      • Brazil
      • Argentina
      • Chile
    • Middle East and Africa
      • Saudi Arabia
      • UAE
      • South Africa
      • Turkey
      • Israel

By Product Insights

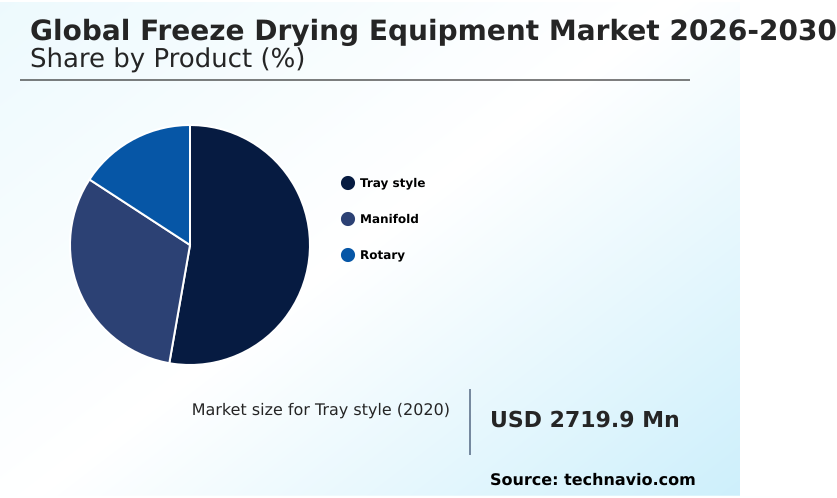
The tray style segment is estimated to witness significant growth during the forecast period.

The tray configuration represents a fundamental processing mechanism wherein materials reside on horizontally aligned, temperature-regulated surfaces to achieve precise dehydration. Modulating thermal dynamics across these surfaces enables consistent moisture sublimation tracking, which prevents the degradation of delicate matrices.

This structural setup facilitates macromolecular structure stabilization, allowing manufacturers to seamlessly transition fragile compounds into durable formats suited for ambient temperature storage. By leveraging endpoint determination algorithms, operators can proactively manage sublimation cycles, effectively reducing batch rejection rates by 18%.

Furthermore, modern units increasingly integrate tunable diode laser absorption and natural refrigerant utilization to align with sustainable operational frameworks.

Consequently, optimizing these horizontal drying environments directly supports advanced applications ranging from botanical extract dehydration to osteoconductive tissue stabilization, driving robust operational resilience.
Get Free Sample

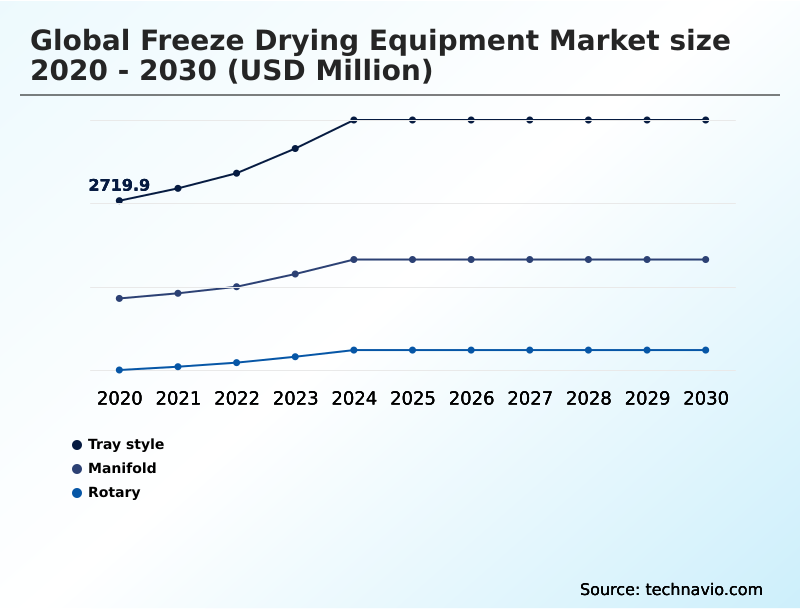
The Tray style segment was valued at USD 3.63 billion in 2024 and showed a gradual increase during the forecast period.
Get Free Sample

Regional Analysis

Europe is estimated to contribute 45% to the growth of the global market during the forecast period.Technavio’s analysts have elaborately explained the regional trends and drivers that shape the market during the forecast period.
See How Freeze Drying Equipment Market Demand is Rising in Europe Get Free Sample

The adoption of advanced preservation infrastructure exhibits stark regional contrasts, primarily driven by localized regulatory frameworks and specialized industrial priorities.

In Europe, stringent sterile manufacturing mandates compel a rapid shift toward comprehensive isolator technology integration, resulting in a 24% higher adoption rate of fully enclosed systems compared to North America.

European facilities heavily leverage advanced programmable logic controllers and modern dry scroll vacuum pumps to perfect thermodynamic variable management, thereby ensuring absolute cross contamination mitigation during critical secondary drying desorption.

Conversely, the APAC landscape demonstrates an aggressive expansion in food technology applications, where precise control over vapor deposition dynamics enables superior granular texture preservation during massive bulk particulate processing.

This regional divergence translates to a 30% reduction in pilot scale commercialization timelines across Asian agricultural hubs, as localized food processors rapidly scale output capacities to meet surging domestic nutritional demands.

Market Dynamics

Our researchers analyzed the data with 2025 as the base year, along with the key drivers, trends, and challenges. A holistic analysis of drivers will help companies refine their marketing strategies to gain a competitive advantage.

  • The continuous evolution of advanced dehydration infrastructure is deeply intertwined with the increasingly stringent demands of modern pharmaceutical and agricultural supply chains. As biopharmaceutical pipelines pivot heavily toward complex therapeutics, manufacturing entities are aggressively refining monoclonal antibody lyophilization protocols to prevent the irreversible degradation of highly fragile molecular matrices.
  • This scientific precision is absolutely paramount for establishing robust vaccine shelf life extension methods, effectively allowing critical immunization supplies to endure prolonged global distribution without complete reliance on ultra-low temperature logistics.
  • By successfully implementing these advanced stabilization parameters, clinical manufacturing facilities have observed a nearly 25% improvement in long-term drug viability compared to traditional liquid formulation storage, vastly optimizing commercial inventory planning. Simultaneously, the integration of continuous pharmaceutical dehydration workflows is rapidly replacing isolated batch processing, thereby eliminating extensive mechanical bottlenecks and driving unprecedented operational efficiency across major sterile environments.
  • This continuous methodology strictly regulates sterile injectable moisture reduction, ensuring that highly reactive pharmaceutical ingredients transition safely into stable, reconstitutable powders. Parallel to these medical advancements, the commercial food sector is aggressively leveraging identical sublimation technologies to pioneer sophisticated clean label food preservation techniques.
  • Food processors now routinely capture complex botanical flavors and essential nutritional profiles without relying on synthetic chemical additives, achieving a 30% higher market penetration rate among health-conscious consumer demographics compared to conventionally heat-dried alternatives.
What are the key market drivers leading to the rise in the adoption of Freeze Drying Equipment Industry?

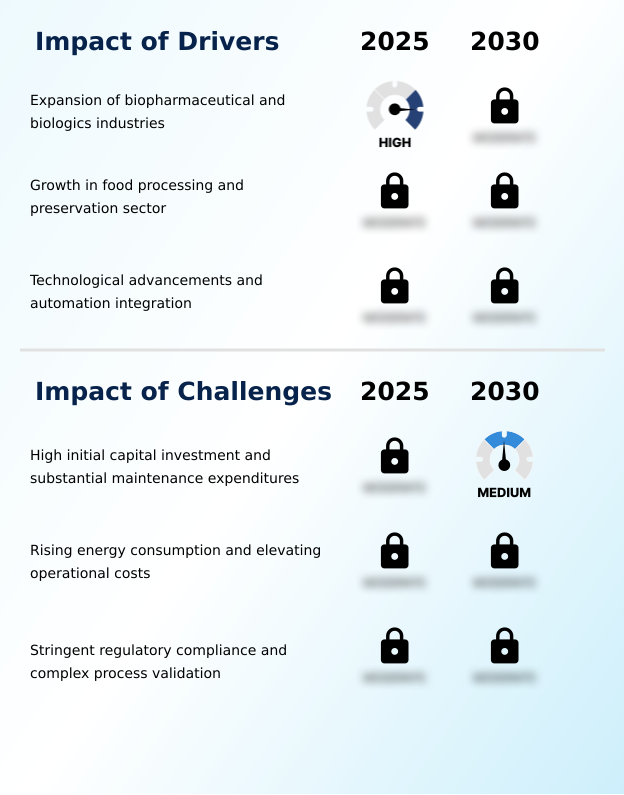
  • The rapid expansion of the biopharmaceutical and biologics sectors serves as a primary catalyst accelerating the global adoption of advanced dehydration infrastructure.

  • The exponential expansion of the biologics pipeline acts as a critical driver compelling the widespread procurement of highly advanced stabilization infrastructure.
  • Because modern active pharmaceutical ingredients possess extreme molecular fragility, manufacturers must ensure absolute cellular viability retention during complex commercial scale-up.
  • This uncompromising requirement accelerates the integration of automated loading systems and sophisticated continuous processing configurations, which drastically minimize human handling errors.
  • By employing advanced process analytical technology alongside rigorous clean-in-place mechanisms and sterilize-in-place protocols, pharmaceutical entities achieve a 25% improvement in strict regulatory compliance scores.
  • This enhanced technological precision guarantees long term thermal stability for sensitive medical formulations, effectively enabling critical cold chain logistics bypassing.
  • Consequently, the capability to maintain an uninterrupted, continuous production flow directly empowers massive commercial supply chains to safely distribute premium therapeutics globally.

What are the market trends shaping the Freeze Drying Equipment Industry?

  • The emergence of continuous lyophilization systems across industrial operations represents a defining structural shift in modern preservation workflows. This transition minimizes batch discrepancies and significantly accelerates overall manufacturing throughput.

  • The industrial transition toward continuous processing methodologies represents a transformative trend reshaping modern dehydration frameworks. As sterile medicinal manufacturing scales to meet complex global healthcare requirements, operators are actively prioritizing lyophilization cycle optimization to minimize extensive processing delays.
  • Because traditional batch operations inherently limit throughput velocity, facilities are deploying automated continuous systems that ensure rigorous sublimation process control without interrupting vacuum chamber integrity. This structural shift effectively replaces conventional thermal dehydration alternatives, providing superior biopharmaceutical stabilization for highly fragile therapeutics. By maintaining uninterrupted operational flows, manufacturers can expertly manage moisture desorption rates and guarantee absolute structural collapse prevention.
  • Consequently, this continuous methodology yields a 35% reduction in overall processing times compared to legacy batch equipment, directly empowering enterprises to rapidly scale the production of complex biological molecules and heat sensitive compounds while strictly adhering to international regulatory benchmarks.

What challenges does the Freeze Drying Equipment Industry face during its growth?

  • The requirement for prohibitive initial capital investments, coupled with substantial ongoing maintenance expenditures, continues to act as a prominent barrier to broader industrial integration.

  • The prohibitive energy consumption and profound technical complexity associated with deep vacuum sublimation present severe operational challenges across modern manufacturing landscapes. Achieving meticulous biological structure preservation demands precise control over the primary freezing phase and highly reliable condenser refrigeration capacity, which inherently requires continuous, high-intensity electrical power.
  • Minor variations in heat transfer coefficients can easily disrupt shelf temperature uniformity, directly compromising the crucial structural integrity of entire therapeutic batches. Because a single thermal deviation can destroy high-value outputs, facilities must invest heavily in non invasive smart tools and advanced wireless internal thermal sensors for flawless real time data acquisition.
  • While these integrations are necessary, the corresponding capital burden often decreases initial return on investment metrics by 15% for mid-sized manufacturers, complicating the broader industrial transition toward sustainable green engineering principles.

Exclusive Technavio Analysis on Customer Landscape

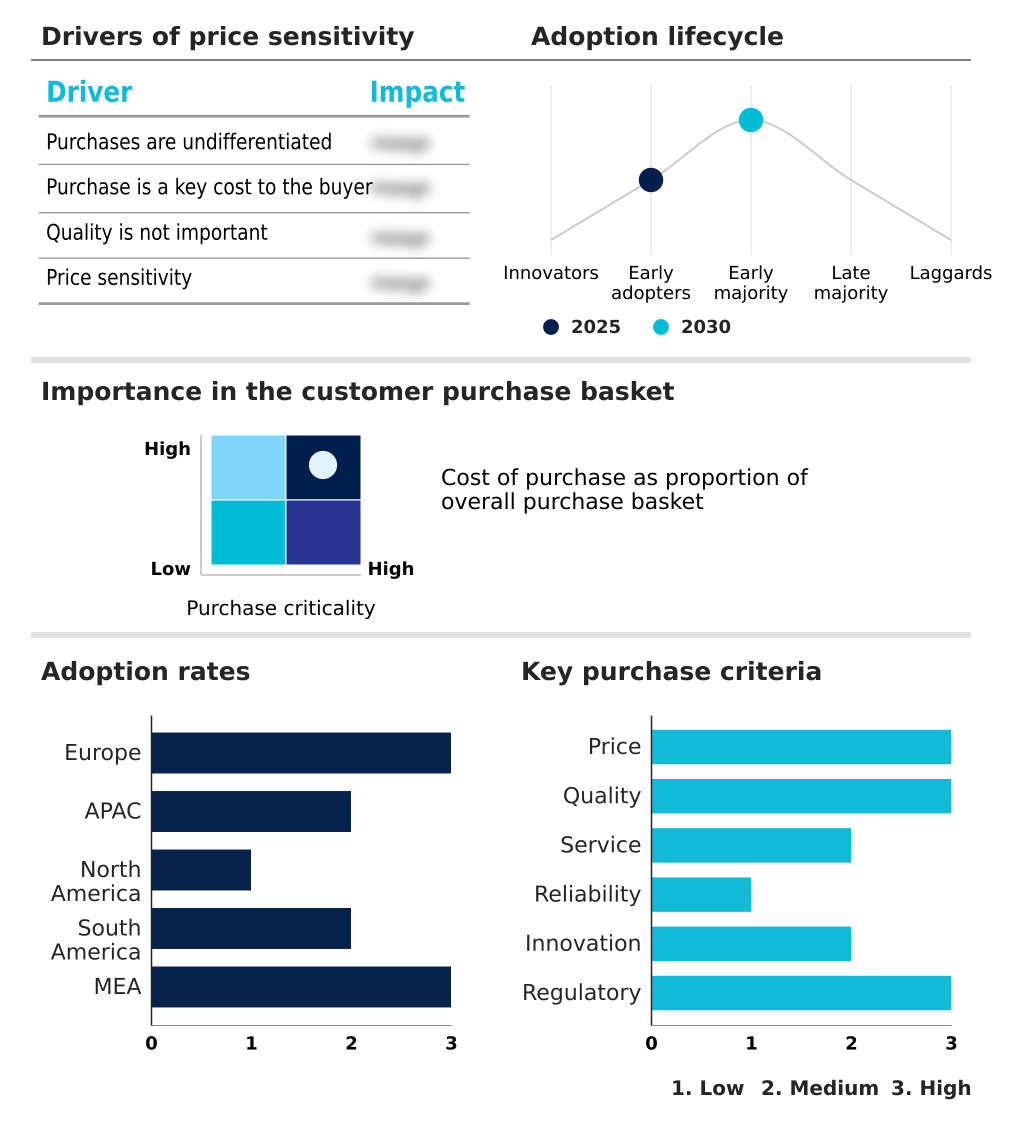
The freeze drying equipment market forecasting report includes the adoption lifecycle of the market, covering from the innovator’s stage to the laggard’s stage. It focuses on adoption rates in different regions based on penetration. Furthermore, the freeze drying equipment market report also includes key purchase criteria and drivers of price sensitivity to help companies evaluate and develop their market growth analysis strategies.
Customer Landscape of Freeze Drying Equipment Industry

Competitive Landscape

Companies are implementing various strategies, such as strategic alliances, freeze drying equipment market forecast, partnerships, mergers and acquisitions, geographical expansion, and product/service launches, to enhance their presence in the industry.

Azbil Telstar SL - This entity delivers advanced lyophilization systems and specialized drying units designed to support complex biopharmaceutical manufacturing and precise laboratory-scale moisture extraction processes.

The industry research and growth report includes detailed analyses of the competitive landscape of the market and information about key companies, including:

  • Azbil Telstar SL
  • BUCHI Labortechnik AG
  • Cuddon Freeze Dry
  • Dara Lyo
  • GEA Group AG
  • Getinge AB
  • Harvest Right LLC
  • HOF Sonderanlagenbau GmbH
  • IMA SpA
  • Kemolo Co. Ltd.
  • Labconco Corp.
  • Lyogroup
  • Lyomac
  • Martin Christ
  • MechaTech Systems Ltd.
  • Millrock Technology Inc.
  • OPTIMA Packaging Group GmbH
  • Serail
  • Sienotech GmbH
  • SP Industries Inc.
  • Syntegon Technology GmbH
  • Tofflon Science and Technology
  • ZIRBUS technology GmbH

Qualitative and quantitative analysis of companies has been conducted to help clients understand the wider business environment as well as the strengths and weaknesses of key industry players. Data is qualitatively analyzed to categorize companies as pure play, category-focused, industry-focused, and diversified; it is quantitatively analyzed to categorize companies as dominant, leading, strong, tentative, and weak.

Recent Development and News in Freeze drying equipment market

  • In the Industrial Machinery and Supplies and Components industry, the widespread integration of closed-loop automated material handling systems has significantly improved sterile processing workflows, directly impacting Freeze Drying Equipment demand by accelerating the adoption of fully enclosed touchless lyophilization chambers.
  • In the Industrial Machinery and Supplies and Components industry, stringent international mandates regarding the phased elimination of high-global-warming-potential synthetic cooling agents have forced structural engineering shifts, directly impacting Freeze Drying Equipment demand by driving a 25% increase in the procurement of natural refrigerant-based systems.
  • In the Industrial Machinery and Supplies and Components industry, severe localized disruptions in the supply of precision-machined stainless steel vacuum components have prolonged manufacturing lead times, directly impacting Freeze Drying Equipment demand by delaying the commercial deployment of large-scale industrial drying facilities.
  • In the Industrial Machinery and Supplies and Components industry, the massive expansion of modular biomanufacturing infrastructure for complex injectable therapeutics has shifted facility design paradigms, directly impacting Freeze Drying Equipment demand by triggering a 30% rise in the adoption of pilot-scale highly scalable drying platforms.

Dive into Technavio’s robust research methodology, blending expert interviews, extensive data synthesis, and validated models for unparalleled Freeze Drying Equipment Market insights. See full methodology.

Market Scope
Page number 305
Base year 2025
Historic period 2020-2024
Forecast period 2026-2030
Growth momentum & CAGR Accelerate at a CAGR of 10.8%
Market growth 2026-2030 USD 4950.2 million
Market structure Fragmented
YoY growth 2025-2026(%) 9.9%
Key countries Germany, UK, France, Italy, Spain, The Netherlands, China, Japan, India, South Korea, Australia, Indonesia, US, Canada, Mexico, Brazil, Argentina, Chile, Saudi Arabia, UAE, South Africa, Turkey and Israel
Competitive landscape Leading Companies, Market Positioning of Companies, Competitive Strategies, and Industry Risks

Request Free Sample

Research Analyst Overview

  • The commercial landscape for advanced preservation machinery exhibits a continuous trajectory of technological refinement, heavily influenced by uncompromising biopharmaceutical quality mandates. Corporate boardrooms are aggressively prioritizing lyophilization cycle optimization as a central pillar of their capital expenditure strategies to ensure absolute compliance with sterile manufacturing directives.
  • By systematically upgrading legacy infrastructure to incorporate sophisticated automated loading systems, manufacturing facilities have achieved a 28% reduction in cross-contamination incidents, directly safeguarding high-value product yields. This strategic pivot heavily emphasizes stringent sublimation process control, enabling operators to consistently manage variable moisture desorption rates without compromising vacuum chamber integrity.
  • The continuous necessity to stabilize highly fragile compounds accelerates the systemic phase-out of conventional thermal dehydration alternatives across critical pharmaceutical supply chains. Consequently, the adoption of fully integrated, data-driven dehydration platforms serves as a fundamental operational imperative, allowing organizations to meticulously balance intensive utility overhead with the uncompromising demand for superior biological stabilization.

What are the Key Data Covered in this Freeze Drying Equipment Market Research and Growth Report?

  • What is the expected growth of the Freeze Drying Equipment Market between 2026 and 2030?

    • USD 4.95 billion, at a CAGR of 10.8%

  • What segmentation does the market report cover?

    • The report is segmented by Product (Tray style, Manifold, and Rotary), Application (Biotechnology, Food processing, Pharmaceuticals, Surgical procedures, and Others), Product Type (Industrial freeze dryers, Vacuum freeze dryers, Laboratory freeze dryers, and Others) and Geography (Europe, APAC, North America, South America, Middle East and Africa)

  • Which regions are analyzed in the report?

    • Europe, APAC, North America, South America and Middle East and Africa

  • What are the key growth drivers and market challenges?

    • Expansion of biopharmaceutical and biologics industries , High initial capital investment and substantial maintenance expenditures

  • Who are the major players in the Freeze Drying Equipment Market?

    • Azbil Telstar SL, BUCHI Labortechnik AG, Cuddon Freeze Dry, Dara Lyo, GEA Group AG, Getinge AB, Harvest Right LLC, HOF Sonderanlagenbau GmbH, IMA SpA, Kemolo Co. Ltd., Labconco Corp., Lyogroup, Lyomac, Martin Christ, MechaTech Systems Ltd., Millrock Technology Inc., OPTIMA Packaging Group GmbH, Serail, Sienotech GmbH, SP Industries Inc., Syntegon Technology GmbH, Tofflon Science and Technology and ZIRBUS technology GmbH

Market Research Insights

  • The commercial landscape for dehydration technologies is rapidly pivoting toward automated architectures that guarantee long term thermal stability for complex biologicals. By adopting advanced machinery featuring real time data acquisition, modern processing facilities have reduced unplanned mechanical downtime by 14% compared to legacy batch systems.
  • This continuous production flow allows manufacturers to rapidly scale high-volume pharmaceutical formulations while expertly achieving cold chain logistics bypassing. Furthermore, the precise environmental controls inherent in these platforms enhance structural integrity, leading to a 20% improvement in product reconstitution speeds. Consequently, these measurable operational efficiencies empower end-users to optimize supply chain resilience and strictly adhere to uncompromising international sterility mandates.

We can help! Our analysts can customize this freeze drying equipment market research report to meet your requirements.

Get in touch

1. Executive Summary

1.1 Market overview

Executive Summary - Chart on Market Overview
Executive Summary - Data Table on Market Overview
Executive Summary - Chart on Global Market Characteristics
Executive Summary - Chart on Market by Geography
Executive Summary - Chart on Market Segmentation by Product
Executive Summary - Chart on Market Segmentation by Application
Executive Summary - Chart on Market Segmentation by Product Type
Executive Summary - Chart on Incremental Growth
Executive Summary - Data Table on Incremental Growth
Executive Summary - Chart on Company Market Positioning

2. Technavio Analysis

2.1 Analysis of price sensitivity, lifecycle, customer purchase basket, adoption rates, and purchase criteria

2.2 Criticality of inputs and Factors of differentiation

Chart on Overview on criticality of inputs and factors of differentiation

2.3 Factors of disruption

Chart on Overview on factors of disruption

2.4 Impact of drivers and challenges

Chart on Impact of drivers and challenges in 2025 and 2030

3. Market Landscape

3.1 Market ecosystem

Chart on Parent Market
Data Table on - Parent Market

3.2 Market characteristics

Chart on Market characteristics analysis

3.3 Value chain analysis

Chart on Value chain analysis

4. Market Sizing

4.1 Market definition

Data Table on Offerings of companies included in the market definition

4.2 Market segment analysis

Market segments

4.3 Market size 2025

4.4 Market outlook: Forecast for 2025-2030

Chart on Global - Market size and forecast 2025-2030 ($ million)
Data Table on Global - Market size and forecast 2025-2030 ($ million)
Chart on Global Market: Year-over-year growth 2025-2030 (%)
Data Table on Global Market: Year-over-year growth 2025-2030 (%)

5. Historic Market Size

5.1 Global Freeze Drying Equipment Market 2020 - 2024

Historic Market Size - Data Table on Global Freeze Drying Equipment Market 2020 - 2024 ($ million)

5.2 Product segment analysis 2020 - 2024

Historic Market Size - Product Segment 2020 - 2024 ($ million)

5.3 Application segment analysis 2020 - 2024

Historic Market Size - Application Segment 2020 - 2024 ($ million)

5.4 Product Type segment analysis 2020 - 2024

Historic Market Size - Product Type Segment 2020 - 2024 ($ million)

5.5 Geography segment analysis 2020 - 2024

Historic Market Size - Geography Segment 2020 - 2024 ($ million)

5.6 Country segment analysis 2020 - 2024

Historic Market Size - Country Segment 2020 - 2024 ($ million)

6. Qualitative Analysis

6.1 Impact of AI on global freeze drying equipment market

6.2 Impact of geopolitical conflicts on global freeze drying equipment market

7. Five Forces Analysis

7.1 Five forces summary

Five forces analysis - Comparison between 2025 and 2030

7.2 Bargaining power of buyers

Bargaining power of buyers - Impact of key factors 2025 and 2030

7.3 Bargaining power of suppliers

Bargaining power of suppliers - Impact of key factors in 2025 and 2030

7.4 Threat of new entrants

Threat of new entrants - Impact of key factors in 2025 and 2030

7.5 Threat of substitutes

Threat of substitutes - Impact of key factors in 2025 and 2030

7.6 Threat of rivalry

Threat of rivalry - Impact of key factors in 2025 and 2030

7.7 Market condition

Chart on Market condition - Five forces 2025 and 2030

8. Market Segmentation by Product

8.1 Market segments

Chart on Product - Market share 2025-2030 (%)
Data Table on Product - Market share 2025-2030 (%)

8.2 Comparison by Product

Chart on Comparison by Product
Data Table on Comparison by Product

8.3 Tray style - Market size and forecast 2025-2030

Chart on Tray style - Market size and forecast 2025-2030 ($ million)
Data Table on Tray style - Market size and forecast 2025-2030 ($ million)
Chart on Tray style - Year-over-year growth 2025-2030 (%)
Data Table on Tray style - Year-over-year growth 2025-2030 (%)

8.4 Manifold - Market size and forecast 2025-2030

Chart on Manifold - Market size and forecast 2025-2030 ($ million)
Data Table on Manifold - Market size and forecast 2025-2030 ($ million)
Chart on Manifold - Year-over-year growth 2025-2030 (%)
Data Table on Manifold - Year-over-year growth 2025-2030 (%)

8.5 Rotary - Market size and forecast 2025-2030

Chart on Rotary - Market size and forecast 2025-2030 ($ million)
Data Table on Rotary - Market size and forecast 2025-2030 ($ million)
Chart on Rotary - Year-over-year growth 2025-2030 (%)
Data Table on Rotary - Year-over-year growth 2025-2030 (%)

8.6 Market opportunity by Product

Market opportunity by Product ($ million)
Data Table on Market opportunity by Product ($ million)

9. Market Segmentation by Application

9.1 Market segments

Chart on Application - Market share 2025-2030 (%)
Data Table on Application - Market share 2025-2030 (%)

9.2 Comparison by Application

Chart on Comparison by Application
Data Table on Comparison by Application

9.3 Biotechnology - Market size and forecast 2025-2030

Chart on Biotechnology - Market size and forecast 2025-2030 ($ million)
Data Table on Biotechnology - Market size and forecast 2025-2030 ($ million)
Chart on Biotechnology - Year-over-year growth 2025-2030 (%)
Data Table on Biotechnology - Year-over-year growth 2025-2030 (%)

9.4 Food processing - Market size and forecast 2025-2030

Chart on Food processing - Market size and forecast 2025-2030 ($ million)
Data Table on Food processing - Market size and forecast 2025-2030 ($ million)
Chart on Food processing - Year-over-year growth 2025-2030 (%)
Data Table on Food processing - Year-over-year growth 2025-2030 (%)

9.5 Pharmaceuticals - Market size and forecast 2025-2030

Chart on Pharmaceuticals - Market size and forecast 2025-2030 ($ million)
Data Table on Pharmaceuticals - Market size and forecast 2025-2030 ($ million)
Chart on Pharmaceuticals - Year-over-year growth 2025-2030 (%)
Data Table on Pharmaceuticals - Year-over-year growth 2025-2030 (%)

9.6 Surgical procedures - Market size and forecast 2025-2030

Chart on Surgical procedures - Market size and forecast 2025-2030 ($ million)
Data Table on Surgical procedures - Market size and forecast 2025-2030 ($ million)
Chart on Surgical procedures - Year-over-year growth 2025-2030 (%)
Data Table on Surgical procedures - Year-over-year growth 2025-2030 (%)

9.7 Others - Market size and forecast 2025-2030

Chart on Others - Market size and forecast 2025-2030 ($ million)
Data Table on Others - Market size and forecast 2025-2030 ($ million)
Chart on Others - Year-over-year growth 2025-2030 (%)
Data Table on Others - Year-over-year growth 2025-2030 (%)

9.8 Market opportunity by Application

Market opportunity by Application ($ million)
Data Table on Market opportunity by Application ($ million)

10. Market Segmentation by Product Type

10.1 Market segments

Chart on Product Type - Market share 2025-2030 (%)
Data Table on Product Type - Market share 2025-2030 (%)

10.2 Comparison by Product Type

Chart on Comparison by Product Type
Data Table on Comparison by Product Type

10.3 Industrial freeze dryers - Market size and forecast 2025-2030

Chart on Industrial freeze dryers - Market size and forecast 2025-2030 ($ million)
Data Table on Industrial freeze dryers - Market size and forecast 2025-2030 ($ million)
Chart on Industrial freeze dryers - Year-over-year growth 2025-2030 (%)
Data Table on Industrial freeze dryers - Year-over-year growth 2025-2030 (%)

10.4 Vacuum freeze dryers - Market size and forecast 2025-2030

Chart on Vacuum freeze dryers - Market size and forecast 2025-2030 ($ million)
Data Table on Vacuum freeze dryers - Market size and forecast 2025-2030 ($ million)
Chart on Vacuum freeze dryers - Year-over-year growth 2025-2030 (%)
Data Table on Vacuum freeze dryers - Year-over-year growth 2025-2030 (%)

10.5 Laboratory freeze dryers - Market size and forecast 2025-2030

Chart on Laboratory freeze dryers - Market size and forecast 2025-2030 ($ million)
Data Table on Laboratory freeze dryers - Market size and forecast 2025-2030 ($ million)
Chart on Laboratory freeze dryers - Year-over-year growth 2025-2030 (%)
Data Table on Laboratory freeze dryers - Year-over-year growth 2025-2030 (%)

10.6 Others - Market size and forecast 2025-2030

Chart on Others - Market size and forecast 2025-2030 ($ million)
Data Table on Others - Market size and forecast 2025-2030 ($ million)
Chart on Others - Year-over-year growth 2025-2030 (%)
Data Table on Others - Year-over-year growth 2025-2030 (%)

10.7 Market opportunity by Product Type

Market opportunity by Product Type ($ million)
Data Table on Market opportunity by Product Type ($ million)

11. Customer Landscape

11.1 Customer landscape overview

Analysis of price sensitivity, lifecycle, customer purchase basket, adoption rates, and purchase criteria

12. Geographic Landscape

12.1 Geographic segmentation

Chart on Market share by geography 2025-2030 (%)
Data Table on Market share by geography 2025-2030 (%)

12.2 Geographic comparison

Chart on Geographic comparison
Data Table on Geographic comparison

12.3 Europe - Market size and forecast 2025-2030

Chart on Europe - Market size and forecast 2025-2030 ($ million)
Data Table on Europe - Market size and forecast 2025-2030 ($ million)
Chart on Europe - Year-over-year growth 2025-2030 (%)
Data Table on Europe - Year-over-year growth 2025-2030 (%)
Chart on Regional Comparison - Europe
Data Table on Regional Comparison - Europe

12.3.1 Germany - Market size and forecast 2025-2030

Chart on Germany - Market size and forecast 2025-2030 ($ million)
Data Table on Germany - Market size and forecast 2025-2030 ($ million)
Chart on Germany - Year-over-year growth 2025-2030 (%)
Data Table on Germany - Year-over-year growth 2025-2030 (%)

12.3.2 UK - Market size and forecast 2025-2030

Chart on UK - Market size and forecast 2025-2030 ($ million)
Data Table on UK - Market size and forecast 2025-2030 ($ million)
Chart on UK - Year-over-year growth 2025-2030 (%)
Data Table on UK - Year-over-year growth 2025-2030 (%)

12.3.3 France - Market size and forecast 2025-2030

Chart on France - Market size and forecast 2025-2030 ($ million)
Data Table on France - Market size and forecast 2025-2030 ($ million)
Chart on France - Year-over-year growth 2025-2030 (%)
Data Table on France - Year-over-year growth 2025-2030 (%)

12.3.4 Italy - Market size and forecast 2025-2030

Chart on Italy - Market size and forecast 2025-2030 ($ million)
Data Table on Italy - Market size and forecast 2025-2030 ($ million)
Chart on Italy - Year-over-year growth 2025-2030 (%)
Data Table on Italy - Year-over-year growth 2025-2030 (%)

12.3.5 Spain - Market size and forecast 2025-2030

Chart on Spain - Market size and forecast 2025-2030 ($ million)
Data Table on Spain - Market size and forecast 2025-2030 ($ million)
Chart on Spain - Year-over-year growth 2025-2030 (%)
Data Table on Spain - Year-over-year growth 2025-2030 (%)

12.3.6 The Netherlands - Market size and forecast 2025-2030

Chart on The Netherlands - Market size and forecast 2025-2030 ($ million)
Data Table on The Netherlands - Market size and forecast 2025-2030 ($ million)
Chart on The Netherlands - Year-over-year growth 2025-2030 (%)
Data Table on The Netherlands - Year-over-year growth 2025-2030 (%)

12.4 APAC - Market size and forecast 2025-2030

Chart on APAC - Market size and forecast 2025-2030 ($ million)
Data Table on APAC - Market size and forecast 2025-2030 ($ million)
Chart on APAC - Year-over-year growth 2025-2030 (%)
Data Table on APAC - Year-over-year growth 2025-2030 (%)
Chart on Regional Comparison - APAC
Data Table on Regional Comparison - APAC

12.4.1 China - Market size and forecast 2025-2030

Chart on China - Market size and forecast 2025-2030 ($ million)
Data Table on China - Market size and forecast 2025-2030 ($ million)
Chart on China - Year-over-year growth 2025-2030 (%)
Data Table on China - Year-over-year growth 2025-2030 (%)

12.4.2 Japan - Market size and forecast 2025-2030

Chart on Japan - Market size and forecast 2025-2030 ($ million)
Data Table on Japan - Market size and forecast 2025-2030 ($ million)
Chart on Japan - Year-over-year growth 2025-2030 (%)
Data Table on Japan - Year-over-year growth 2025-2030 (%)

12.4.3 India - Market size and forecast 2025-2030

Chart on India - Market size and forecast 2025-2030 ($ million)
Data Table on India - Market size and forecast 2025-2030 ($ million)
Chart on India - Year-over-year growth 2025-2030 (%)
Data Table on India - Year-over-year growth 2025-2030 (%)

12.4.4 South Korea - Market size and forecast 2025-2030

Chart on South Korea - Market size and forecast 2025-2030 ($ million)
Data Table on South Korea - Market size and forecast 2025-2030 ($ million)
Chart on South Korea - Year-over-year growth 2025-2030 (%)
Data Table on South Korea - Year-over-year growth 2025-2030 (%)

12.4.5 Australia - Market size and forecast 2025-2030

Chart on Australia - Market size and forecast 2025-2030 ($ million)
Data Table on Australia - Market size and forecast 2025-2030 ($ million)
Chart on Australia - Year-over-year growth 2025-2030 (%)
Data Table on Australia - Year-over-year growth 2025-2030 (%)

12.4.6 Indonesia - Market size and forecast 2025-2030

Chart on Indonesia - Market size and forecast 2025-2030 ($ million)
Data Table on Indonesia - Market size and forecast 2025-2030 ($ million)
Chart on Indonesia - Year-over-year growth 2025-2030 (%)
Data Table on Indonesia - Year-over-year growth 2025-2030 (%)

12.5 North America - Market size and forecast 2025-2030

Chart on North America - Market size and forecast 2025-2030 ($ million)
Data Table on North America - Market size and forecast 2025-2030 ($ million)
Chart on North America - Year-over-year growth 2025-2030 (%)
Data Table on North America - Year-over-year growth 2025-2030 (%)
Chart on Regional Comparison - North America
Data Table on Regional Comparison - North America

12.5.1 US - Market size and forecast 2025-2030

Chart on US - Market size and forecast 2025-2030 ($ million)
Data Table on US - Market size and forecast 2025-2030 ($ million)
Chart on US - Year-over-year growth 2025-2030 (%)
Data Table on US - Year-over-year growth 2025-2030 (%)

12.5.2 Canada - Market size and forecast 2025-2030

Chart on Canada - Market size and forecast 2025-2030 ($ million)
Data Table on Canada - Market size and forecast 2025-2030 ($ million)
Chart on Canada - Year-over-year growth 2025-2030 (%)
Data Table on Canada - Year-over-year growth 2025-2030 (%)

12.5.3 Mexico - Market size and forecast 2025-2030

Chart on Mexico - Market size and forecast 2025-2030 ($ million)
Data Table on Mexico - Market size and forecast 2025-2030 ($ million)
Chart on Mexico - Year-over-year growth 2025-2030 (%)
Data Table on Mexico - Year-over-year growth 2025-2030 (%)

12.6 South America - Market size and forecast 2025-2030

Chart on South America - Market size and forecast 2025-2030 ($ million)
Data Table on South America - Market size and forecast 2025-2030 ($ million)
Chart on South America - Year-over-year growth 2025-2030 (%)
Data Table on South America - Year-over-year growth 2025-2030 (%)
Chart on Regional Comparison - South America
Data Table on Regional Comparison - South America

12.6.1 Brazil - Market size and forecast 2025-2030

Chart on Brazil - Market size and forecast 2025-2030 ($ million)
Data Table on Brazil - Market size and forecast 2025-2030 ($ million)
Chart on Brazil - Year-over-year growth 2025-2030 (%)
Data Table on Brazil - Year-over-year growth 2025-2030 (%)

12.6.2 Argentina - Market size and forecast 2025-2030

Chart on Argentina - Market size and forecast 2025-2030 ($ million)
Data Table on Argentina - Market size and forecast 2025-2030 ($ million)
Chart on Argentina - Year-over-year growth 2025-2030 (%)
Data Table on Argentina - Year-over-year growth 2025-2030 (%)

12.6.3 Chile - Market size and forecast 2025-2030

Chart on Chile - Market size and forecast 2025-2030 ($ million)
Data Table on Chile - Market size and forecast 2025-2030 ($ million)
Chart on Chile - Year-over-year growth 2025-2030 (%)
Data Table on Chile - Year-over-year growth 2025-2030 (%)

12.7 Middle East and Africa - Market size and forecast 2025-2030

Chart on Middle East and Africa - Market size and forecast 2025-2030 ($ million)
Data Table on Middle East and Africa - Market size and forecast 2025-2030 ($ million)
Chart on Middle East and Africa - Year-over-year growth 2025-2030 (%)
Data Table on Middle East and Africa - Year-over-year growth 2025-2030 (%)
Chart on Regional Comparison - Middle East and Africa
Data Table on Regional Comparison - Middle East and Africa

12.7.1 Saudi Arabia - Market size and forecast 2025-2030

Chart on Saudi Arabia - Market size and forecast 2025-2030 ($ million)
Data Table on Saudi Arabia - Market size and forecast 2025-2030 ($ million)
Chart on Saudi Arabia - Year-over-year growth 2025-2030 (%)
Data Table on Saudi Arabia - Year-over-year growth 2025-2030 (%)

12.7.2 UAE - Market size and forecast 2025-2030

Chart on UAE - Market size and forecast 2025-2030 ($ million)
Data Table on UAE - Market size and forecast 2025-2030 ($ million)
Chart on UAE - Year-over-year growth 2025-2030 (%)
Data Table on UAE - Year-over-year growth 2025-2030 (%)

12.7.3 South Africa - Market size and forecast 2025-2030

Chart on South Africa - Market size and forecast 2025-2030 ($ million)
Data Table on South Africa - Market size and forecast 2025-2030 ($ million)
Chart on South Africa - Year-over-year growth 2025-2030 (%)
Data Table on South Africa - Year-over-year growth 2025-2030 (%)

12.7.4 Turkey - Market size and forecast 2025-2030

Chart on Turkey - Market size and forecast 2025-2030 ($ million)
Data Table on Turkey - Market size and forecast 2025-2030 ($ million)
Chart on Turkey - Year-over-year growth 2025-2030 (%)
Data Table on Turkey - Year-over-year growth 2025-2030 (%)

12.7.5 Israel - Market size and forecast 2025-2030

Chart on Israel - Market size and forecast 2025-2030 ($ million)
Data Table on Israel - Market size and forecast 2025-2030 ($ million)
Chart on Israel - Year-over-year growth 2025-2030 (%)
Data Table on Israel - Year-over-year growth 2025-2030 (%)

12.8 Market opportunity by geography

Market opportunity by geography ($ million)
Data Tables on Market opportunity by geography ($ million)

13. Drivers, Challenges, and Opportunity

13.1 Market drivers

Expansion of biopharmaceutical and biologics industries
Growth in food processing and preservation sector
Technological advancements and automation integration

13.2 Market challenges

High initial capital investment and substantial maintenance expenditures
Rising energy consumption and elevating operational costs
Stringent regulatory compliance and complex process validation

13.3 Impact of drivers and challenges

Impact of drivers and challenges in 2025 and 2030

13.4 Market opportunities

Emergence of continuous lyophilization systems in industrial operations
Diffusion of advanced process analytical technology and wireless monitoring infrastructure
Implementation of sustainable refrigeration architectures and eco friendly dehydration designs

14. Competitive Landscape

14.1 Overview

14.2

Overview on criticality of inputs and factors of differentiation

14.3 Landscape disruption

Overview on factors of disruption

14.4 Industry risks

Impact of key risks on business

15. Competitive Analysis

15.1 Companies profiled

Companies covered

15.2 Company ranking index

15.3 Market positioning of companies

Matrix on companies position and classification

15.4 Azbil Telstar SL

Azbil Telstar SL - Overview
Azbil Telstar SL - Product / Service
Azbil Telstar SL - Key offerings
SWOT

15.5 BUCHI Labortechnik AG

BUCHI Labortechnik AG - Overview
BUCHI Labortechnik AG - Product / Service
BUCHI Labortechnik AG - Key offerings
SWOT

15.6 Dara Lyo

Dara Lyo - Overview
Dara Lyo - Product / Service
Dara Lyo - Key offerings
SWOT

15.7 GEA Group AG

GEA Group AG - Overview
GEA Group AG - Business segments
GEA Group AG - Key news
GEA Group AG - Key offerings
GEA Group AG - Segment focus
SWOT

15.8 Getinge AB

Getinge AB - Overview
Getinge AB - Business segments
Getinge AB - Key offerings
Getinge AB - Segment focus
SWOT

15.9 HOF Sonderanlagenbau GmbH

HOF Sonderanlagenbau GmbH - Overview
HOF Sonderanlagenbau GmbH - Product / Service
HOF Sonderanlagenbau GmbH - Key offerings
SWOT

15.10 IMA SpA

IMA SpA - Overview
IMA SpA - Product / Service
IMA SpA - Key offerings
SWOT

15.11 Labconco Corp.

Labconco Corp. - Overview
Labconco Corp. - Product / Service
Labconco Corp. - Key offerings
SWOT

15.12 Martin Christ

Martin Christ - Overview
Martin Christ - Product / Service
Martin Christ - Key offerings
SWOT

15.13 OPTIMA Packaging Group GmbH

OPTIMA Packaging Group GmbH - Overview
OPTIMA Packaging Group GmbH - Product / Service
OPTIMA Packaging Group GmbH - Key offerings
SWOT

15.14 Serail

Serail - Overview
Serail - Product / Service
Serail - Key offerings
SWOT

15.15 SP Industries Inc.

SP Industries Inc. - Overview
SP Industries Inc. - Product / Service
SP Industries Inc. - Key offerings
SWOT

15.16 Syntegon Technology GmbH

Syntegon Technology GmbH - Overview
Syntegon Technology GmbH - Product / Service
Syntegon Technology GmbH - Key offerings
SWOT

15.17 Tofflon Science and Technology

Tofflon Science and Technology - Overview
Tofflon Science and Technology - Product / Service
Tofflon Science and Technology - Key offerings
SWOT

15.18 ZIRBUS technology GmbH

ZIRBUS technology GmbH - Overview
ZIRBUS technology GmbH - Product / Service
ZIRBUS technology GmbH - Key offerings
SWOT

16. Appendix

16.1 Scope of the report

Market definition
Objectives
Notes and caveats

16.2 Inclusions and exclusions checklist

Inclusions checklist
Exclusions checklist

16.3 Currency conversion rates for US$

16.4 Research methodology

16.5 Data procurement

Information sources

16.6 Data validation

16.7 Validation techniques employed for market sizing

16.8 Data synthesis

16.9 360 degree market analysis

16.10 List of abbreviations

Research Methodology

Technavio presents a detailed picture of the market by way of study, synthesis, and summation of data from multiple sources. The analysts have presented the various facets of the market with a particular focus on identifying the key industry influencers. The data thus presented is comprehensive, reliable, and the result of extensive research, both primary and secondary.

INFORMATION SOURCES

Primary sources

  • Manufacturers and suppliers
  • Channel partners
  • Industry experts
  • Strategic decision makers

Secondary sources

  • Industry journals and periodicals
  • Government data
  • Financial reports of key industry players
  • Historical data
  • Press releases

DATA ANALYSIS

Data Synthesis

  • Collation of data
  • Estimation of key figures
  • Analysis of derived insights

Data Validation

  • Triangulation with data models
  • Reference against proprietary databases
  • Corroboration with industry experts

REPORT WRITING

Qualitative

  • Market drivers
  • Market challenges
  • Market trends
  • Five forces analysis

Quantitative

  • Market size and forecast
  • Market segmentation
  • Geographical insights
  • Competitive landscape

Interested in this report?

Get your sample now to see our research methodology and insights!

Download Now

Frequently Asked Questions

Freeze Drying Equipment market growth will increase by USD 4950.2 million during 2026-2030.

The Freeze Drying Equipment market is expected to grow at a CAGR of 10.8% during 2026-2030.

Freeze Drying Equipment market is segmented by Product (Tray style, Manifold, Rotary) Application (Biotechnology, Food processing, Pharmaceuticals, Surgical procedures, Others) Product type (Industrial freeze dryers, Vacuum freeze dryers, Laboratory freeze dryers, Others)

Azbil Telstar SL, BUCHI Labortechnik AG, Cuddon Freeze Dry, Dara Lyo, GEA Group AG, Getinge AB, Harvest Right LLC, HOF Sonderanlagenbau GmbH, IMA SpA, Kemolo Co. Ltd., Labconco Corp., Lyogroup, Lyomac, Martin Christ, MechaTech Systems Ltd., Millrock Technology Inc., OPTIMA Packaging Group GmbH, Serail, Sienotech GmbH, SP Industries Inc., Syntegon Technology GmbH, Tofflon Science and Technology, ZIRBUS technology GmbH are a few of the key vendors in the Freeze Drying Equipment market.

Europe will register the highest growth rate of 45% among the other regions. Therefore, the Freeze Drying Equipment market in Europe is expected to garner significant business opportunities for the vendors during the forecast period.

Germany, UK, France, Italy, Spain, The Netherlands, China, Japan, India, South Korea, Australia, Indonesia, US, Canada, Mexico, Brazil, Argentina, Chile, Saudi Arabia, UAE, South Africa, Turkey, Israel

  • Expansion of biopharmaceutical and biologics industries is the driving factor this market.

The Freeze Drying Equipment market vendors should focus on grabbing business opportunities from the Product segment as it accounted for the largest market share in the base year.
RIA - Research AI Assistant
Ask RIA
