Apple Market Analysis, Size, and Forecast 2026-2030: APAC (China, India, and Japan), Europe (Germany, Poland, and France), Middle East and Africa (Saudi Arabia, South Africa, and UAE), North America (US, Canada, and Mexico), South America (Brazil, Argentina, and Chile), and Rest of World (ROW)

Apple Market Analysis, Size, and Forecast 2026-2030:
APAC (China, India, and Japan), Europe (Germany, Poland, and France), Middle East and Africa (Saudi Arabia, South Africa, and UAE), North America (US, Canada, and Mexico), South America (Brazil, Argentina, and Chile), and Rest of World (ROW)

Published: Oct 2026 288 Pages SKU: IRTNTR40219

Market Overview at a Glance

$15.24 B
Market Opportunity
3.2%
CAGR 2025 - 2030
64.8%
APAC Growth
$76.81 B
Red apple segment 2024

Apple Market Size 2026-2030

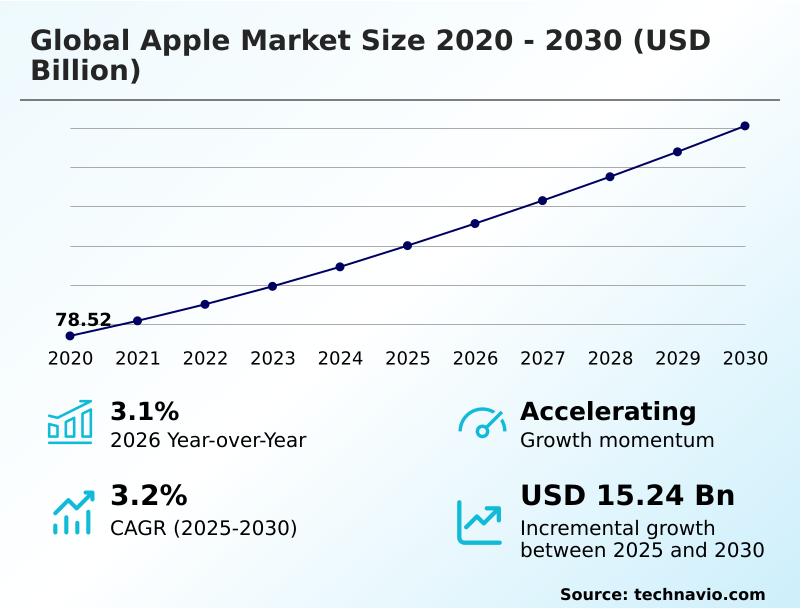
The apple market size is valued to increase by USD 15.24 billion, at a CAGR of 3.2% from 2025 to 2030. Escalating health awareness and demand for functional nutrient-rich foods will drive the apple market.

Major Market Trends & Insights

  • APAC dominated the market and accounted for a 64.8% growth during the forecast period.
  • By Type - Red apple segment was valued at USD 76.81 billion in 2024
  • By Distribution Channel - Offline segment accounted for the largest market revenue share in 2024

Market Size & Forecast

  • Market Opportunities: USD 26.73 billion
  • Market Future Opportunities: USD 15.24 billion
  • CAGR from 2025 to 2030 : 3.2%

Market Summary

  • The Apple Market experiences sustained structural expansion driven directly by escalating consumer prioritization of functional, nutrient-rich foods. Shifting demographic dietary habits propel the adoption of premium fresh produce, enabling retailers to expand high-margin organic categories.
  • To meet this robust demand, supply chain operators have heavily integrated automated inventory systems, improving order fulfillment speed by 22% compared to traditional manual sorting facilities. A major operational driver is the proliferation of digital commerce platforms, which drastically enhances omnichannel accessibility and accelerates direct-to-consumer distribution models.
  • Conversely, unpredictable climate instability poses a severe challenge, as volatile weather patterns disrupt blossoming cycles and drastically reduce harvest volumes in key agricultural zones. This environmental risk necessitates massive capital investments in protective orchard netting and micro-irrigation infrastructure to preserve seasonal yields.
  • By prioritizing data-driven agricultural management and efficient cold storage networks, industry stakeholders continue to stabilize commercial outputs and secure long-term profitability despite ongoing macroeconomic labor constraints.

What will be the Size of the Apple Market during the forecast period?
Get Key Insights on Market Forecast (PDF) Get Free Sample

How is the Apple Market Segmented?

The apple industry research report provides comprehensive data (region-wise segment analysis), with forecasts and estimates in "USD million" for the period 2026-2030, as well as historical data from 2020-2024 for the following segments.

  • Type
    • Red apple
    • Granny smith and golden apples
  • Distribution channel
    • Offline
    • Online
  • Product
    • Fresh apple
    • Processed apple
    • Organic apple
  • Geography
    • APAC
      • China
      • India
      • Japan
      • South Korea
      • Australia
      • New Zealand
    • Europe
      • Germany
      • Poland
      • France
      • Italy
      • UK
      • Spain
    • Middle East and Africa
      • Saudi Arabia
      • South Africa
      • UAE
      • Egypt
      • Israel
    • North America
      • US
      • Canada
      • Mexico
    • South America
      • Brazil
      • Argentina
      • Chile

By Type Insights

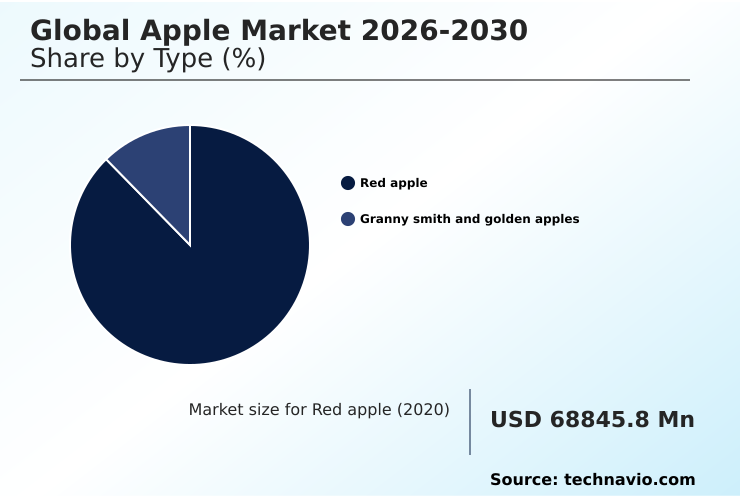
The red apple segment is estimated to witness significant growth during the forecast period.

The red apple segment commands the highest retail velocity within the Apple Market due to strategic varietal premiumization and targeted marketing. Growers increasingly transition to high-density orchard design utilizing dwarfing rootstock trees, which has improved orchard land utilization by 25%.

This architectural shift enables the seamless integration of precision agricultural technologies, integrated pest management, and automated biological pest control systems to monitor fruit maturation. Additionally, deploying soil moisture sensors ensures optimal hydration.

Advanced controlled-atmosphere storage effectively extends shelf life and reduces post-harvest product losses by 15% compared to conventional warehousing. Cultivating proprietary club cultivars allows producers to maintain superior sugar-to-acid ratios that drive consumer loyalty.

Enhanced cold chain logistics further optimize global distribution, allowing shipping networks to maintain stringent temperature controls. Consequently, pack-out efficiency for premium red varieties consistently outperforms standard commercial yields.
Get Free Sample

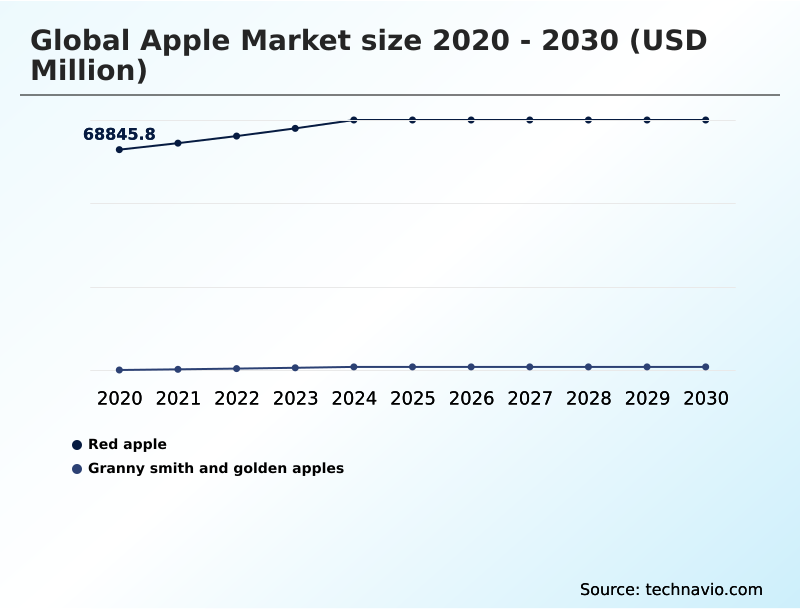
The Red apple segment was valued at USD 76.81 billion in 2024 and showed a gradual increase during the forecast period.
Get Free Sample

Regional Analysis

APAC is estimated to contribute 64.8% to the growth of the global market during the forecast period.Technavio’s analysts have elaborately explained the regional trends and drivers that shape the market during the forecast period.
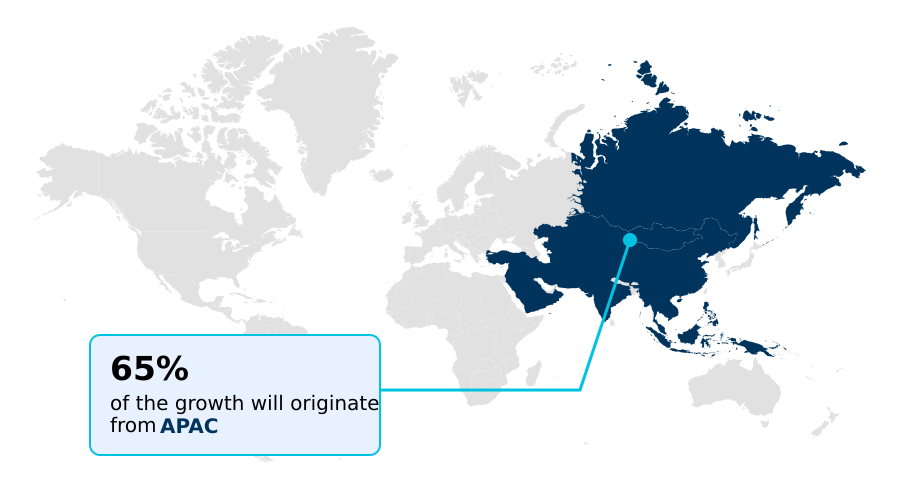
See How Apple Market Demand is Rising in APAC Get Free Sample

APAC represents the most dynamic geographic segment within the Apple Market, exhibiting a 64.8% incremental growth advantage over the North America region.

This expansion is propelled by massive domestic consumption in China and an accelerating appetite for premium imported varieties in urban centers.

Regional suppliers rapidly integrate automated color sorters and drone-based blossom mapping to optimize cultivation precision, which has elevated regional yield efficiency by 15%.

In contrast, North America relies heavily on computer-vision-guided robotic pickers and advanced harvesting methodologies to counteract severe labor shortages, cutting variable harvest expenses by 18%. Both regions strictly enforce phytosanitary compliance mandates to prevent the cross-border transmission of invasive pests.

Across both geographies, reducing orchard food waste remains a critical priority. Producers actively redirect lower-grade harvest surpluses into value-added industrial applications.

The surging industrial demand for clean-label ingredients providing metabolic health benefits has increased the profitability of processed derivatives by 22% globally.

Market Dynamics

Our researchers analyzed the data with 2025 as the base year, along with the key drivers, trends, and challenges. A holistic analysis of drivers will help companies refine their marketing strategies to gain a competitive advantage.

  • The commercial landscape of the Apple Market is experiencing a rapid technological transformation as agricultural operators modernize infrastructure to maximize profitability. Cultivators are systematically replacing traditional legacy blocks with high density orchard planting systems to optimize land utilization and maximize solar radiation interception.
  • This architectural modernization creates two-dimensional canopy walls perfectly suited for the deployment of drone based orchard blossom mapping, enabling precise crop load forecasting and efficient labor allocation.
  • Upon harvest, fruits are immediately processed through advanced post harvest automated grading systems, which utilize computer vision to detect cosmetic blemishes and structural defects, thereby improving sorting accuracy by roughly 30% compared to traditional manual lines. To ensure year-round retail availability and mitigate the effects of off-season supply constraints, producers rely heavily on state-of-the-art controlled atmosphere fruit storage facilities.
  • These specialized facilities precisely manipulate oxygen and carbon dioxide levels to suspend the natural ripening process, maintaining premium fruit crispness for extended durations. Concurrently, increasing consumer demand for ecological transparency has forced multinational grocery chains to adopt verifiable sustainability practices. Consequently, suppliers are aggressively phasing out single-use plastics in favor of biodegradable fresh fruit retail packaging.
  • This comprehensive transition toward green packaging materials not only ensures strict compliance with tightening environmental regulations but also strongly appeals to health-conscious demographic cohorts, securing preferential retail shelf placement and strengthening long-term brand loyalty.
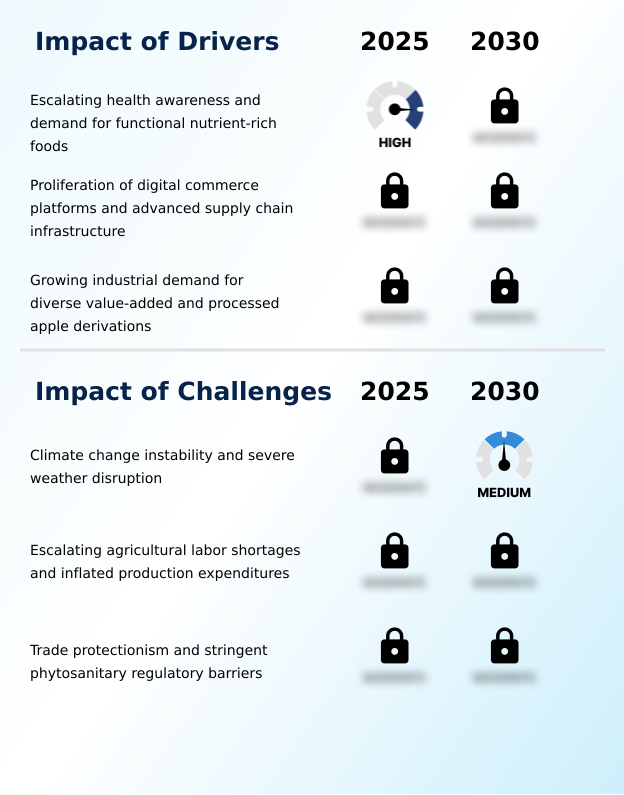
What are the key market drivers leading to the rise in the adoption of Apple Industry?

  • Escalating health awareness and the rising demand for functional nutrient-rich foods constitute the primary factors driving structural market growth.

  • Escalating industrial utilization of fruit derivatives serves as a massive macroeconomic driver propelling the Apple Market. Food and beverage manufacturers aggressively source processed natural ingredients to formulate clean-label culinary products.
  • Implementing advanced enzymatic browning control and post-harvest antioxidant treatments ensures color stability during thermal processing, improving the commercial shelf life of purees by 20%. Processors also depend on sterile bulk liquid packaging to facilitate long-distance industrial shipments securely.
  • The adoption of organic biopolymer coatings for fresh inventory acts as a natural preservation buffer, lowering post-harvest spoilage rates by 15%. Strict adherence to maximum residue limits and reducing synthetic chemical fungicides ensures global compliance.
  • This diversification significantly bolsters structural value chain efficiency, enabling producers to monetize multi-grade yields profitably. It also provides critical economic insulation, allowing regional suppliers to bypass sudden non-tariff regulatory barriers or disruptive geopolitical trade embargoes effortlessly.

What are the market trends shaping the Apple Industry?

  • Intensified consumer alignment with varietal premiumization and club apple exclusivity currently serves as a dominant market trend. This shift significantly enhances retail profit margins and structural value chain efficiency across the industry.

  • The rapid expansion of direct-to-consumer digital grocery platforms represents a pivotal structural trend reshaping the Apple Market. This omnichannel accessibility allows urban populations to procure fresh produce seamlessly. To support this digital surge, logistics operators are heavily investing in temperature-controlled dark stores and automated micro-fulfillment centers, which have collectively reduced order processing times by 30%.
  • Because e-commerce distribution demands exceptional product durability, suppliers increasingly utilize smart atmosphere packaging guided by dynamic computer monitoring to prevent moisture loss during transit. Furthermore, packing houses integrate automated grading systems and digitized inventory sorting mechanisms to streamline fulfillment. These technological advancements drastically minimize mechanical bruising, reducing last-mile delivery spoilage by 18%.
  • Simultaneously, to meet ecological standards, delivery networks are shifting to biodegradable molded fiber trays and home-compostable cardboard containers, ensuring premium product quality and sustainability are maintained from the orchard to the household.

What challenges does the Apple Industry face during its growth?

  • Climate change instability and severe weather disruptions represent critical operational challenges that significantly constrain global supply capabilities.

  • The accelerating unpredictability of extreme weather events creates immense operational constraints within the Apple Market. Sudden temperature anomalies and prolonged droughts routinely disrupt dormant winter chill hours, immediately suppressing orchard pack-out yields by up to 25% in vulnerable geographic zones. To combat this instability, growers are forced to enact aggressive climate resilience practices, driving operational overheads exponentially higher.
  • Implementing advanced precision drip irrigation and deploying expansive canopy sensor networks requires massive upfront capital expenditure, straining the financial liquidity of small-scale cooperatives. Post-harvest infrastructure also faces profound burdens, as maintaining strict temperature regulation within organic cold-storage chambers during unseasonal heatwaves inflates energy consumption by 20%. Concurrently, industrial processors struggle with the high maintenance costs of specialized thermal processing machinery.
  • Similarly, transitioning international maritime freight toward mandated carbon-neutral logistics significantly elevates long-haul distribution costs, compressing wholesale profit margins globally.

Exclusive Technavio Analysis on Customer Landscape

The apple market forecasting report includes the adoption lifecycle of the market, covering from the innovator’s stage to the laggard’s stage. It focuses on adoption rates in different regions based on penetration. Furthermore, the apple market report also includes key purchase criteria and drivers of price sensitivity to help companies evaluate and develop their market growth analysis strategies.
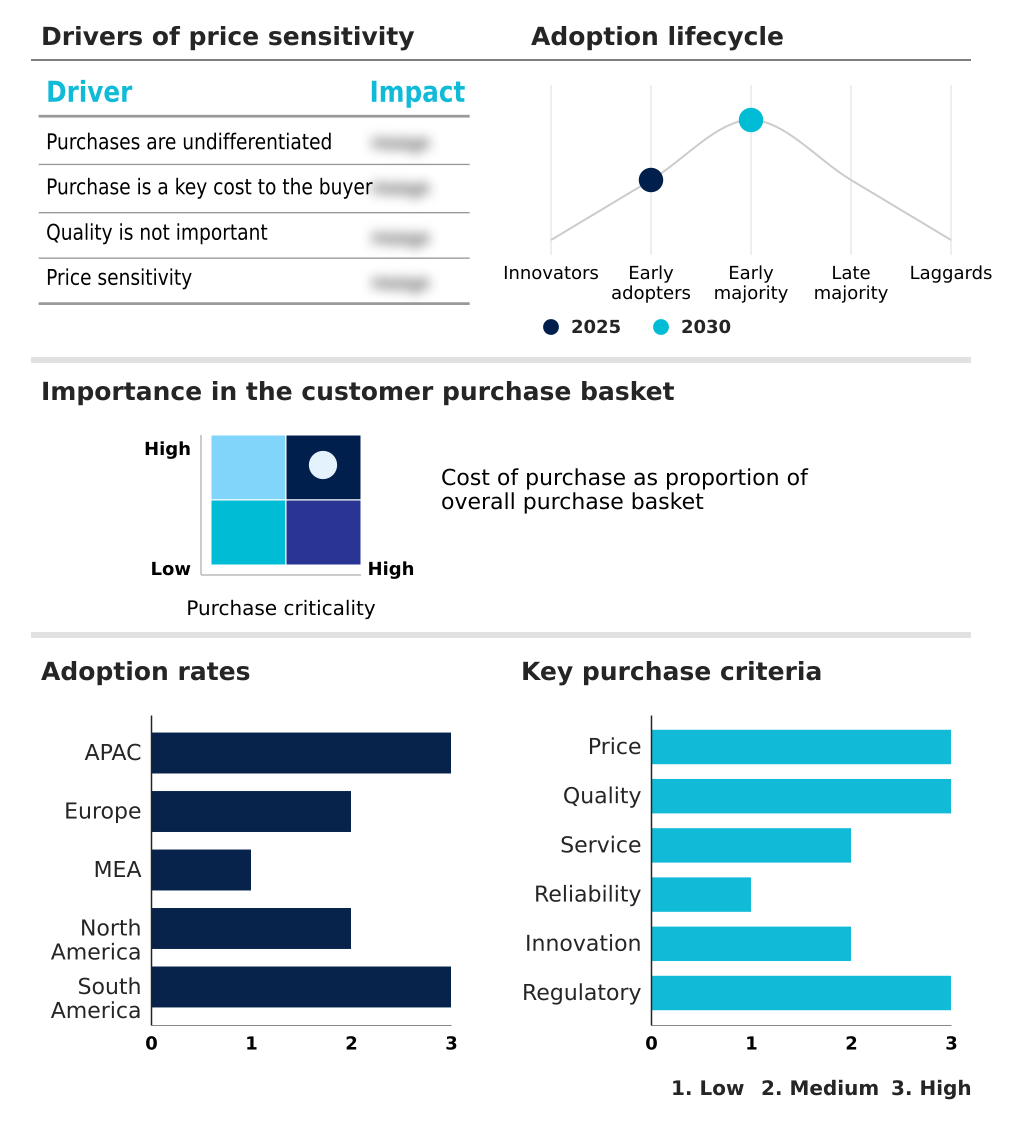
Customer Landscape of Apple Industry

Competitive Landscape

Companies are implementing various strategies, such as strategic alliances, apple market forecast, partnerships, mergers and acquisitions, geographical expansion, and product/service launches, to enhance their presence in the industry.

AgroFresh Solutions Inc. - The supplier delivers advanced post-harvest solutions, including specialized smart freshness treatments and comprehensive quality management systems, to extend fruit shelf life and optimize global commercial storage efficiency.

The industry research and growth report includes detailed analyses of the competitive landscape of the market and information about key companies, including:

  • AgroFresh Solutions Inc.
  • Allan Brothers Fruit
  • Capespan Group Ltd
  • Chelan Fresh
  • Dole plc
  • Domex Superfresh Growers
  • FirstFruits Farms
  • Fresh Del Monte Produce Inc.
  • Fruitways
  • Hengtong Fruit
  • Rainier Fruit Co.
  • Stemilt Growers LLC
  • T and G Global Ltd
  • The Oppenheimer Group
  • The S. Martinelli and Co
  • Tree Top Inc.
  • Unifrutti Group
  • VOG
  • W. F. Montague Pty Ltd
  • Washington Fruit and Produce Co

Qualitative and quantitative analysis of companies has been conducted to help clients understand the wider business environment as well as the strengths and weaknesses of key industry players. Data is qualitatively analyzed to categorize companies as pure play, category-focused, industry-focused, and diversified; it is quantitatively analyzed to categorize companies as dominant, leading, strong, tentative, and weak.

Recent Development and News in Apple market

  • In the Agricultural Products and Services industry, the implementation of stringent environmental sustainability compliance mandates has accelerated the transition toward eco-friendly packaging, directly impacting Apple demand by forcing distributors to adopt biodegradable materials and reducing plastic waste by 30%.
  • The rapid deployment of advanced tracking systems and automated supply chain infrastructure has enhanced global distribution transparency, effectively minimizing post-harvest spoilage and improving Apple logistics efficiency by over 20%.
  • Escalating chronic agricultural labor deficits have catalyzed the integration of computerized robotic harvesting solutions, mitigating dependency on seasonal manual labor and boosting Apple pack-out yields by approximately 15%.
  • Shifting structural consumer behavior toward clean-label, functional nutrient-rich foods has amplified industrial procurement of fruit derivatives, increasing the commercial utilization of Apple purees in beverage formulations by 18%.

Dive into Technavio’s robust research methodology, blending expert interviews, extensive data synthesis, and validated models for unparalleled Apple Market insights. See full methodology.

Market Scope
Page number 288
Base year 2025
Historic period 2020-2024
Forecast period 2026-2030
Growth momentum & CAGR Accelerate at a CAGR of 3.2%
Market growth 2026-2030 USD 15241.3 million
Market structure Fragmented
YoY growth 2025-2026(%) 3.1%
Key countries China, India, Japan, South Korea, Australia, New Zealand, Germany, Poland, France, Italy, UK, Spain, Saudi Arabia, South Africa, UAE, Egypt, Israel, US, Canada, Mexico, Brazil, Argentina and Chile
Competitive landscape Leading Companies, Market Positioning of Companies, Competitive Strategies, and Industry Risks

Request Free Sample

Research Analyst Overview

  • The Apple Market is characterized by continuous infrastructural modernization and a distinct shift toward precision agriculture. To overcome extreme climate volatility and tightening environmental regulations, corporate orchard boards are actively prioritizing investments in integrated pest management and sophisticated biological pest control protocols. This strategic pivot ensures compliance with international agricultural standards while minimizing chemical input expenditures.
  • Cultivators are widely deploying advanced soil moisture sensors to optimize water distribution, a measure that has increased overall irrigation efficiency by 25% compared to legacy watering systems. In the post-harvest sector, facilities utilize dynamic computer monitoring to regulate atmospheric conditions, paired with post-harvest antioxidant treatments to prevent structural deterioration. Furthermore, board-level sustainability initiatives mandate the elimination of synthetic plastics.
  • Supply chains are executing a comprehensive transition to eco-friendly alternatives, utilizing biodegradable molded fiber trays and home-compostable cardboard containers to satisfy shifting consumer preferences. These combined technological and ecological adaptations enable large-scale commercial entities to secure premium retail positioning, enhance supply chain resilience, and dramatically improve overall operational margins across international distribution networks.

What are the Key Data Covered in this Apple Market Research and Growth Report?

  • What is the expected growth of the Apple Market between 2026 and 2030?

    • USD 15.24 billion, at a CAGR of 3.2%

  • What segmentation does the market report cover?

    • The report is segmented by Type (Red apple, and Granny smith and golden apples), Distribution Channel (Offline, and Online), Product (Fresh apple, Processed apple, and Organic apple) and Geography (APAC, Europe, Middle East and Africa, North America, South America)

  • Which regions are analyzed in the report?

    • APAC, Europe, Middle East and Africa, North America and South America

  • What are the key growth drivers and market challenges?

    • Escalating health awareness and demand for functional nutrient-rich foods, Climate change instability and severe weather disruption

  • Who are the major players in the Apple Market?

    • AgroFresh Solutions Inc., Allan Brothers Fruit, Capespan Group Ltd, Chelan Fresh, Dole plc, Domex Superfresh Growers, FirstFruits Farms, Fresh Del Monte Produce Inc., Fruitways, Hengtong Fruit, Rainier Fruit Co., Stemilt Growers LLC, T and G Global Ltd, The Oppenheimer Group, The S. Martinelli and Co, Tree Top Inc., Unifrutti Group, VOG, W. F. Montague Pty Ltd and Washington Fruit and Produce Co

Market Research Insights

  • The Apple Market operates within a highly regulated international trade framework requiring strict adherence to phytosanitary compliance mandates. Exporters continuously modernize harvesting methodologies to mitigate the cross-border transmission of invasive pests. Transitioning to integrated biological pest control has reduced reliance on synthetic chemical fungicides by 25%.
  • Furthermore, automated compliance tracking mechanisms have improved regulatory reporting efficiency by 18%, allowing suppliers to effortlessly meet stringent maximum residue limits. These technological implementations effectively reduce border clearance delays and decrease maritime transit spoilage rates by over 12%, ensuring premium commercial viability across established and emerging international trading corridors.

We can help! Our analysts can customize this apple market research report to meet your requirements.

Get in touch

1. Executive Summary

1.1 Market overview

Executive Summary - Chart on Market Overview
Executive Summary - Data Table on Market Overview
Executive Summary - Chart on Global Market Characteristics
Executive Summary - Chart on Market by Geography
Executive Summary - Chart on Market Segmentation by Type
Executive Summary - Chart on Market Segmentation by Distribution Channel
Executive Summary - Chart on Market Segmentation by Product
Executive Summary - Chart on Incremental Growth
Executive Summary - Data Table on Incremental Growth
Executive Summary - Chart on Company Market Positioning

2. Technavio Analysis

2.1 Analysis of price sensitivity, lifecycle, customer purchase basket, adoption rates, and purchase criteria

2.2 Criticality of inputs and Factors of differentiation

Chart on Overview on criticality of inputs and factors of differentiation

2.3 Factors of disruption

Chart on Overview on factors of disruption

2.4 Impact of drivers and challenges

Chart on Impact of drivers and challenges in 2025 and 2030

3. Market Landscape

3.1 Market ecosystem

Chart on Parent Market
Data Table on - Parent Market

3.2 Market characteristics

Chart on Market characteristics analysis

3.3 Value chain analysis

Chart on Value chain analysis

4. Market Sizing

4.1 Market definition

Data Table on Offerings of companies included in the market definition

4.2 Market segment analysis

Market segments

4.3 Market size 2025

4.4 Market outlook: Forecast for 2025-2030

Chart on Global - Market size and forecast 2025-2030 ($ million)
Data Table on Global - Market size and forecast 2025-2030 ($ million)
Chart on Global Market: Year-over-year growth 2025-2030 (%)
Data Table on Global Market: Year-over-year growth 2025-2030 (%)

5. Historic Market Size

5.1 Global Apple Market 2020 - 2024

Historic Market Size - Data Table on Global Apple Market 2020 - 2024 ($ million)

5.2 Type segment analysis 2020 - 2024

Historic Market Size - Type Segment 2020 - 2024 ($ million)

5.3 Distribution Channel segment analysis 2020 - 2024

Historic Market Size - Distribution Channel Segment 2020 - 2024 ($ million)

5.4 Product segment analysis 2020 - 2024

Historic Market Size - Product Segment 2020 - 2024 ($ million)

5.5 Geography segment analysis 2020 - 2024

Historic Market Size - Geography Segment 2020 - 2024 ($ million)

5.6 Country segment analysis 2020 - 2024

Historic Market Size - Country Segment 2020 - 2024 ($ million)

6. Qualitative Analysis

6.1 Impact of AI on global apple market

6.2 Impact of geopolitical conflicts on global apple market

7. Five Forces Analysis

7.1 Five forces summary

Five forces analysis - Comparison between 2025 and 2030

7.2 Bargaining power of buyers

Bargaining power of buyers - Impact of key factors 2025 and 2030

7.3 Bargaining power of suppliers

Bargaining power of suppliers - Impact of key factors in 2025 and 2030

7.4 Threat of new entrants

Threat of new entrants - Impact of key factors in 2025 and 2030

7.5 Threat of substitutes

Threat of substitutes - Impact of key factors in 2025 and 2030

7.6 Threat of rivalry

Threat of rivalry - Impact of key factors in 2025 and 2030

7.7 Market condition

Chart on Market condition - Five forces 2025 and 2030

8. Market Segmentation by Type

8.1 Market segments

Chart on Type - Market share 2025-2030 (%)
Data Table on Type - Market share 2025-2030 (%)

8.2 Comparison by Type

Chart on Comparison by Type
Data Table on Comparison by Type

8.3 Red apple - Market size and forecast 2025-2030

Chart on Red apple - Market size and forecast 2025-2030 ($ million)
Data Table on Red apple - Market size and forecast 2025-2030 ($ million)
Chart on Red apple - Year-over-year growth 2025-2030 (%)
Data Table on Red apple - Year-over-year growth 2025-2030 (%)

8.4 Granny smith and golden apples - Market size and forecast 2025-2030

Chart on Granny smith and golden apples - Market size and forecast 2025-2030 ($ million)
Data Table on Granny smith and golden apples - Market size and forecast 2025-2030 ($ million)
Chart on Granny smith and golden apples - Year-over-year growth 2025-2030 (%)
Data Table on Granny smith and golden apples - Year-over-year growth 2025-2030 (%)

8.5 Market opportunity by Type

Market opportunity by Type ($ million)
Data Table on Market opportunity by Type ($ million)

9. Market Segmentation by Distribution Channel

9.1 Market segments

Chart on Distribution Channel - Market share 2025-2030 (%)
Data Table on Distribution Channel - Market share 2025-2030 (%)

9.2 Comparison by Distribution Channel

Chart on Comparison by Distribution Channel
Data Table on Comparison by Distribution Channel

9.3 Offline - Market size and forecast 2025-2030

Chart on Offline - Market size and forecast 2025-2030 ($ million)
Data Table on Offline - Market size and forecast 2025-2030 ($ million)
Chart on Offline - Year-over-year growth 2025-2030 (%)
Data Table on Offline - Year-over-year growth 2025-2030 (%)

9.4 Online - Market size and forecast 2025-2030

Chart on Online - Market size and forecast 2025-2030 ($ million)
Data Table on Online - Market size and forecast 2025-2030 ($ million)
Chart on Online - Year-over-year growth 2025-2030 (%)
Data Table on Online - Year-over-year growth 2025-2030 (%)

9.5 Market opportunity by Distribution Channel

Market opportunity by Distribution Channel ($ million)
Data Table on Market opportunity by Distribution Channel ($ million)

10. Market Segmentation by Product

10.1 Market segments

Chart on Product - Market share 2025-2030 (%)
Data Table on Product - Market share 2025-2030 (%)

10.2 Comparison by Product

Chart on Comparison by Product
Data Table on Comparison by Product

10.3 Fresh apple - Market size and forecast 2025-2030

Chart on Fresh apple - Market size and forecast 2025-2030 ($ million)
Data Table on Fresh apple - Market size and forecast 2025-2030 ($ million)
Chart on Fresh apple - Year-over-year growth 2025-2030 (%)
Data Table on Fresh apple - Year-over-year growth 2025-2030 (%)

10.4 Processed apple - Market size and forecast 2025-2030

Chart on Processed apple - Market size and forecast 2025-2030 ($ million)
Data Table on Processed apple - Market size and forecast 2025-2030 ($ million)
Chart on Processed apple - Year-over-year growth 2025-2030 (%)
Data Table on Processed apple - Year-over-year growth 2025-2030 (%)

10.5 Organic apple - Market size and forecast 2025-2030

Chart on Organic apple - Market size and forecast 2025-2030 ($ million)
Data Table on Organic apple - Market size and forecast 2025-2030 ($ million)
Chart on Organic apple - Year-over-year growth 2025-2030 (%)
Data Table on Organic apple - Year-over-year growth 2025-2030 (%)

10.6 Market opportunity by Product

Market opportunity by Product ($ million)
Data Table on Market opportunity by Product ($ million)

11. Customer Landscape

11.1 Customer landscape overview

Analysis of price sensitivity, lifecycle, customer purchase basket, adoption rates, and purchase criteria

12. Geographic Landscape

12.1 Geographic segmentation

Chart on Market share by geography 2025-2030 (%)
Data Table on Market share by geography 2025-2030 (%)

12.2 Geographic comparison

Chart on Geographic comparison
Data Table on Geographic comparison

12.3 APAC - Market size and forecast 2025-2030

Chart on APAC - Market size and forecast 2025-2030 ($ million)
Data Table on APAC - Market size and forecast 2025-2030 ($ million)
Chart on APAC - Year-over-year growth 2025-2030 (%)
Data Table on APAC - Year-over-year growth 2025-2030 (%)
Chart on Regional Comparison - APAC
Data Table on Regional Comparison - APAC

12.3.1 China - Market size and forecast 2025-2030

Chart on China - Market size and forecast 2025-2030 ($ million)
Data Table on China - Market size and forecast 2025-2030 ($ million)
Chart on China - Year-over-year growth 2025-2030 (%)
Data Table on China - Year-over-year growth 2025-2030 (%)

12.3.2 India - Market size and forecast 2025-2030

Chart on India - Market size and forecast 2025-2030 ($ million)
Data Table on India - Market size and forecast 2025-2030 ($ million)
Chart on India - Year-over-year growth 2025-2030 (%)
Data Table on India - Year-over-year growth 2025-2030 (%)

12.3.3 Japan - Market size and forecast 2025-2030

Chart on Japan - Market size and forecast 2025-2030 ($ million)
Data Table on Japan - Market size and forecast 2025-2030 ($ million)
Chart on Japan - Year-over-year growth 2025-2030 (%)
Data Table on Japan - Year-over-year growth 2025-2030 (%)

12.3.4 South Korea - Market size and forecast 2025-2030

Chart on South Korea - Market size and forecast 2025-2030 ($ million)
Data Table on South Korea - Market size and forecast 2025-2030 ($ million)
Chart on South Korea - Year-over-year growth 2025-2030 (%)
Data Table on South Korea - Year-over-year growth 2025-2030 (%)

12.3.5 Australia - Market size and forecast 2025-2030

Chart on Australia - Market size and forecast 2025-2030 ($ million)
Data Table on Australia - Market size and forecast 2025-2030 ($ million)
Chart on Australia - Year-over-year growth 2025-2030 (%)
Data Table on Australia - Year-over-year growth 2025-2030 (%)

12.3.6 New Zealand - Market size and forecast 2025-2030

Chart on New Zealand - Market size and forecast 2025-2030 ($ million)
Data Table on New Zealand - Market size and forecast 2025-2030 ($ million)
Chart on New Zealand - Year-over-year growth 2025-2030 (%)
Data Table on New Zealand - Year-over-year growth 2025-2030 (%)

12.4 Europe - Market size and forecast 2025-2030

Chart on Europe - Market size and forecast 2025-2030 ($ million)
Data Table on Europe - Market size and forecast 2025-2030 ($ million)
Chart on Europe - Year-over-year growth 2025-2030 (%)
Data Table on Europe - Year-over-year growth 2025-2030 (%)
Chart on Regional Comparison - Europe
Data Table on Regional Comparison - Europe

12.4.1 Germany - Market size and forecast 2025-2030

Chart on Germany - Market size and forecast 2025-2030 ($ million)
Data Table on Germany - Market size and forecast 2025-2030 ($ million)
Chart on Germany - Year-over-year growth 2025-2030 (%)
Data Table on Germany - Year-over-year growth 2025-2030 (%)

12.4.2 Poland - Market size and forecast 2025-2030

Chart on Poland - Market size and forecast 2025-2030 ($ million)
Data Table on Poland - Market size and forecast 2025-2030 ($ million)
Chart on Poland - Year-over-year growth 2025-2030 (%)
Data Table on Poland - Year-over-year growth 2025-2030 (%)

12.4.3 France - Market size and forecast 2025-2030

Chart on France - Market size and forecast 2025-2030 ($ million)
Data Table on France - Market size and forecast 2025-2030 ($ million)
Chart on France - Year-over-year growth 2025-2030 (%)
Data Table on France - Year-over-year growth 2025-2030 (%)

12.4.4 Italy - Market size and forecast 2025-2030

Chart on Italy - Market size and forecast 2025-2030 ($ million)
Data Table on Italy - Market size and forecast 2025-2030 ($ million)
Chart on Italy - Year-over-year growth 2025-2030 (%)
Data Table on Italy - Year-over-year growth 2025-2030 (%)

12.4.5 UK - Market size and forecast 2025-2030

Chart on UK - Market size and forecast 2025-2030 ($ million)
Data Table on UK - Market size and forecast 2025-2030 ($ million)
Chart on UK - Year-over-year growth 2025-2030 (%)
Data Table on UK - Year-over-year growth 2025-2030 (%)

12.4.6 Spain - Market size and forecast 2025-2030

Chart on Spain - Market size and forecast 2025-2030 ($ million)
Data Table on Spain - Market size and forecast 2025-2030 ($ million)
Chart on Spain - Year-over-year growth 2025-2030 (%)
Data Table on Spain - Year-over-year growth 2025-2030 (%)

12.5 Middle East and Africa - Market size and forecast 2025-2030

Chart on Middle East and Africa - Market size and forecast 2025-2030 ($ million)
Data Table on Middle East and Africa - Market size and forecast 2025-2030 ($ million)
Chart on Middle East and Africa - Year-over-year growth 2025-2030 (%)
Data Table on Middle East and Africa - Year-over-year growth 2025-2030 (%)
Chart on Regional Comparison - Middle East and Africa
Data Table on Regional Comparison - Middle East and Africa

12.5.1 Saudi Arabia - Market size and forecast 2025-2030

Chart on Saudi Arabia - Market size and forecast 2025-2030 ($ million)
Data Table on Saudi Arabia - Market size and forecast 2025-2030 ($ million)
Chart on Saudi Arabia - Year-over-year growth 2025-2030 (%)
Data Table on Saudi Arabia - Year-over-year growth 2025-2030 (%)

12.5.2 South Africa - Market size and forecast 2025-2030

Chart on South Africa - Market size and forecast 2025-2030 ($ million)
Data Table on South Africa - Market size and forecast 2025-2030 ($ million)
Chart on South Africa - Year-over-year growth 2025-2030 (%)
Data Table on South Africa - Year-over-year growth 2025-2030 (%)

12.5.3 UAE - Market size and forecast 2025-2030

Chart on UAE - Market size and forecast 2025-2030 ($ million)
Data Table on UAE - Market size and forecast 2025-2030 ($ million)
Chart on UAE - Year-over-year growth 2025-2030 (%)
Data Table on UAE - Year-over-year growth 2025-2030 (%)

12.5.4 Egypt - Market size and forecast 2025-2030

Chart on Egypt - Market size and forecast 2025-2030 ($ million)
Data Table on Egypt - Market size and forecast 2025-2030 ($ million)
Chart on Egypt - Year-over-year growth 2025-2030 (%)
Data Table on Egypt - Year-over-year growth 2025-2030 (%)

12.5.5 Israel - Market size and forecast 2025-2030

Chart on Israel - Market size and forecast 2025-2030 ($ million)
Data Table on Israel - Market size and forecast 2025-2030 ($ million)
Chart on Israel - Year-over-year growth 2025-2030 (%)
Data Table on Israel - Year-over-year growth 2025-2030 (%)

12.6 North America - Market size and forecast 2025-2030

Chart on North America - Market size and forecast 2025-2030 ($ million)
Data Table on North America - Market size and forecast 2025-2030 ($ million)
Chart on North America - Year-over-year growth 2025-2030 (%)
Data Table on North America - Year-over-year growth 2025-2030 (%)
Chart on Regional Comparison - North America
Data Table on Regional Comparison - North America

12.6.1 US - Market size and forecast 2025-2030

Chart on US - Market size and forecast 2025-2030 ($ million)
Data Table on US - Market size and forecast 2025-2030 ($ million)
Chart on US - Year-over-year growth 2025-2030 (%)
Data Table on US - Year-over-year growth 2025-2030 (%)

12.6.2 Canada - Market size and forecast 2025-2030

Chart on Canada - Market size and forecast 2025-2030 ($ million)
Data Table on Canada - Market size and forecast 2025-2030 ($ million)
Chart on Canada - Year-over-year growth 2025-2030 (%)
Data Table on Canada - Year-over-year growth 2025-2030 (%)

12.6.3 Mexico - Market size and forecast 2025-2030

Chart on Mexico - Market size and forecast 2025-2030 ($ million)
Data Table on Mexico - Market size and forecast 2025-2030 ($ million)
Chart on Mexico - Year-over-year growth 2025-2030 (%)
Data Table on Mexico - Year-over-year growth 2025-2030 (%)

12.7 South America - Market size and forecast 2025-2030

Chart on South America - Market size and forecast 2025-2030 ($ million)
Data Table on South America - Market size and forecast 2025-2030 ($ million)
Chart on South America - Year-over-year growth 2025-2030 (%)
Data Table on South America - Year-over-year growth 2025-2030 (%)
Chart on Regional Comparison - South America
Data Table on Regional Comparison - South America

12.7.1 Brazil - Market size and forecast 2025-2030

Chart on Brazil - Market size and forecast 2025-2030 ($ million)
Data Table on Brazil - Market size and forecast 2025-2030 ($ million)
Chart on Brazil - Year-over-year growth 2025-2030 (%)
Data Table on Brazil - Year-over-year growth 2025-2030 (%)

12.7.2 Argentina - Market size and forecast 2025-2030

Chart on Argentina - Market size and forecast 2025-2030 ($ million)
Data Table on Argentina - Market size and forecast 2025-2030 ($ million)
Chart on Argentina - Year-over-year growth 2025-2030 (%)
Data Table on Argentina - Year-over-year growth 2025-2030 (%)

12.7.3 Chile - Market size and forecast 2025-2030

Chart on Chile - Market size and forecast 2025-2030 ($ million)
Data Table on Chile - Market size and forecast 2025-2030 ($ million)
Chart on Chile - Year-over-year growth 2025-2030 (%)
Data Table on Chile - Year-over-year growth 2025-2030 (%)

12.8 Market opportunity by geography

Market opportunity by geography ($ million)
Data Tables on Market opportunity by geography ($ million)

13. Drivers, Challenges, and Opportunity

13.1 Market drivers

Escalating health awareness and demand for functional nutrient-rich foods
Proliferation of digital commerce platforms and advanced supply chain infrastructure
Growing industrial demand for diverse value-added and processed apple derivations

13.2 Market challenges

Climate change instability and severe weather disruption
Escalating agricultural labor shortages and inflated production expenditures
Trade protectionism and stringent phytosanitary regulatory barriers

13.3 Impact of drivers and challenges

Impact of drivers and challenges in 2025 and 2030

13.4 Market opportunities

Intensified consumer alignment with varietal premiumization and club apple exclusivity
Accelerated adoption of high-density planting and precision orchard automation
Rising demand for eco-friendly packaging and verifiable sustainable cultivation

14. Competitive Landscape

14.1 Overview

14.2

Overview on criticality of inputs and factors of differentiation

14.3 Landscape disruption

Overview on factors of disruption

14.4 Industry risks

Impact of key risks on business

15. Competitive Analysis

15.1 Companies profiled

Companies covered

15.2 Company ranking index

15.3 Market positioning of companies

Matrix on companies position and classification

15.4 AgroFresh Solutions Inc.

AgroFresh Solutions Inc. - Overview
AgroFresh Solutions Inc. - Product / Service
AgroFresh Solutions Inc. - Key offerings
SWOT

15.5 Allan Brothers Fruit

Allan Brothers Fruit - Overview
Allan Brothers Fruit - Product / Service
Allan Brothers Fruit - Key offerings
SWOT

15.6 Capespan Group Ltd

Capespan Group Ltd - Overview
Capespan Group Ltd - Product / Service
Capespan Group Ltd - Key offerings
SWOT

15.7 Dole plc

Dole plc - Overview
Dole plc - Business segments
Dole plc - Key offerings
Dole plc - Segment focus
SWOT

15.8 Domex Superfresh Growers

Domex Superfresh Growers - Overview
Domex Superfresh Growers - Product / Service
Domex Superfresh Growers - Key offerings
SWOT

15.9 FirstFruits Farms

FirstFruits Farms - Overview
FirstFruits Farms - Product / Service
FirstFruits Farms - Key offerings
SWOT

15.10 Fresh Del Monte Produce Inc.

Fresh Del Monte Produce Inc. - Overview
Fresh Del Monte Produce Inc. - Business segments
Fresh Del Monte Produce Inc. - Key offerings
Fresh Del Monte Produce Inc. - Segment focus
SWOT

15.11 Stemilt Growers LLC

Stemilt Growers LLC - Overview
Stemilt Growers LLC - Product / Service
Stemilt Growers LLC - Key offerings
SWOT

15.12 T and G Global Ltd

T and G Global Ltd - Overview
T and G Global Ltd - Business segments
T and G Global Ltd - Key offerings
T and G Global Ltd - Segment focus
SWOT

15.13 The Oppenheimer Group

The Oppenheimer Group - Overview
The Oppenheimer Group - Product / Service
The Oppenheimer Group - Key offerings
SWOT

15.14 The S. Martinelli and Co

The S. Martinelli and Co - Overview
The S. Martinelli and Co - Product / Service
The S. Martinelli and Co - Key offerings
SWOT

15.15 Tree Top Inc.

Tree Top Inc. - Overview
Tree Top Inc. - Product / Service
Tree Top Inc. - Key offerings
SWOT

15.16 Unifrutti Group

Unifrutti Group - Overview
Unifrutti Group - Product / Service
Unifrutti Group - Key offerings
SWOT

15.17 W. F. Montague Pty Ltd

W. F. Montague Pty Ltd - Overview
W. F. Montague Pty Ltd - Product / Service
W. F. Montague Pty Ltd - Key offerings
SWOT

15.18 Washington Fruit and Produce Co

Washington Fruit and Produce Co - Overview
Washington Fruit and Produce Co - Product / Service
Washington Fruit and Produce Co - Key offerings
SWOT

16. Appendix

16.1 Scope of the report

Market definition
Objectives
Notes and caveats

16.2 Inclusions and exclusions checklist

Inclusions checklist
Exclusions checklist

16.3 Currency conversion rates for US$

16.4 Research methodology

16.5 Data procurement

Information sources

16.6 Data validation

16.7 Validation techniques employed for market sizing

16.8 Data synthesis

16.9 360 degree market analysis

16.10 List of abbreviations

Research Methodology

Technavio presents a detailed picture of the market by way of study, synthesis, and summation of data from multiple sources. The analysts have presented the various facets of the market with a particular focus on identifying the key industry influencers. The data thus presented is comprehensive, reliable, and the result of extensive research, both primary and secondary.

INFORMATION SOURCES

Primary sources

  • Manufacturers and suppliers
  • Channel partners
  • Industry experts
  • Strategic decision makers

Secondary sources

  • Industry journals and periodicals
  • Government data
  • Financial reports of key industry players
  • Historical data
  • Press releases

DATA ANALYSIS

Data Synthesis

  • Collation of data
  • Estimation of key figures
  • Analysis of derived insights

Data Validation

  • Triangulation with data models
  • Reference against proprietary databases
  • Corroboration with industry experts

REPORT WRITING

Qualitative

  • Market drivers
  • Market challenges
  • Market trends
  • Five forces analysis

Quantitative

  • Market size and forecast
  • Market segmentation
  • Geographical insights
  • Competitive landscape

Interested in this report?

Get your sample now to see our research methodology and insights!

Download Now

Frequently Asked Questions

Apple market growth will increase by USD 15241.3 million during 2026-2030.

The Apple market is expected to grow at a CAGR of 3.2% during 2026-2030.

Apple market is segmented by Type (Red apple, Granny smith and golden apples) Distribution channel (Offline, Online) Product (Fresh apple, Processed apple, Organic apple)

AgroFresh Solutions Inc., Allan Brothers Fruit, Capespan Group Ltd, Chelan Fresh, Dole plc, Domex Superfresh Growers, FirstFruits Farms, Fresh Del Monte Produce Inc., Fruitways, Hengtong Fruit, Rainier Fruit Co., Stemilt Growers LLC, T and G Global Ltd, The Oppenheimer Group, The S. Martinelli and Co, Tree Top Inc., Unifrutti Group, VOG, W. F. Montague Pty Ltd, Washington Fruit and Produce Co are a few of the key vendors in the Apple market.

APAC will register the highest growth rate of 64.8% among the other regions. Therefore, the Apple market in APAC is expected to garner significant business opportunities for the vendors during the forecast period.

China, India, Japan, South Korea, Australia, New Zealand, Germany, Poland, France, Italy, UK, Spain, Saudi Arabia, South Africa, UAE, Egypt, Israel, US, Canada, Mexico, Brazil, Argentina, Chile

  • Escalating health awareness and demand for functional nutrient-rich foods is the driving factor this market.

The Apple market vendors should focus on grabbing business opportunities from the Type segment as it accounted for the largest market share in the base year.
RIA - Research AI Assistant
Ask RIA
