Fuel Analyzer Market Size 2024-2028
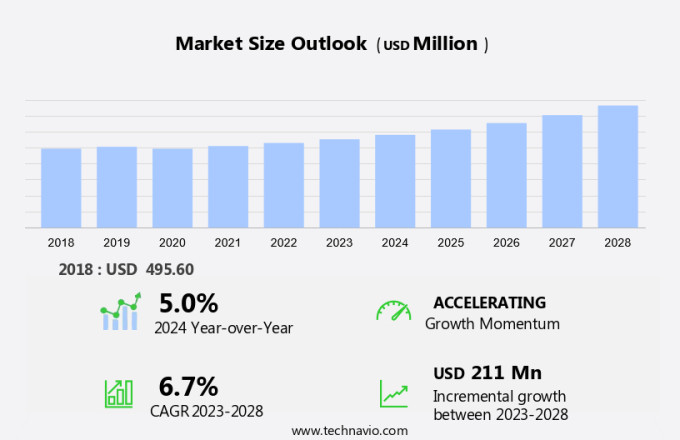
The fuel analyzer market size is forecast to increase by USD 211 billion at a CAGR of 6.7% between 2023 and 2028. The shift towards renewable and alternative fuels, such as biodiesel and ethanol, is driving market growth as these fuels require regular analysis to ensure their quality and compliance with industry standards. Advanced sensors, such as gas chromatographs, mass spectrometers, infrared analyzers, and nondispersive infrared (NDIR) sensors, are being integrated into fuel analyzers to provide accurate and real-time measurements of gas composition. IoT integration is also driving market growth, enabling remote monitoring and analysis of fuel quality and greenhouse gas emissions. Additionally, the need for air pollution control and reducing greenhouse gas emissions is leading to the development of advanced fuel analyzers using technologies like tunable filter spectroscopy. Overall, the market is witnessing a strong focus on innovation and precision in fuel analysis to meet the evolving needs of various industries.
What will be the Size of the Market During the Forecast Period?
The market encompasses a range of analytical devices designed to measure and analyze the composition of gaseous compounds in various industries. These industries include agriculture, waste management, shale gas, tight oil explorations, corrosion prevention, gas leakage detection, natural gas pipelines, construction and mining, and more. Safety is a paramount concern in all these sectors, making fuel analyzers an indispensable tool for monitoring gas levels and ensuring regulatory compliance. In agriculture, for instance, fuel analyzers help farmers optimize their operations by analyzing the methane content in biogas produced from livestock waste.
Furthermore, in the oil and gas sector, fuel analyzers are essential for maintaining safety control regulations, preventing corrosion, and minimizing gas leakages. Construction and mining sites also rely on fuel analyzers to monitor gas emissions and ensure compliance with emission standards. Handheld devices and automated solutions equipped with advanced sensors, such as gas chromatographs, mass spectrometers, infrared analyzers, and nondispersive infrared (NDIR), facilitate real-time analysis and data collection. IoT integration further enhances the capabilities of fuel analyzers, enabling remote monitoring and predictive maintenance. Gas composition analysis is crucial in industries like waste management, where identifying specific gases can help optimize processes and reduce environmental impact.
Market Segmentation
The market research report provides comprehensive data (region-wise segment analysis), with forecasts and estimates in "USD million" for the period 2024-2028, as well as historical data from 2018-2022 for the following segments.
- Type
- Portable fuel analyzer
- Fixed fuel analyzer
- End-user
- Transportation
- Oil and gas
- Manufacturing
- Aerospace
- Power generation
- Geography
- North America
- US
- Europe
- APAC
- China
- Japan
- South America
- Middle East and Africa
- North America
By Type Insights
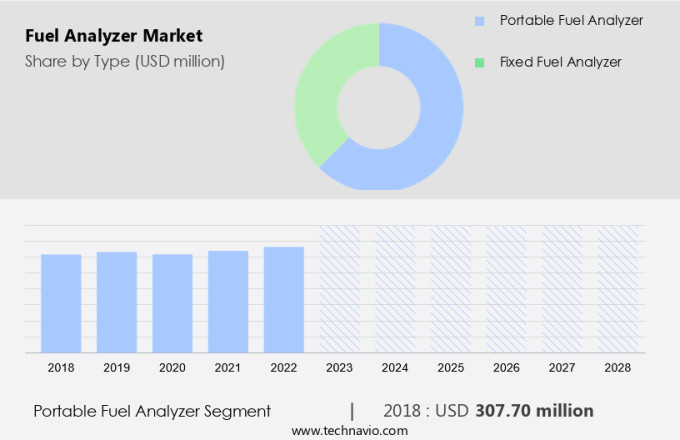
The portable fuel analyzer segment is estimated to witness significant growth during the forecast period. The market in the United States is experiencing substantial expansion, specifically within the portable fuel analyzer sector. These instruments are engineered to deliver swift and precise fuel analysis in diverse locations such as power plants, harbors, and oil fields. The demand for portable fuel analyzers stems from the importance of prompt and dependable fuel property assessments. These evaluations are essential for optimizing engine efficiency and maintaining fuel quality. One of the prominent products in this category is the portable fuel property analyzer (PFPA), model K24900, offered by Koehler. This analyzer boasts rapid fuel analysis using a minuscule 2 mL sample size.
Furthermore, the PFPA utilizes near-infrared spectroscopy in conjunction with sophisticated multivariate analysis to ascertain essential fuel properties, including the concentration of Oxygen Analyzers, Carbon Monoxide, Carbon Dioxide, Methane, Hydrocarbon, Hydrogen, Nitrogen Oxide, Sulfur Dioxide, Helium, Chlorine, and Hydrogen Chloride. By providing accurate and timely fuel analysis, the PFPA enables users to make informed decisions and enhance operational efficiency.
Get a glance at the market share of various segments Request Free Sample
The portable fuel analyzer segment accounted for USD 307.70 million in 2018 and showed a gradual increase during the forecast period.
Regional Insights
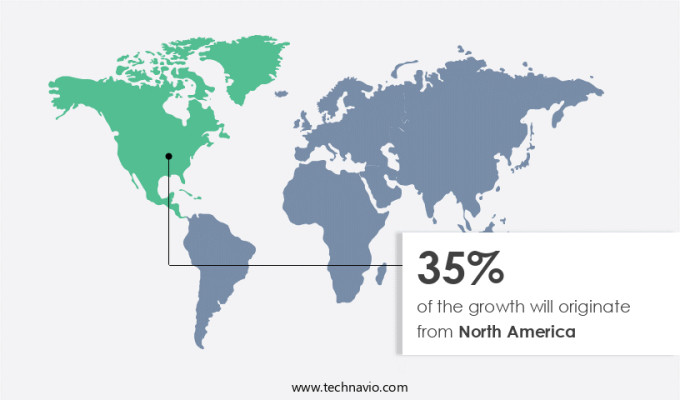
North America is estimated to contribute 35% to the growth of the global market during the forecast period. Technavio's analysts have elaborately explained the regional trends and drivers that shape the market during the forecast period.
For more insights on the market share of various regions Request Free Sample
The North American market is experiencing notable expansion due to the rising production capacity of sustainable aviation fuel (SAF) and other biofuels. In the US, there is a significant push to enhance SAF production capabilities, which is anticipated to bring about substantial market growth throughout the forecast period.
Furthermore, these developments in the US are expected to significantly impact the market, as these fuels require precise analysis for optimal performance and safety in various industries, including agriculture, waste management, and natural gas pipelines. With the increasing focus on safety, Shale gas, and tight oil explorations, fuel analyzers play a crucial role in monitoring gas levels, preventing corrosion, and detecting gas leakages to ensure operational efficiency and safety.
Our researchers analyzed the data with 2023 as the base year, along with the key drivers, trends, and challenges. A holistic analysis of drivers will help companies refine their marketing strategies to gain a competitive advantage.
Market Driver
Increasing demand for alternative fuels is the key driver of the market. The market in the United States is witnessing notable expansion due to the increasing emphasis on safety control regulations and the adoption of cleaner energy sources. Handheld devices, a popular choice for on-site fuel analysis, are gaining traction in various industries, including agriculture and workplace hazard monitoring. These devices enable precision analysis of fuel samples, thereby facilitating preventive actions against corrosion costs and environmental emission control. Moreover, the need for explosive detection in industrial settings is fueling the demand for advanced fuel analyzers. Clinical assays, which are integral to healthcare and research applications, also require accurate fuel analysis for efficient energy production.
Furthermore, innovative techniques such as TDL (Tunable Diode Laser) are being employed to enhance the capabilities of fuel analyzers, offering improved accuracy and reliability. In the context of the agricultural sector, fuel analyzers play a crucial role in optimizing storage and transportation processes, ensuring the safety and quality of fuels. By providing real-time data on fuel composition and contaminants, these devices enable timely preventive actions, reducing operational costs and minimizing the risk of equipment damage. In summary, the market in the US is poised for continued growth, driven by the need for safety, regulatory compliance, and the pursuit of cleaner, more efficient energy sources. The adoption of advanced technologies, such as handheld devices and TDL techniques, is further bolstering market growth.
Market Trends
Automation in fuel testing is the upcoming trend in the market. The market in the US is experiencing a notable trend towards automation, as the construction and mining industries seek more efficient, precise, and dependable fuel testing solutions. One illustrative advancement in this domain is Imenco's fuel SCAN Analyzer. This system epitomizes the automation shift by conducting routine tests for jet fuel, adhering to international regulations. It performs daily, weekly, and monthly tests on transportable and stationary fuel storage tanks, as well as filter vessels, without human intervention.
Furthermore, this automation not only ensures greater accuracy but also minimizes the risk of fuel contamination and wastage. Moreover, the integration of Internet of Things (IoT) technology in fuel analyzers enables real-time monitoring and analysis of fuel gas composition. Advanced sensors, such as gas chromatographs, mass spectrometers, infrared analyzers, and nondispersive infrared (NDIR) sensors, are increasingly being employed to enhance the functionality of fuel analyzers. Additionally, tunable filter spectroscopy is gaining popularity for its ability to measure air pollution control and greenhouse gas emissions.
Market Challenge
Complexities in designing fuel analyzers is a key challenge affecting the market growth. Fuel analyzers play a crucial role in ensuring regulatory compliance and optimizing operational efficiency in various industries, particularly in the context of increasing environmental concerns and stringent emission standards. In the United States, the Environmental Protection Agency (EPA) has set forth ultra-low emission limits, necessitating the use of advanced fuel analyzers to measure and monitor various pollutants, including hydrogen sulfide (H2S), carbon dioxide (CO2), and methane emissions.
Furthermore, these analyzers must be versatile and adaptable to cater to diverse operational requirements. Fuel analyzers are often modular and expandable, enabling them to measure multiple gas components. They can be portable for targeted environmental assessments or permanently installed for continuous monitoring at facilities such as power plants and refineries. The use of advanced technologies like Tunable Diode Lasers (TDLs) ensures high accuracy and reliability in emission measurements. By implementing fuel analyzers, industries can mitigate their environmental impact, adhere to emission standards, and ultimately contribute to a cleaner and more sustainable future.
Exclusive Customer Landscape
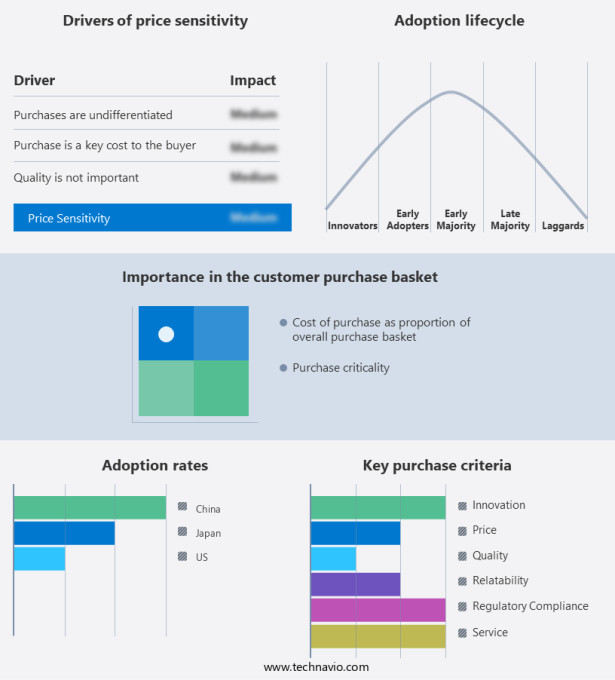
The market forecasting report includes the adoption lifecycle of the market, covering from the innovator's stage to the laggard's stage. It focuses on adoption rates in different regions based on penetration. Furthermore, the report also includes key purchase criteria and drivers of price sensitivity to help companies evaluate and develop their market growth analysis strategies.
Customer Landscape
Key Companies & Market Insights
Companies are implementing various strategies, such as strategic alliances, partnerships, mergers and acquisitions, geographical expansion, and product/service launches, to enhance their presence in the market.
AMETEK Inc: The company offers high precision fuel quality testing portable FTIR analyzer for gasoline, diesel, and jet fuels.
The market research and growth report includes detailed analyses of the competitive landscape of the market and information about key companies, including:
- directindustry
- Elementar Americas Inc.
- eralytics GmbH
- HORIBA Ltd.
- Icon Analysers
- IKM Instrutek AS
- Imenco
- Koehler Instrument Co Inc
- Labindia Instruments Pvt. Ltd.
- Malvern Panalytical Ltd.
- PAC LP
- Phase Analyzer Co. LTD
- Real Time Analyzers Inc.
- Shimadzu Corp.
- Teledyne Analytical Instruments
- Thermo Fisher Scientific Inc.
- Zeltex LLC
Qualitative and quantitative analysis of companies has been conducted to help clients understand the wider business environment as well as the strengths and weaknesses of key market players. Data is qualitatively analyzed to categorize companies as pure play, category-focused, industry-focused, and diversified; it is quantitatively analyzed to categorize companies as dominant, leading, strong, tentative, and weak.
Research Analyst Overview
The market encompasses a wide range of analytical devices designed to measure and analyze various gaseous compounds. These analyzers play a crucial role in industries such as agriculture, waste management, and energy production, where ensuring safety, maintaining optimal gas levels, and complying with safety control regulations are paramount. gas analyzers are essential for shale gas and tight oil explorations, as they help prevent corrosion and detect gas leakages in natural gas pipelines. In agriculture, they are used for agricultural storage and workplace-hazard monitoring, ensuring precision analysis of combustible gases and preventing corrosion costs. The market also caters to industries like construction and mining, where real-time measurements of oxygen, carbon monoxide, and hydrocarbons are vital for safety and efficiency.
Furthermore, in the realm of environmental emission control, fuel analyzers are used to monitor and reduce greenhouse gas emissions and air pollution levels. Advanced sensors, IoT integration, and automated solutions are driving the evolution of fuel analyzers, enabling remote monitoring, emergency detection, and compliance with emission standards in various industries. Portable gas analyzers offer flexibility and convenience, making them indispensable for various applications, from petrochemicals to clinical assays and explosive detection.
|
Market Scope |
|
|
Report Coverage |
Details |
|
Page number |
211 |
|
Base year |
2023 |
|
Historic period |
2018-2022 |
|
Forecast period |
2024-2028 |
|
Growth momentum & CAGR |
Accelerate at a CAGR of 6.7% |
|
Market Growth 2024-2028 |
USD 211 million |
|
Market structure |
Fragmented |
|
YoY growth 2023-2024(%) |
5.0 |
|
Regional analysis |
North America, Europe, APAC, South America, and Middle East and Africa |
|
Performing market contribution |
North America at 35% |
|
Key countries |
US, China, and Japan |
|
Competitive landscape |
Leading Companies, Market Positioning of Companies, Competitive Strategies, and Industry Risks |
|
Key companies profiled |
AMETEK Inc., directindustry, Elementar Americas Inc., eralytics GmbH, HORIBA Ltd., Icon Analysers, IKM Instrutek AS, Imenco, Koehler Instrument Co Inc, Labindia Instruments Pvt. Ltd., Malvern Panalytical Ltd., PAC LP, Phase Analyzer Co. LTD, Real Time Analyzers Inc., Shimadzu Corp., Teledyne Analytical Instruments, Thermo Fisher Scientific Inc., and Zeltex LLC |
|
Market dynamics |
Parent market analysis, market growth inducers and obstacles, market forecast, fast-growing and slow-growing segment analysis, COVID-19 impact and recovery analysis and future consumer dynamics, market condition analysis for the forecast period |
|
Customization purview |
If our market report has not included the data that you are looking for, you can reach out to our analysts and get segments customized. |
What are the Key Data Covered in this Market Research and Growth Report?
- CAGR of the market during the forecast period
- Detailed information on factors that will drive the market growth and forecasting between 2024 and 2028
- Precise estimation of the size of the market and its contribution of the market in focus to the parent market
- Accurate predictions about upcoming market growth and trends and changes in consumer behaviour
- Growth of the market across North America, Europe, APAC, South America, and Middle East and Africa
- Thorough analysis of the market's competitive landscape and detailed information about companies
- Comprehensive analysis of factors that will challenge the growth of market companies
We can help! Our analysts can customize this market research report to meet your requirements. Get in touch


