
Functional Foods And Beverages Market Size 2025-2029
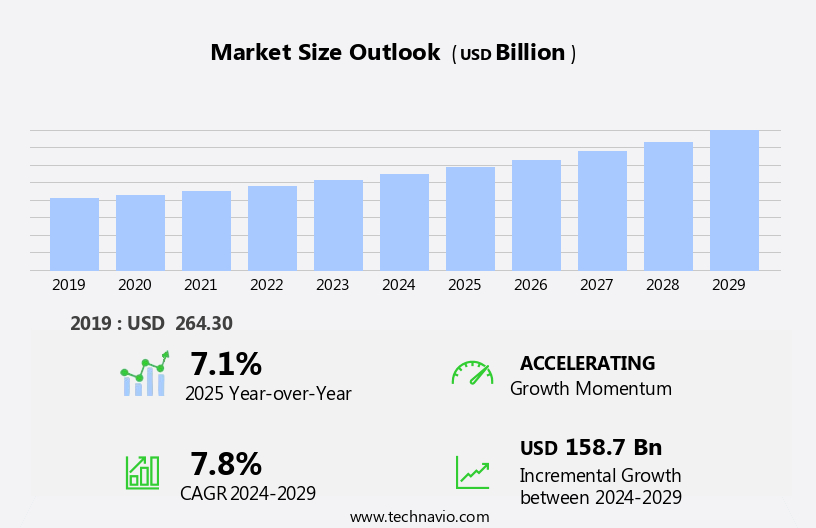
The functional foods and beverages market size is forecast to increase by USD 158.7 billion, at a CAGR of 7.8% between 2024 and 2029.
- The market is driven by the increasing consumer preference for healthier food and drink options. Product innovations continue to shape the market landscape, as companies introduce new functional foods and beverages that cater to diverse health needs and consumer preferences. Rising awareness of the health benefits associated with these products is a significant factor fueling market growth. Functional foods and beverages, enriched with nutraceuticals, have gained significant traction in the market due to the rising awareness of their health benefits. Key ingredients, such as botanical extracts, enzymes, vitamins, and minerals, are increasingly being added to popular food items like yogurt, tea, chocolate, and even lemonade. However, the market faces challenges related to product ingredient labeling and consumer skepticism regarding the authenticity of functional claims. Companies must navigate these challenges by ensuring transparency in labeling and delivering on their functional claims through scientific evidence. To capitalize on market opportunities, businesses should focus on product innovation, sustainability, and addressing consumer demands for natural and organic options.
- Effective marketing strategies that highlight the health benefits and authenticity of functional ingredients can also help companies differentiate themselves in a competitive market. Overall, the market presents significant opportunities for growth, driven by consumer trends and the continuous development of innovative products. Companies that can effectively address challenges and meet evolving consumer demands will be well-positioned for success.
What will be the Size of the Functional Foods And Beverages Market during the forecast period?
Explore in-depth regional segment analysis with market size data - historical 2019-2023 and forecasts 2025-2029 - in the full report.
Request Free Sample
The market continues to evolve, driven by consumer preferences for clean label products and product differentiation. Product labeling transparency and subscription models are gaining traction, as consumers seek to understand what they are consuming and simplify their purchasing process. Packaging technology advances enable longer shelf life and improved brand reputation, while sports nutrition and immune support remain popular applications. Pricing strategies and quality control are crucial considerations, with ingredient innovation and regulatory compliance key drivers. The gut microbiome and fiber supplements are emerging areas of focus, as scientific understanding of their health benefits grows. Sustainable practices, organic certification, and ethical sourcing are also important factors, as consumers increasingly demand transparency and accountability.
Vitamins and minerals, plant-based protein, and nutrient density continue to be key components of functional foods and beverages. Emerging technologies, such as precision fermentation and synthetic biology, offer opportunities for innovation and health claims. Consumer education and marketing campaigns play a critical role in driving awareness and adoption, with cognitive function, cardiovascular health, and omega-3 fatty acids among the key health benefits. Botanical extracts and ingredient sourcing are also areas of interest, as consumers seek naturally derived and scientifically backed solutions. Food safety, brand reputation, and regulatory compliance are ongoing concerns, with clinical studies and consumer preferences shaping market dynamics.
Retail distribution channels continue to evolve, with e-commerce and direct-to-consumer models gaining popularity. Personalized nutrition and weight management are also areas of growth, as consumers seek customized solutions to meet their unique health needs. Functional beverages, including those focused on gut health, digestive health, and cognitive function, are a growing segment of the market. Antioxidant supplements are an integral part of this landscape, as consumers seek to protect against oxidative stress and promote overall health and wellness. The market's continuous dynamism underscores the importance of staying informed and adaptable to meet evolving consumer demands.
How is this Functional Foods And Beverages Industry segmented?
The functional foods and beverages industry research report provides comprehensive data (region-wise segment analysis), with forecasts and estimates in "USD billion" for the period 2025-2029, as well as historical data from 2019-2023 for the following segments.
- Product
- Functional foods
- Functional beverages
- Distribution Channel
- Offline
- Online
- Type
- Bakery products
- Confectionery products
- Snacks
- Energy drinks
- Sports drinks
- Application
- Health and wellness
- Immunity
- Clinical nutrition
- Cardio health
- Ingredients
- Probiotics & Prebiotics
- Proteins & Amino Acids
- Vitamins
- Minerals
- Fibers
- Omega-3 Fatty Acids
- Carotenoids
- Botanicals
- Other Bioactive Ingredients
- Geography
- North America
- US
- Canada
- Europe
- France
- Germany
- Italy
- UK
- Middle East and Africa
- Egypt
- KSA
- Oman
- UAE
- APAC
- China
- India
- Japan
- South America
- Argentina
- Brazil
- Rest of World (ROW)
- North America
By Product Insights
The functional foods segment is estimated to witness significant growth during the forecast period.
The market is experiencing significant growth, driven by product and ingredient innovations. Consumers are increasingly seeking clean label options with clear product differentiation and labeling, leading to the popularity of functional foods. Subscription models are also gaining traction, providing consumers with regular access to these products. In the realm of sports nutrition, immune support, and weight management, functional foods offer health benefits that resonate with consumers. Emerging technologies, such as precision fermentation and synthetic biology, are revolutionizing the industry. These advancements enable the production of plant-based proteins, fiber supplements, and other nutrient-dense ingredients. Regulatory compliance is a critical consideration, with strict regulations governing health claims, consumer education, and ingredient sourcing.
Functional beverages, including those focused on gut health, digestive health, cognitive function, and cardiovascular health, are gaining popularity. Brands are leveraging botanical extracts, omega-3 fatty acids, and antioxidant supplements to cater to consumer preferences. Sustainable practices, ethical sourcing, and clinical studies further bolster the market's appeal. Quality control, pricing strategies, and food safety are essential aspects of the market. Organic certification and nutrient density are also key factors influencing consumer choices. As the market evolves, brands must prioritize brand reputation, shelf life, and consumer education to stay competitive. Marketing campaigns that emphasize the scientifically backed health benefits of functional foods and beverages are effective in attracting and retaining customers.
Consumer preferences for personalized nutrition and fiber supplements are shaping the market landscape. Despite the challenges, the market's future looks promising, with continued innovation and regulatory compliance driving growth.
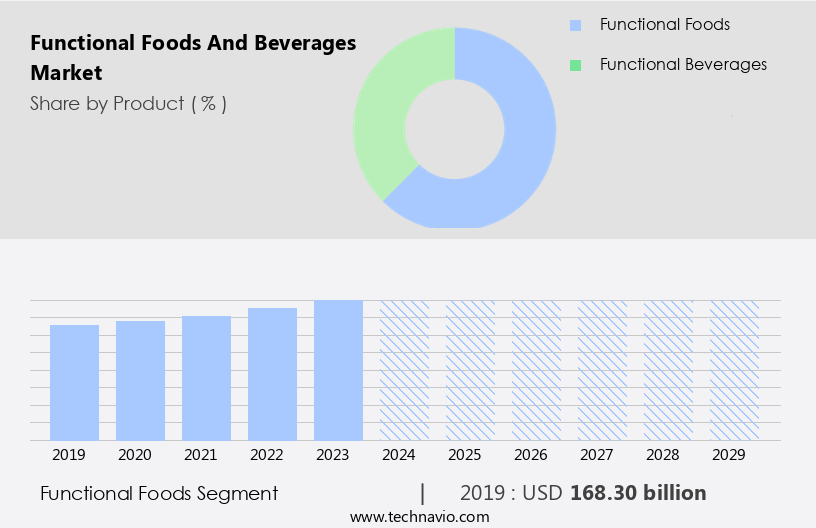
The Functional foods segment was valued at USD 168.30 billion in 2019 and showed a gradual increase during the forecast period.
Regional Analysis
APAC is estimated to contribute 32% to the growth of the global market during the forecast period.Technavio's analysts have elaborately explained the regional trends and drivers that shape the market during the forecast period.
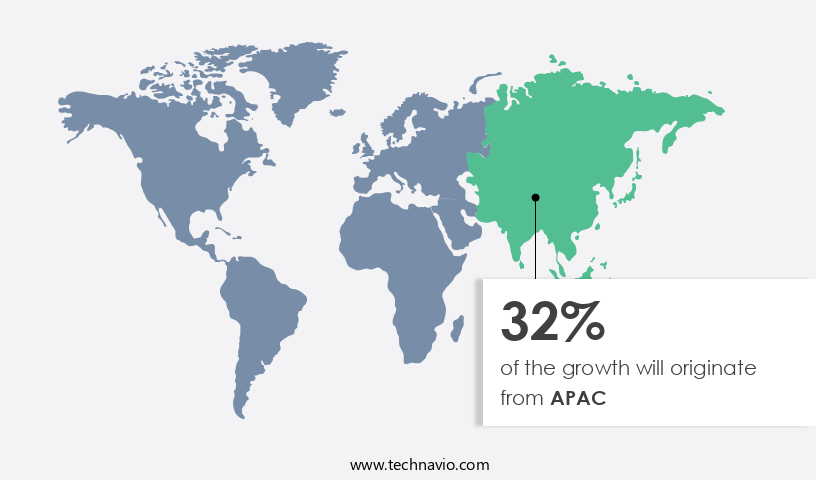
The market in Asia Pacific (APAC) is experiencing significant growth due to increasing consumer demand for healthier options and improving living standards. Product differentiation through clean labels and innovative ingredient sourcing is a key trend, with a focus on plant-based proteins, nutrient density, and sustainable practices. Product labeling transparency and regulatory compliance are essential for brand reputation and consumer trust. Subscription models and personalized nutrition are emerging business models, catering to individual health needs. Functional foods, including those for sports nutrition, immune support, and gut health, are popular. Packaging technology plays a crucial role in extending shelf life and ensuring food safety.
Vitamins and minerals, botanical extracts, and antioxidant supplements are common ingredients, while emerging technologies like precision fermentation and synthetic biology are gaining traction. Pricing strategies and quality control are essential for market success. Clinical studies and consumer education are crucial for health claims and consumer preferences. The market's dynamics are shaped by factors like cardiovascular health, cognitive function, fiber supplements, and weight management. Regulatory bodies and ethical sourcing are critical for market growth and consumer trust.
Market Dynamics
Our researchers analyzed the data with 2024 as the base year, along with the key drivers, trends, and challenges. A holistic analysis of drivers will help companies refine their marketing strategies to gain a competitive advantage.
What are the key market drivers leading to the rise in the adoption of Functional Foods And Beverages Industry?
- Product innovations serve as the primary catalyst for market growth and development.
- Functional foods and beverages continue to gain popularity in the global market due to their health benefits. Clinical studies have shown that these products can improve various aspects of health, such as gut health, digestive health, cognitive function, and weight management. Manufacturers are responding to these consumer demands by introducing new flavors and formulations. For instance, Suntory, a UK-based company, launched Tropical Fusion, a new variant of reduced-sugar lemonade, in 2015. This product is a blend of pineapple and kiwifruit and caters to the growing preference for tropical flavors. Ethical sourcing is also a priority for many brands, ensuring that the ingredients used are sustainably sourced and of high quality.
- Personalized nutrition is another trend, with some manufacturers offering customized formulations based on individual health needs. Functional beverages, including fiber supplements, are particularly popular for their digestive health benefits. Overall, the market is expected to continue its growth trajectory, driven by consumer demand for healthier options and innovative product offerings.
What are the market trends shaping the Functional Foods And Beverages Industry?
- The growing recognition of functional foods and beverages for their health advantages is a notable market trend. This trend signifies a significant shift towards consuming products that offer additional health benefits beyond basic nutrition.
- The market is experiencing significant growth due to increasing consumer awareness and preferences for healthier options. These products, which offer additional health benefits beyond basic nutrition, are gaining popularity for their ability to reduce the risk of chronic diseases. For instance, oats are a natural source of beta-glucan, which helps lower bad cholesterol levels. Other functional foods include tea, rich in catechins, and yogurt, which provides calcium and probiotics. Superfruits, such as cranberries, grapes, pomegranate, tomatoes, and chocolate, are also popular for their antioxidant, carotenoid, and flavonoid content. Precision fermentation and synthetic biology are also driving innovation in the market, enabling the production of scientifically backed functional ingredients.
- Consumer education plays a crucial role in the market's growth, with marketing campaigns highlighting the health benefits of these foods and beverages. Omega-3 fatty acids, for cardiovascular health, and botanical extracts are other key functional ingredients in demand. Ingredient sourcing and ensuring their authenticity are essential considerations for manufacturers to meet consumer expectations.
What challenges does the Functional Foods And Beverages Industry face during its growth?
- Product ingredient labeling poses a significant challenge to the industry's growth due to its regulatory complexity and consumer demand for transparency.
- Functional foods and beverages have gained significant attention in the health and wellness industry due to their claimed health benefits. However, skepticism regarding their efficiency can hinder market growth. Extensive research is being conducted to validate the effectiveness of these products and assess potential health risks. For instance, a study published in the European Journal of Clinical Nutrition found that regular consumption of antioxidant supplements may help reduce the risk of chronic diseases. On the other hand, a study presented at the World Diabetes Congress in 2015 revealed that excessive consumption of energy drinks can impair oral glucose tolerance in adolescents.
- Moreover, some ingredients in popular energy drinks have been shown to have side effects and contain higher than recommended amounts of potentially harmful chemicals. These findings underscore the importance of rigorous research to ensure the safety and efficacy of functional foods and beverages.
Exclusive Customer Landscape
The functional foods and beverages market forecasting report includes the adoption lifecycle of the market, covering from the innovator's stage to the laggard's stage. It focuses on adoption rates in different regions based on penetration. Furthermore, the functional foods and beverages market report also includes key purchase criteria and drivers of price sensitivity to help companies evaluate and develop their market growth analysis strategies.
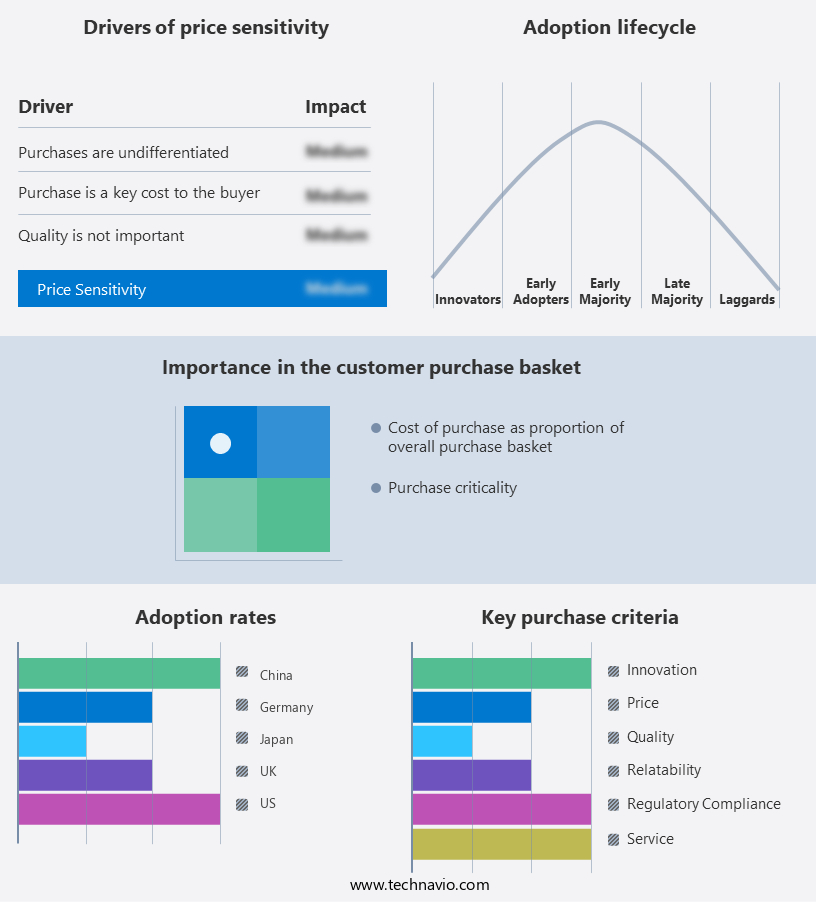
Customer Landscape
Key Companies & Market Insights
Companies are implementing various strategies, such as strategic alliances, functional foods and beverages market forecast, partnerships, mergers and acquisitions, geographical expansion, and product/service launches, to enhance their presence in the industry.
The industry research and growth report includes detailed analyses of the competitive landscape of the market and information about key companies, including:
- Abbott Laboratories
- Arla Foods amba
- Cargill, Incorporated
- The Coca-Cola Company
- Danone S.A.
- FrieslandCampina N.V.
- General Mills Inc.
- Glanbia plc
- The Hain Celestial Group Inc.
- Kellanova
- Keurig Dr Pepper Inc.
- Kraft Heinz Company
- Monster Beverage Corporation
- Nestlé S.A.
- PepsiCo Inc.
- Raisio plc
- Red Bull GmbH
- Suntory Holdings Limited
- Tyson Foods, Inc.
- Unilever PLC
Qualitative and quantitative analysis of companies has been conducted to help clients understand the wider business environment as well as the strengths and weaknesses of key industry players. Data is qualitatively analyzed to categorize companies as pure play, category-focused, industry-focused, and diversified; it is quantitatively analyzed to categorize companies as dominant, leading, strong, tentative, and weak.
Recent Development and News in Functional Foods And Beverages Market
- In March 2024, Danone, a leading player in the market, announced the launch of a new line of plant-based probiotic drinks, "Next," in the United States. This expansion aims to cater to the growing demand for plant-based alternatives and functional beverages (Danone Press Release, 2024).
- In July 2024, Nestle and Starbucks entered into a strategic partnership to co-create, manufacture, and distribute Starbucks' ready-to-drink beverages globally. This collaboration will enable Nestle to expand its portfolio and Starbucks to reach a broader consumer base (Nestle Press Release, 2024).
- In January 2025, PepsiCo completed the acquisition of SodaStream, a leading company in the at-home beverage carbonation systems market. This acquisition will allow PepsiCo to offer personalized, functional beverages to consumers and expand its product offerings beyond traditional bottled beverages (PepsiCo Press Release, 2025).
- In March 2025, the European Commission approved the use of a new health claim for probiotics in functional foods and beverages. This approval will boost the growth of the European the market by enabling companies to market their products with enhanced health benefits (European Commission Press Release, 2025).
Research Analyst Overview
- The market is experiencing dynamic shifts as consumers prioritize health and wellness. Product development in this sector is driven by various factors, including microbiome testing, food allergies, and lifestyle choices such as plant-based diets, sports and energy drinks, and intermittent fasting. Ingredient standardization is a key trend, with companies focusing on fortified foods and dietary supplements catering to chronic diseases and dietary guidelines. Digital marketing strategies, including influencer marketing and social media, are increasingly important for reaching consumers. Emerging market trends include genetic testing, personalized nutrition plans, and the growing popularity of vegan products.
- Food safety regulations continue to shape market dynamics, while consumer insights into food sensitivities and allergies influence product offerings. Market research data indicates a strong demand for dairy-free and gluten-free foods, as well as ketogenic and paleo diets. Overall, the health & wellness industry's innovation and adaptability are shaping the market.
Dive into Technavio's robust research methodology, blending expert interviews, extensive data synthesis, and validated models for unparalleled Functional Foods And Beverages Market insights. See full methodology.
|
Market Scope |
|
|
Report Coverage |
Details |
|
Page number |
255 |
|
Base year |
2024 |
|
Historic period |
2019-2023 |
|
Forecast period |
2025-2029 |
|
Growth momentum & CAGR |
Accelerate at a CAGR of 7.8% |
|
Market growth 2025-2029 |
USD 158.7 billion |
|
Market structure |
Fragmented |
|
YoY growth 2024-2025(%) |
7.1 |
|
Key countries |
US, Japan, China, UK, India, Canada, Germany, France, Brazil, and Italy |
|
Competitive landscape |
Leading Companies, Market Positioning of Companies, Competitive Strategies, and Industry Risks |
What are the Key Data Covered in this Functional Foods And Beverages Market Research and Growth Report?
- CAGR of the Functional Foods And Beverages industry during the forecast period
- Detailed information on factors that will drive the growth and forecasting between 2025 and 2029
- Precise estimation of the size of the market and its contribution of the industry in focus to the parent market
- Accurate predictions about upcoming growth and trends and changes in consumer behaviour
- Growth of the market across APAC, North America, Europe, Middle East and Africa, and South America
- Thorough analysis of the market's competitive landscape and detailed information about companies
- Comprehensive analysis of factors that will challenge the functional foods and beverages market growth of industry companies
We can help! Our analysts can customize this functional foods and beverages market research report to meet your requirements.
 RIA -
RIA - 
