Functional Mushroom Market Analysis, Size, and Forecast 2026-2030: North America (US, Canada, and Mexico), Europe (Germany, UK, and France), APAC (China, Japan, and India), South America (Brazil, Argentina, and Colombia), Middle East and Africa (UAE, Saudi Arabia, and South Africa), and Rest of World (ROW)

Functional Mushroom Market Analysis, Size, and Forecast 2026-2030:
North America (US, Canada, and Mexico), Europe (Germany, UK, and France), APAC (China, Japan, and India), South America (Brazil, Argentina, and Colombia), Middle East and Africa (UAE, Saudi Arabia, and South Africa), and Rest of World (ROW)

Published: Mar 2026 285 Pages SKU: IRTNTR77802

Market Overview at a Glance

$23.29 B
Market Opportunity
10.3%
CAGR 2025 - 2030
47.8%
North America Growth
$16.06 B
Food and beverage segment 2024

Functional Mushroom Market Size 2026-2030

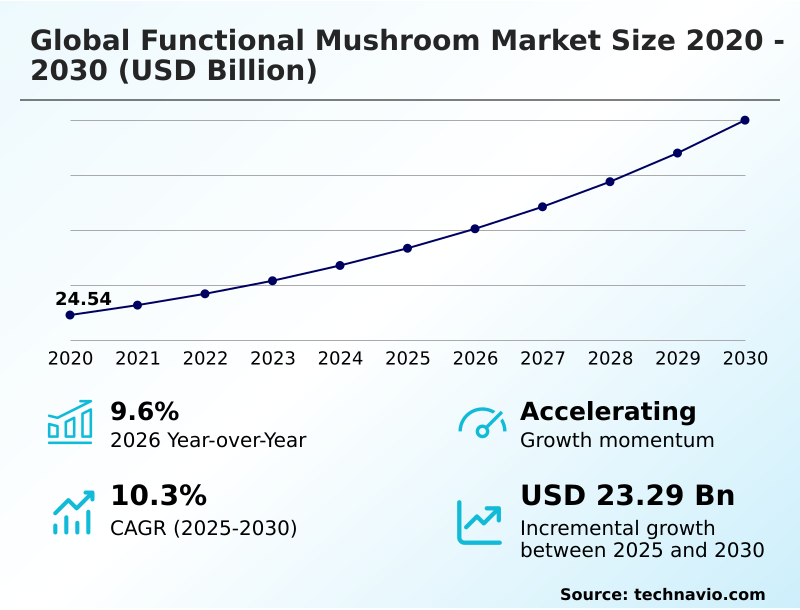
The functional mushroom market size is valued to increase by USD 23.29 billion, at a CAGR of 10.3% from 2025 to 2030. Increasing consumer demand for immune resilience and nootropic benefits will drive the functional mushroom market.

Major Market Trends & Insights

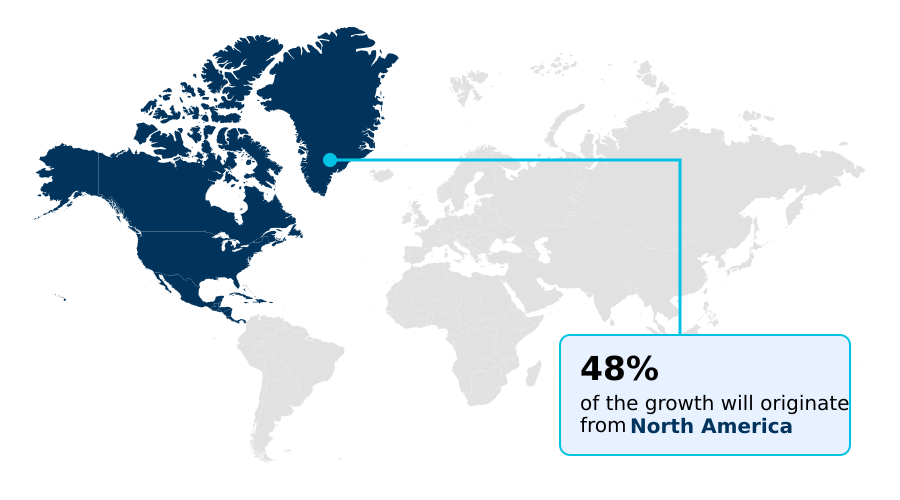
  • North America dominated the market and accounted for a 47.8% growth during the forecast period.
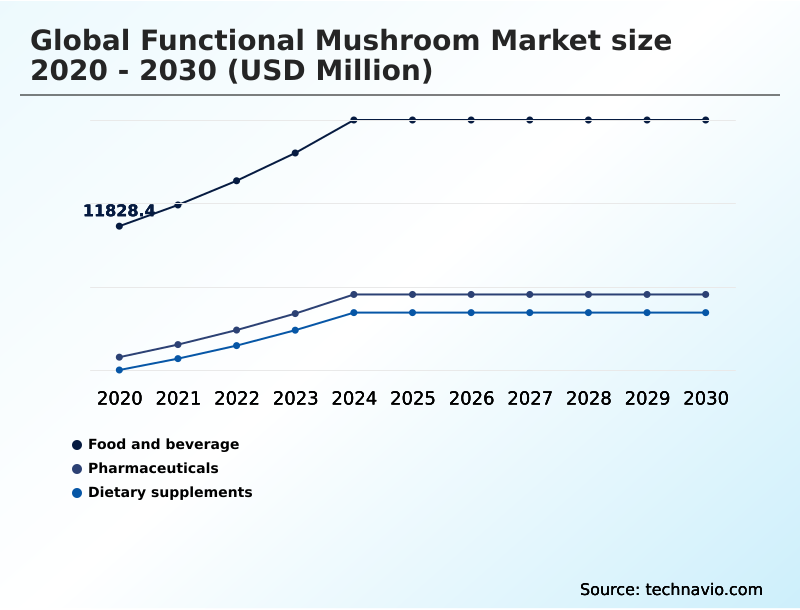
  • By Application - Food and beverage segment was valued at USD 16.06 billion in 2024
  • By Distribution Channel - Offline segment accounted for the largest market revenue share in 2024

Market Size & Forecast

  • Market Opportunities: USD 35.44 billion
  • Market Future Opportunities: USD 23.29 billion
  • CAGR from 2025 to 2030 : 10.3%

Market Summary

  • The functional mushroom market is rapidly expanding, driven by a consumer shift toward preventative health and natural wellness solutions. Demand for adaptogenic fungi benefits is centered on ingredients offering tangible nootropic effects and immune support. This has spurred advancements in mycelium cultivation and the development of potent fruiting body extracts.
  • Enterprises are adopting controlled environment agriculture and refined substrate formulation to produce high-quality raw materials with consistent beta-glucan content and bioavailability enhancement. A key operational scenario involves supply chain optimization, where maintaining the integrity of sensitive bioactive compounds and ergothioneine levels from farm to finished product requires specialized handling, impacting costs and scalability.
  • Businesses are investing heavily in third-party lab testing and organic mushroom certification to build consumer trust. The market is also defined by innovation in delivery formats, such as mushroom gummy supplements and mushroom-infused beverages, which are proving more effective at penetrating mainstream retail channels than traditional vegan mushroom capsules.

What will be the Size of the Functional Mushroom Market during the forecast period?

Get Key Insights on Market Forecast (PDF) Request Free Sample

How is the Functional Mushroom Market Segmented?

The functional mushroom industry research report provides comprehensive data (region-wise segment analysis), with forecasts and estimates in "USD million" for the period 2026-2030, as well as historical data from 2020-2024 for the following segments.

  • Application
    • Food and beverage
    • Pharmaceuticals
    • Dietary supplements
  • Distribution channel
    • Offline
    • Online
  • Product type
    • Reishi
    • Lions Mane
    • Cordyceps
    • Shiitake
  • Geography
    • North America
      • US
      • Canada
      • Mexico
    • Europe
      • Germany
      • UK
      • France
    • APAC
      • China
      • Japan
      • India
    • South America
      • Brazil
      • Argentina
      • Colombia
    • Middle East and Africa
      • UAE
      • Saudi Arabia
      • South Africa
    • Rest of World (ROW)

By Application Insights

The food and beverage segment is estimated to witness significant growth during the forecast period.

The food and beverage segment is evolving as consumers integrate functional mushroom supplements into daily routines. This shift is driven by the demand for products delivering adaptogenic fungi benefits, particularly for immune support fungi and cognitive enhancement mushrooms.

Innovations in processing now allow for the seamless inclusion of fruiting body extracts and their bioactive compounds into consumable items. The focus on verifying high beta-glucan content is critical for brand trust.

Products with strong adaptogenic properties are moving from niche health stores to mainstream grocery, a trend accelerated by improved mycelium cultivation techniques that ensure a consistent supply.

Formulations in this segment now deliver these benefits without compromising taste, with ready-to-drink formats showing 20% higher adoption rates among new users.

Request Free Sample

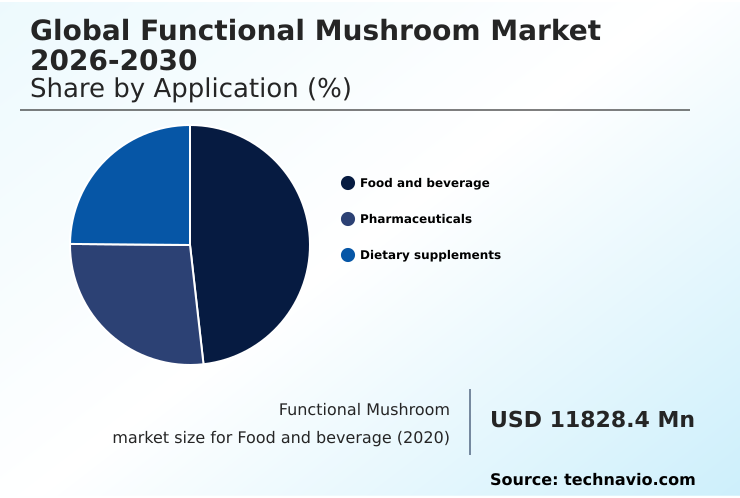
The Food and beverage segment was valued at USD 16.06 billion in 2024 and showed a gradual increase during the forecast period.

Request Free Sample

Regional Analysis

North America is estimated to contribute 47.8% to the growth of the global market during the forecast period.Technavio’s analysts have elaborately explained the regional trends and drivers that shape the market during the forecast period.

See How Functional Mushroom Market Demand is Rising in North America Request Free Sample

North America is the dominant region, accounting for over 47% of the market's incremental growth, driven by high consumer health consciousness. The regional landscape benefits from advanced bioavailability enhancement techniques and sophisticated R&D in myco-synthesis.

Firms in this region have successfully scaled production through optimized substrate formulation and controlled spore germination, leading to the development of potent superfood mushroom blends and nootropic mushroom stacks.

The preference for non-gmo mushroom products is strong, with consumer trust being built through transparent sourcing. The adoption of mushroom tincture benefits is growing, with sales increasing 25% year-over-year in specialized wellness retailers.

This strong performance, supported by innovations in mycoremediation for sustainable cultivation, solidifies North America's leadership position.
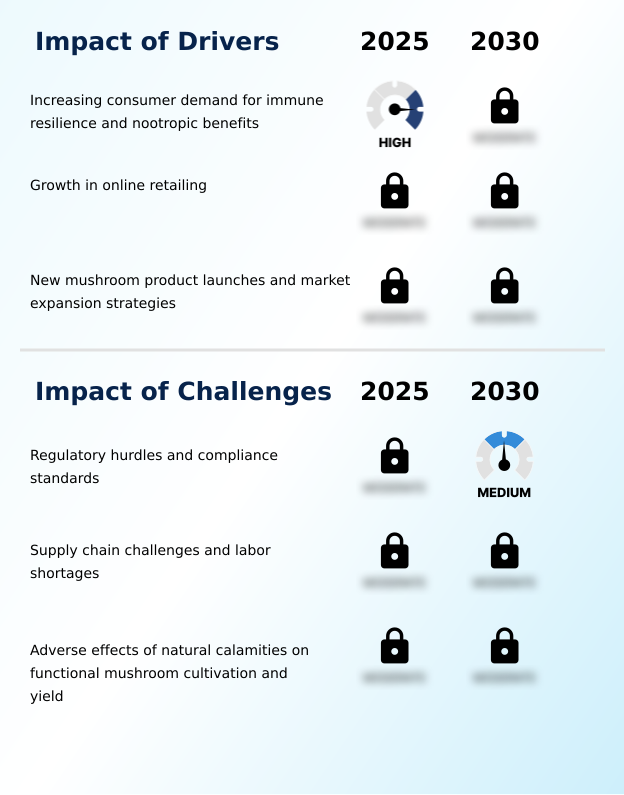
Market Dynamics

Our researchers analyzed the data with 2025 as the base year, along with the key drivers, trends, and challenges. A holistic analysis of drivers will help companies refine their marketing strategies to gain a competitive advantage.

  • The strategic landscape of the functional mushroom market is increasingly influenced by direct consumer queries and the need for educational marketing. Businesses that effectively address questions like the best functional mushroom for anxiety relief are building stronger brand loyalty. Similarly, providing clear guidance on how to properly use lion's mane powder helps demystify products and encourages routine use.
  • This educational approach is vital as consumers weigh the differences between reishi vs cordyceps for sustainable energy, seeking specific outcomes rather than generic wellness claims. The growing interest in the health benefits of mushroom coffee blends is pushing companies to innovate beyond traditional supplements and into daily-use functional foods.
  • A critical factor for success is ensuring product integrity, as an increasing number of consumers are specifically searching for lab-tested functional mushroom products safety assurances. Firms that prioritize this transparency see an average of 30% higher engagement on their digital platforms compared to those that do not, directly impacting brand reputation and purchasing decisions.
  • This shift requires a content-driven strategy that addresses nuanced user needs, builds trust, and clearly communicates the value proposition of specialized formulations in a competitive environment.

What are the key market drivers leading to the rise in the adoption of Functional Mushroom Industry?

  • Growing consumer demand for natural products that enhance immune resilience and provide nootropic benefits is the primary driver of market expansion.

  • Heightened consumer demand for transparent and scientifically validated wellness products is a primary market driver. The pursuit of organic mushroom certification is now a baseline expectation, with certified products seeing 30% greater trust from consumers.
  • There is a growing preference for full-spectrum mushroom ingredients that provide a complete range of benefits, driven by an understanding of chaga antioxidant properties and turkey tail for immunity.
  • The market is also propelled by format innovation, particularly the rise of mushroom-infused beverages and culinary functional mushrooms, which make daily consumption easier.
  • To ensure efficacy, companies are investing in standardized extracts that guarantee consistent levels of active compounds like hericenones and erinacines and ergothioneine levels.
  • This commitment to quality has led to a 10% reduction in product returns for brands that provide clear documentation.

What are the market trends shaping the Functional Mushroom Industry?

  • Market adoption is accelerating through the mainstreaming of functional mushrooms in innovative delivery formats. This culinary integration moves beyond supplements to embed functional benefits into daily consumer lifestyles.

  • A dominant market trend is the mainstreaming of functional mushrooms through accessible formats that cater to modern lifestyles. The demand for convenient solutions with clear nootropic effects is driving the popularity of mushroom coffee alternatives, which have seen a 25% growth in recurring subscriptions.
  • Innovations in hot water extraction and dual extraction process techniques are improving the taste and solubility of extracts, making them easier to integrate into beverages. As consumers seek natural ways to manage daily pressures, products featuring reishi mushroom for stress are becoming staples.
  • Formulations leveraging lion's mane for focus are also expanding, particularly in ready-to-drink formats where brands report 15% higher initial purchase rates compared to powders. This shift toward functional indulgence is supported by a focus on verifying polysaccharide concentration and triterpene profiles.

What challenges does the Functional Mushroom Industry face during its growth?

  • Navigating fragmented regulatory hurdles and divergent international compliance standards presents a significant challenge to market growth and global commercialization.

  • A significant market challenge is navigating the complex regulatory landscape while scaling production to meet demand. The need for rigorous third-party lab testing to verify the absence of contaminants and confirm the cordycepin concentration in cordyceps products adds significant operational cost, impacting smaller players by up to 15%.
  • Furthermore, extensive mycological research is required to substantiate health claims for compounds like ganoderic acids without violating advertising standards. The high capital investment needed for controlled environment agriculture presents another hurdle. As the market for mushroom gummy supplements and mushroom powder for smoothies grows, ensuring consistency across large batches of organic mushroom extracts becomes paramount.
  • This has led to a 20% increase in spending on quality control measures for companies offering popular formats like vegan mushroom capsules.

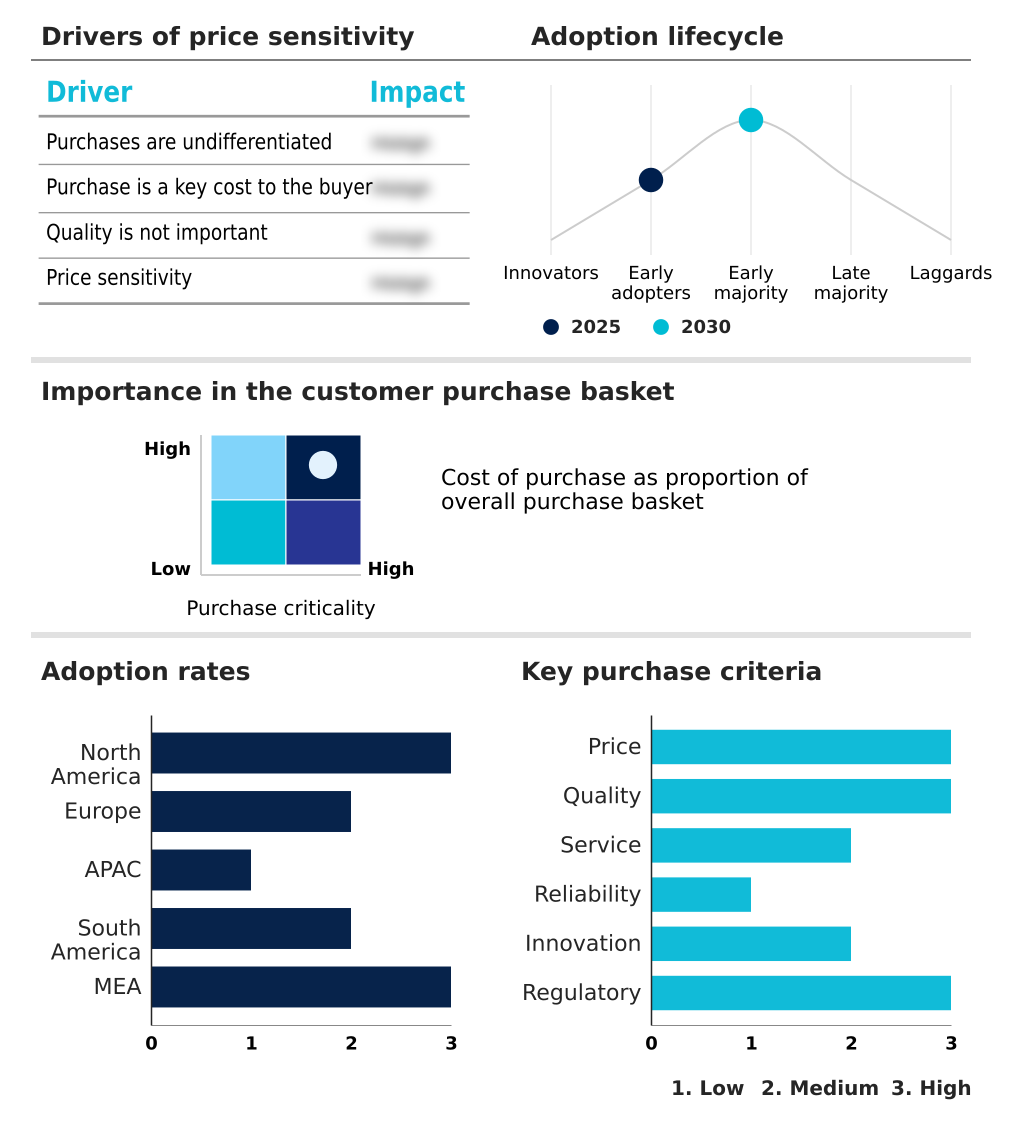
Exclusive Technavio Analysis on Customer Landscape

The functional mushroom market forecasting report includes the adoption lifecycle of the market, covering from the innovator’s stage to the laggard’s stage. It focuses on adoption rates in different regions based on penetration. Furthermore, the functional mushroom market report also includes key purchase criteria and drivers of price sensitivity to help companies evaluate and develop their market growth analysis strategies.

Customer Landscape of Functional Mushroom Industry

Competitive Landscape

Companies are implementing various strategies, such as strategic alliances, functional mushroom market forecast, partnerships, mergers and acquisitions, geographical expansion, and product/service launches, to enhance their presence in the industry.

Dirtea Ltd. - Delivers pure mushroom powders and dual-extract tea blends, focusing on high-purity adaptogenic ingredients for the global wellness consumer.

The industry research and growth report includes detailed analyses of the competitive landscape of the market and information about key companies, including:

  • Dirtea Ltd.
  • Four Sigmatic Foods Inc.
  • FreshCap Mushrooms Ltd.
  • Fungi Perfecti LLC
  • Gaia Herbs Inc.
  • Life Extension Foundation
  • Mud Wtr Inc.
  • Mushroom Wisdom Inc.
  • Nammex
  • Natures Way Brands LLC
  • NOW Health Group Inc.
  • Odyssey Elixir
  • Om Mushroom Superfood
  • Pure Encapsulations LLC
  • Real Mushrooms
  • Solaray Inc.
  • Sun Potion Foods
  • Terrasoul Superfoods
  • Troop
  • VidaCap

Qualitative and quantitative analysis of companies has been conducted to help clients understand the wider business environment as well as the strengths and weaknesses of key industry players. Data is qualitatively analyzed to categorize companies as pure play, category-focused, industry-focused, and diversified; it is quantitatively analyzed to categorize companies as dominant, leading, strong, tentative, and weak.

Recent Development and News in Functional mushroom market

  • In September, 2024, Applied Food Sciences announced the expansion of its strategic partnership with KAAPA Biotech through the opening of a new mushroom cultivation facility in Finland to supply premium, Nordic-grown extracts.
  • In October, 2024, Highline Mushrooms partnered with Christiaens Group to develop a state-of-the-art organic mushroom facility in Leamington, Ontario, featuring advanced automation and data-driven systems.
  • In February, 2025, M2 Ingredients announced its 155,000-square-foot production plant became fully operational to scale cultivation of ten distinct organic functional mushroom species, including turkey tail and cordyceps.
  • In February, 2025, European Food Safety Authority issued updated guidance on the evaluation of novel foods, establishing clearer but more stringent data requirements for marketing mushroom-based products in the region.

Dive into Technavio’s robust research methodology, blending expert interviews, extensive data synthesis, and validated models for unparalleled Functional Mushroom Market insights. See full methodology.

Market Scope
Page number 285
Base year 2025
Historic period 2020-2024
Forecast period 2026-2030
Growth momentum & CAGR Accelerate at a CAGR of 10.3%
Market growth 2026-2030 USD 23291.7 million
Market structure Fragmented
YoY growth 2025-2026(%) 9.6%
Key countries US, Canada, Mexico, Germany, UK, France, Italy, Spain, The Netherlands, China, Japan, India, South Korea, Australia, Indonesia, Brazil, Argentina, Colombia, UAE, Saudi Arabia, South Africa, Israel and Turkey
Competitive landscape Leading Companies, Market Positioning of Companies, Competitive Strategies, and Industry Risks

Request Free Sample

Research Analyst Overview

  • The functional mushroom market's maturation is contingent on scientific validation and supply chain integrity. Boardroom decisions now prioritize mycological research to substantiate the nootropic effects and adaptogenic properties of their products. Key to this is the shift from basic mycelium cultivation to advanced controlled environment agriculture, which optimizes substrate formulation for higher yields of bioactive compounds.
  • Leading firms focus on full-spectrum mushroom ingredients derived from fruiting body extracts, ensuring high beta-glucan content and rich triterpene profiles. Innovations in hot water extraction and dual extraction process technology have resulted in a 20% improvement in bioavailability enhancement for compounds like ganoderic acids and cordycepin concentration.
  • Securing organic mushroom certification and implementing rigorous third-party lab testing are no longer optional but essential for market access. The emphasis is on standardized extracts with consistent polysaccharide concentration and verified levels of hericenones and erinacines and ergothioneine levels. This scientific rigor, from spore germination to myco-synthesis and mycoremediation for sustainability, defines the competitive landscape.

What are the Key Data Covered in this Functional Mushroom Market Research and Growth Report?

  • What is the expected growth of the Functional Mushroom Market between 2026 and 2030?

    • USD 23.29 billion, at a CAGR of 10.3%

  • What segmentation does the market report cover?

    • The report is segmented by Application (Food and beverage, Pharmaceuticals, and Dietary supplements), Distribution Channel (Offline, and Online), Product Type (Reishi, Lions Mane, Cordyceps, and Shiitake) and Geography (North America, Europe, APAC, South America, Middle East and Africa)

  • Which regions are analyzed in the report?

    • North America, Europe, APAC, South America and Middle East and Africa

  • What are the key growth drivers and market challenges?

    • Increasing consumer demand for immune resilience and nootropic benefits, Regulatory hurdles and compliance standards

  • Who are the major players in the Functional Mushroom Market?

    • Dirtea Ltd., Four Sigmatic Foods Inc., FreshCap Mushrooms Ltd., Fungi Perfecti LLC, Gaia Herbs Inc., Life Extension Foundation, Mud Wtr Inc., Mushroom Wisdom Inc., Nammex, Natures Way Brands LLC, NOW Health Group Inc., Odyssey Elixir, Om Mushroom Superfood, Pure Encapsulations LLC, Real Mushrooms, Solaray Inc., Sun Potion Foods, Terrasoul Superfoods, Troop and VidaCap

Market Research Insights

  • Market dynamics are shaped by the rising popularity of functional mushroom supplements and adaptogenic fungi benefits. The integration of mushroom coffee alternatives into morning routines has seen a 30% increase in adoption over the last two years, outpacing other wellness beverages. Demand for specific outcomes like lion's mane for focus and reishi mushroom for stress is driving product development.
  • As a result, firms focusing on mushroom-infused beverages and mushroom gummy supplements are achieving 15% higher customer retention rates compared to those selling only bulk powders. The appeal of immune support fungi and cognitive enhancement mushrooms continues to push brands toward creating convenient, high-efficacy superfood mushroom blends and non-gmo mushroom products to meet discerning consumer expectations.

We can help! Our analysts can customize this functional mushroom market research report to meet your requirements.

Get in touch

1. Executive Summary

1.1 Market overview

Executive Summary - Chart on Market Overview
Executive Summary - Data Table on Market Overview
Executive Summary - Chart on Global Market Characteristics
Executive Summary - Chart on Market by Geography
Executive Summary - Chart on Market Segmentation by Application
Executive Summary - Chart on Market Segmentation by Distribution Channel
Executive Summary - Chart on Market Segmentation by Product Type
Executive Summary - Chart on Incremental Growth
Executive Summary - Data Table on Incremental Growth
Executive Summary - Chart on Company Market Positioning

2. Technavio Analysis

2.1 Analysis of price sensitivity, lifecycle, customer purchase basket, adoption rates, and purchase criteria

2.2 Criticality of inputs and Factors of differentiation

Chart on Overview on criticality of inputs and factors of differentiation

2.3 Factors of disruption

Chart on Overview on factors of disruption

2.4 Impact of drivers and challenges

Chart on Impact of drivers and challenges in 2025 and 2030

3. Market Landscape

3.1 Market ecosystem

Chart on Parent Market
Data Table on - Parent Market

3.2 Market characteristics

Chart on Market characteristics analysis

3.3 Value chain analysis

Chart on Value chain analysis

4. Market Sizing

4.1 Market definition

Data Table on Offerings of companies included in the market definition

4.2 Market segment analysis

Market segments

4.3 Market size 2025

4.4 Market outlook: Forecast for 2025-2030

Chart on Global - Market size and forecast 2025-2030 ($ million)
Data Table on Global - Market size and forecast 2025-2030 ($ million)
Chart on Global Market: Year-over-year growth 2025-2030 (%)
Data Table on Global Market: Year-over-year growth 2025-2030 (%)

5. Historic Market Size

5.1 Global Functional Mushroom Market 2020 - 2024

Historic Market Size - Data Table on Global Functional Mushroom Market 2020 - 2024 ($ million)

5.2 Application segment analysis 2020 - 2024

Historic Market Size - Application Segment 2020 - 2024 ($ million)

5.3 Distribution Channel segment analysis 2020 - 2024

Historic Market Size - Distribution Channel Segment 2020 - 2024 ($ million)

5.4 Product Type segment analysis 2020 - 2024

Historic Market Size - Product Type Segment 2020 - 2024 ($ million)

5.5 Geography segment analysis 2020 - 2024

Historic Market Size - Geography Segment 2020 - 2024 ($ million)

5.6 Country segment analysis 2020 - 2024

Historic Market Size - Country Segment 2020 - 2024 ($ million)

6. Qualitative Analysis

6.1 Impact of AI in Global Functional Mushroom Market

7. Five Forces Analysis

7.1 Five forces summary

Five forces analysis - Comparison between 2025 and 2030

7.2 Bargaining power of buyers

Bargaining power of buyers - Impact of key factors 2025 and 2030

7.3 Bargaining power of suppliers

Bargaining power of suppliers - Impact of key factors in 2025 and 2030

7.4 Threat of new entrants

Threat of new entrants - Impact of key factors in 2025 and 2030

7.5 Threat of substitutes

Threat of substitutes - Impact of key factors in 2025 and 2030

7.6 Threat of rivalry

Threat of rivalry - Impact of key factors in 2025 and 2030

7.7 Market condition

Chart on Market condition - Five forces 2025 and 2030

8. Market Segmentation by Application

8.1 Market segments

Chart on Application - Market share 2025-2030 (%)
Data Table on Application - Market share 2025-2030 (%)

8.2 Comparison by Application

Chart on Comparison by Application
Data Table on Comparison by Application

8.3 Food and beverage - Market size and forecast 2025-2030

Chart on Food and beverage - Market size and forecast 2025-2030 ($ million)
Data Table on Food and beverage - Market size and forecast 2025-2030 ($ million)
Chart on Food and beverage - Year-over-year growth 2025-2030 (%)
Data Table on Food and beverage - Year-over-year growth 2025-2030 (%)

8.4 Pharmaceuticals - Market size and forecast 2025-2030

Chart on Pharmaceuticals - Market size and forecast 2025-2030 ($ million)
Data Table on Pharmaceuticals - Market size and forecast 2025-2030 ($ million)
Chart on Pharmaceuticals - Year-over-year growth 2025-2030 (%)
Data Table on Pharmaceuticals - Year-over-year growth 2025-2030 (%)

8.5 Dietary supplements - Market size and forecast 2025-2030

Chart on Dietary supplements - Market size and forecast 2025-2030 ($ million)
Data Table on Dietary supplements - Market size and forecast 2025-2030 ($ million)
Chart on Dietary supplements - Year-over-year growth 2025-2030 (%)
Data Table on Dietary supplements - Year-over-year growth 2025-2030 (%)

8.6 Market opportunity by Application

Market opportunity by Application ($ million)
Data Table on Market opportunity by Application ($ million)

9. Market Segmentation by Distribution Channel

9.1 Market segments

Chart on Distribution Channel - Market share 2025-2030 (%)
Data Table on Distribution Channel - Market share 2025-2030 (%)

9.2 Comparison by Distribution Channel

Chart on Comparison by Distribution Channel
Data Table on Comparison by Distribution Channel

9.3 Offline - Market size and forecast 2025-2030

Chart on Offline - Market size and forecast 2025-2030 ($ million)
Data Table on Offline - Market size and forecast 2025-2030 ($ million)
Chart on Offline - Year-over-year growth 2025-2030 (%)
Data Table on Offline - Year-over-year growth 2025-2030 (%)

9.4 Online - Market size and forecast 2025-2030

Chart on Online - Market size and forecast 2025-2030 ($ million)
Data Table on Online - Market size and forecast 2025-2030 ($ million)
Chart on Online - Year-over-year growth 2025-2030 (%)
Data Table on Online - Year-over-year growth 2025-2030 (%)

9.5 Market opportunity by Distribution Channel

Market opportunity by Distribution Channel ($ million)
Data Table on Market opportunity by Distribution Channel ($ million)

10. Market Segmentation by Product Type

10.1 Market segments

Chart on Product Type - Market share 2025-2030 (%)
Data Table on Product Type - Market share 2025-2030 (%)

10.2 Comparison by Product Type

Chart on Comparison by Product Type
Data Table on Comparison by Product Type

10.3 Reishi - Market size and forecast 2025-2030

Chart on Reishi - Market size and forecast 2025-2030 ($ million)
Data Table on Reishi - Market size and forecast 2025-2030 ($ million)
Chart on Reishi - Year-over-year growth 2025-2030 (%)
Data Table on Reishi - Year-over-year growth 2025-2030 (%)

10.4 Lions Mane - Market size and forecast 2025-2030

Chart on Lions Mane - Market size and forecast 2025-2030 ($ million)
Data Table on Lions Mane - Market size and forecast 2025-2030 ($ million)
Chart on Lions Mane - Year-over-year growth 2025-2030 (%)
Data Table on Lions Mane - Year-over-year growth 2025-2030 (%)

10.5 Cordyceps - Market size and forecast 2025-2030

Chart on Cordyceps - Market size and forecast 2025-2030 ($ million)
Data Table on Cordyceps - Market size and forecast 2025-2030 ($ million)
Chart on Cordyceps - Year-over-year growth 2025-2030 (%)
Data Table on Cordyceps - Year-over-year growth 2025-2030 (%)

10.6 Shiitake - Market size and forecast 2025-2030

Chart on Shiitake - Market size and forecast 2025-2030 ($ million)
Data Table on Shiitake - Market size and forecast 2025-2030 ($ million)
Chart on Shiitake - Year-over-year growth 2025-2030 (%)
Data Table on Shiitake - Year-over-year growth 2025-2030 (%)

10.7 Market opportunity by Product Type

Market opportunity by Product Type ($ million)
Data Table on Market opportunity by Product Type ($ million)

11. Customer Landscape

11.1 Customer landscape overview

Analysis of price sensitivity, lifecycle, customer purchase basket, adoption rates, and purchase criteria

12. Geographic Landscape

12.1 Geographic segmentation

Chart on Market share by geography 2025-2030 (%)
Data Table on Market share by geography 2025-2030 (%)

12.2 Geographic comparison

Chart on Geographic comparison
Data Table on Geographic comparison

12.3 North America - Market size and forecast 2025-2030

Chart on North America - Market size and forecast 2025-2030 ($ million)
Data Table on North America - Market size and forecast 2025-2030 ($ million)
Chart on North America - Year-over-year growth 2025-2030 (%)
Data Table on North America - Year-over-year growth 2025-2030 (%)
Chart on Regional Comparison - North America
Data Table on Regional Comparison - North America

12.3.1 US - Market size and forecast 2025-2030

Chart on US - Market size and forecast 2025-2030 ($ million)
Data Table on US - Market size and forecast 2025-2030 ($ million)
Chart on US - Year-over-year growth 2025-2030 (%)
Data Table on US - Year-over-year growth 2025-2030 (%)

12.3.2 Canada - Market size and forecast 2025-2030

Chart on Canada - Market size and forecast 2025-2030 ($ million)
Data Table on Canada - Market size and forecast 2025-2030 ($ million)
Chart on Canada - Year-over-year growth 2025-2030 (%)
Data Table on Canada - Year-over-year growth 2025-2030 (%)

12.3.3 Mexico - Market size and forecast 2025-2030

Chart on Mexico - Market size and forecast 2025-2030 ($ million)
Data Table on Mexico - Market size and forecast 2025-2030 ($ million)
Chart on Mexico - Year-over-year growth 2025-2030 (%)
Data Table on Mexico - Year-over-year growth 2025-2030 (%)

12.4 Europe - Market size and forecast 2025-2030

Chart on Europe - Market size and forecast 2025-2030 ($ million)
Data Table on Europe - Market size and forecast 2025-2030 ($ million)
Chart on Europe - Year-over-year growth 2025-2030 (%)
Data Table on Europe - Year-over-year growth 2025-2030 (%)
Chart on Regional Comparison - Europe
Data Table on Regional Comparison - Europe

12.4.1 Germany - Market size and forecast 2025-2030

Chart on Germany - Market size and forecast 2025-2030 ($ million)
Data Table on Germany - Market size and forecast 2025-2030 ($ million)
Chart on Germany - Year-over-year growth 2025-2030 (%)
Data Table on Germany - Year-over-year growth 2025-2030 (%)

12.4.2 UK - Market size and forecast 2025-2030

Chart on UK - Market size and forecast 2025-2030 ($ million)
Data Table on UK - Market size and forecast 2025-2030 ($ million)
Chart on UK - Year-over-year growth 2025-2030 (%)
Data Table on UK - Year-over-year growth 2025-2030 (%)

12.4.3 France - Market size and forecast 2025-2030

Chart on France - Market size and forecast 2025-2030 ($ million)
Data Table on France - Market size and forecast 2025-2030 ($ million)
Chart on France - Year-over-year growth 2025-2030 (%)
Data Table on France - Year-over-year growth 2025-2030 (%)

12.4.4 Italy - Market size and forecast 2025-2030

Chart on Italy - Market size and forecast 2025-2030 ($ million)
Data Table on Italy - Market size and forecast 2025-2030 ($ million)
Chart on Italy - Year-over-year growth 2025-2030 (%)
Data Table on Italy - Year-over-year growth 2025-2030 (%)

12.4.5 Spain - Market size and forecast 2025-2030

Chart on Spain - Market size and forecast 2025-2030 ($ million)
Data Table on Spain - Market size and forecast 2025-2030 ($ million)
Chart on Spain - Year-over-year growth 2025-2030 (%)
Data Table on Spain - Year-over-year growth 2025-2030 (%)

12.4.6 The Netherlands - Market size and forecast 2025-2030

Chart on The Netherlands - Market size and forecast 2025-2030 ($ million)
Data Table on The Netherlands - Market size and forecast 2025-2030 ($ million)
Chart on The Netherlands - Year-over-year growth 2025-2030 (%)
Data Table on The Netherlands - Year-over-year growth 2025-2030 (%)

12.5 APAC - Market size and forecast 2025-2030

Chart on APAC - Market size and forecast 2025-2030 ($ million)
Data Table on APAC - Market size and forecast 2025-2030 ($ million)
Chart on APAC - Year-over-year growth 2025-2030 (%)
Data Table on APAC - Year-over-year growth 2025-2030 (%)
Chart on Regional Comparison - APAC
Data Table on Regional Comparison - APAC

12.5.1 China - Market size and forecast 2025-2030

Chart on China - Market size and forecast 2025-2030 ($ million)
Data Table on China - Market size and forecast 2025-2030 ($ million)
Chart on China - Year-over-year growth 2025-2030 (%)
Data Table on China - Year-over-year growth 2025-2030 (%)

12.5.2 Japan - Market size and forecast 2025-2030

Chart on Japan - Market size and forecast 2025-2030 ($ million)
Data Table on Japan - Market size and forecast 2025-2030 ($ million)
Chart on Japan - Year-over-year growth 2025-2030 (%)
Data Table on Japan - Year-over-year growth 2025-2030 (%)

12.5.3 India - Market size and forecast 2025-2030

Chart on India - Market size and forecast 2025-2030 ($ million)
Data Table on India - Market size and forecast 2025-2030 ($ million)
Chart on India - Year-over-year growth 2025-2030 (%)
Data Table on India - Year-over-year growth 2025-2030 (%)

12.5.4 South Korea - Market size and forecast 2025-2030

Chart on South Korea - Market size and forecast 2025-2030 ($ million)
Data Table on South Korea - Market size and forecast 2025-2030 ($ million)
Chart on South Korea - Year-over-year growth 2025-2030 (%)
Data Table on South Korea - Year-over-year growth 2025-2030 (%)

12.5.5 Australia - Market size and forecast 2025-2030

Chart on Australia - Market size and forecast 2025-2030 ($ million)
Data Table on Australia - Market size and forecast 2025-2030 ($ million)
Chart on Australia - Year-over-year growth 2025-2030 (%)
Data Table on Australia - Year-over-year growth 2025-2030 (%)

12.5.6 Indonesia - Market size and forecast 2025-2030

Chart on Indonesia - Market size and forecast 2025-2030 ($ million)
Data Table on Indonesia - Market size and forecast 2025-2030 ($ million)
Chart on Indonesia - Year-over-year growth 2025-2030 (%)
Data Table on Indonesia - Year-over-year growth 2025-2030 (%)

12.6 South America - Market size and forecast 2025-2030

Chart on South America - Market size and forecast 2025-2030 ($ million)
Data Table on South America - Market size and forecast 2025-2030 ($ million)
Chart on South America - Year-over-year growth 2025-2030 (%)
Data Table on South America - Year-over-year growth 2025-2030 (%)
Chart on Regional Comparison - South America
Data Table on Regional Comparison - South America

12.6.1 Brazil - Market size and forecast 2025-2030

Chart on Brazil - Market size and forecast 2025-2030 ($ million)
Data Table on Brazil - Market size and forecast 2025-2030 ($ million)
Chart on Brazil - Year-over-year growth 2025-2030 (%)
Data Table on Brazil - Year-over-year growth 2025-2030 (%)

12.6.2 Argentina - Market size and forecast 2025-2030

Chart on Argentina - Market size and forecast 2025-2030 ($ million)
Data Table on Argentina - Market size and forecast 2025-2030 ($ million)
Chart on Argentina - Year-over-year growth 2025-2030 (%)
Data Table on Argentina - Year-over-year growth 2025-2030 (%)

12.6.3 Colombia - Market size and forecast 2025-2030

Chart on Colombia - Market size and forecast 2025-2030 ($ million)
Data Table on Colombia - Market size and forecast 2025-2030 ($ million)
Chart on Colombia - Year-over-year growth 2025-2030 (%)
Data Table on Colombia - Year-over-year growth 2025-2030 (%)

12.7 Middle East and Africa - Market size and forecast 2025-2030

Chart on Middle East and Africa - Market size and forecast 2025-2030 ($ million)
Data Table on Middle East and Africa - Market size and forecast 2025-2030 ($ million)
Chart on Middle East and Africa - Year-over-year growth 2025-2030 (%)
Data Table on Middle East and Africa - Year-over-year growth 2025-2030 (%)
Chart on Regional Comparison - Middle East and Africa
Data Table on Regional Comparison - Middle East and Africa

12.7.1 UAE - Market size and forecast 2025-2030

Chart on UAE - Market size and forecast 2025-2030 ($ million)
Data Table on UAE - Market size and forecast 2025-2030 ($ million)
Chart on UAE - Year-over-year growth 2025-2030 (%)
Data Table on UAE - Year-over-year growth 2025-2030 (%)

12.7.2 Saudi Arabia - Market size and forecast 2025-2030

Chart on Saudi Arabia - Market size and forecast 2025-2030 ($ million)
Data Table on Saudi Arabia - Market size and forecast 2025-2030 ($ million)
Chart on Saudi Arabia - Year-over-year growth 2025-2030 (%)
Data Table on Saudi Arabia - Year-over-year growth 2025-2030 (%)

12.7.3 South Africa - Market size and forecast 2025-2030

Chart on South Africa - Market size and forecast 2025-2030 ($ million)
Data Table on South Africa - Market size and forecast 2025-2030 ($ million)
Chart on South Africa - Year-over-year growth 2025-2030 (%)
Data Table on South Africa - Year-over-year growth 2025-2030 (%)

12.7.4 Israel - Market size and forecast 2025-2030

Chart on Israel - Market size and forecast 2025-2030 ($ million)
Data Table on Israel - Market size and forecast 2025-2030 ($ million)
Chart on Israel - Year-over-year growth 2025-2030 (%)
Data Table on Israel - Year-over-year growth 2025-2030 (%)

12.7.5 Turkey - Market size and forecast 2025-2030

Chart on Turkey - Market size and forecast 2025-2030 ($ million)
Data Table on Turkey - Market size and forecast 2025-2030 ($ million)
Chart on Turkey - Year-over-year growth 2025-2030 (%)
Data Table on Turkey - Year-over-year growth 2025-2030 (%)

12.8 Market opportunity by geography

Market opportunity by geography ($ million)
Data Tables on Market opportunity by geography ($ million)

13. Drivers, Challenges, and Opportunity

13.1 Market drivers

Increasing consumer demand for immune resilience and nootropic benefits
Growth in online retailing
New mushroom product launches and market expansion strategies

13.2 Market challenges

Regulatory hurdles and compliance standards
Supply chain challenges and labor shortages
Adverse effects of natural calamities on functional mushroom cultivation and yield

13.3 Impact of drivers and challenges

Impact of drivers and challenges in 2025 and 2030

13.4 Market opportunities

Mainstreaming through innovative delivery formats and culinary integration
Growing health consciousness among consumers
Emergence of private-label brands

14. Competitive Landscape

14.1 Overview

14.2

Overview on criticality of inputs and factors of differentiation

14.3 Landscape disruption

Overview on factors of disruption

14.4 Industry risks

Impact of key risks on business

15. Competitive Analysis

15.1 Companies profiled

Companies covered

15.2 Company ranking index

15.3 Market positioning of companies

Matrix on companies position and classification

15.4 Dirtea Ltd.

Dirtea Ltd. - Overview
Dirtea Ltd. - Product / Service
Dirtea Ltd. - Key offerings
SWOT

15.5 Four Sigmatic Foods Inc.

Four Sigmatic Foods Inc. - Overview
Four Sigmatic Foods Inc. - Product / Service
Four Sigmatic Foods Inc. - Key offerings
SWOT

15.6 FreshCap Mushrooms Ltd.

FreshCap Mushrooms Ltd. - Overview
FreshCap Mushrooms Ltd. - Product / Service
FreshCap Mushrooms Ltd. - Key offerings
SWOT

15.7 Fungi Perfecti LLC

Fungi Perfecti LLC - Overview
Fungi Perfecti LLC - Product / Service
Fungi Perfecti LLC - Key offerings
SWOT

15.8 Gaia Herbs Inc.

Gaia Herbs Inc. - Overview
Gaia Herbs Inc. - Product / Service
Gaia Herbs Inc. - Key news
Gaia Herbs Inc. - Key offerings
SWOT

15.9 Mud Wtr Inc.

Mud Wtr Inc. - Overview
Mud Wtr Inc. - Product / Service
Mud Wtr Inc. - Key offerings
SWOT

15.10 Mushroom Wisdom Inc.

Mushroom Wisdom Inc. - Overview
Mushroom Wisdom Inc. - Product / Service
Mushroom Wisdom Inc. - Key offerings
SWOT

15.11 Nammex

Nammex - Overview
Nammex - Product / Service
Nammex - Key offerings
SWOT

15.12 Natures Way Brands LLC

Natures Way Brands LLC - Overview
Natures Way Brands LLC - Product / Service
Natures Way Brands LLC - Key offerings
SWOT

15.13 NOW Health Group Inc.

NOW Health Group Inc. - Overview
NOW Health Group Inc. - Product / Service
NOW Health Group Inc. - Key offerings
SWOT

15.14 Om Mushroom Superfood

Om Mushroom Superfood - Overview
Om Mushroom Superfood - Product / Service
Om Mushroom Superfood - Key offerings
SWOT

15.15 Real Mushrooms

Real Mushrooms - Overview
Real Mushrooms - Product / Service
Real Mushrooms - Key offerings
SWOT

15.16 Sun Potion Foods

Sun Potion Foods - Overview
Sun Potion Foods - Product / Service
Sun Potion Foods - Key offerings
SWOT

15.17 Terrasoul Superfoods

Terrasoul Superfoods - Overview
Terrasoul Superfoods - Product / Service
Terrasoul Superfoods - Key offerings
SWOT

15.18 VidaCap

VidaCap - Overview
VidaCap - Product / Service
VidaCap - Key offerings
SWOT

16. Appendix

16.1 Scope of the report

Market definition
Objectives
Notes and caveats

16.2 Inclusions and exclusions checklist

Inclusions checklist
Exclusions checklist

16.3 Currency conversion rates for US$

16.4 Research methodology

16.5 Data procurement

Information sources

16.6 Data validation

16.7 Validation techniques employed for market sizing

16.8 Data synthesis

16.9 360 degree market analysis

16.10 List of abbreviations

Research Methodology

Technavio presents a detailed picture of the market by way of study, synthesis, and summation of data from multiple sources. The analysts have presented the various facets of the market with a particular focus on identifying the key industry influencers. The data thus presented is comprehensive, reliable, and the result of extensive research, both primary and secondary.

INFORMATION SOURCES

Primary sources

  • Manufacturers and suppliers
  • Channel partners
  • Industry experts
  • Strategic decision makers

Secondary sources

  • Industry journals and periodicals
  • Government data
  • Financial reports of key industry players
  • Historical data
  • Press releases

DATA ANALYSIS

Data Synthesis

  • Collation of data
  • Estimation of key figures
  • Analysis of derived insights

Data Validation

  • Triangulation with data models
  • Reference against proprietary databases
  • Corroboration with industry experts

REPORT WRITING

Qualitative

  • Market drivers
  • Market challenges
  • Market trends
  • Five forces analysis

Quantitative

  • Market size and forecast
  • Market segmentation
  • Geographical insights
  • Competitive landscape

Interested in this report?

Get your sample now to see our research methodology and insights!

Download Now

Frequently Asked Questions

Functional Mushroom market growth will increase by USD 23291.7 million during 2026-2030.

The Functional Mushroom market is expected to grow at a CAGR of 10.3% during 2026-2030.

Functional Mushroom market is segmented by Application (Food and beverage, Pharmaceuticals, Dietary supplements) Distribution channel (Offline, Online) Product type (Reishi, Lions Mane, Cordyceps, Shiitake)

Dirtea Ltd., Four Sigmatic Foods Inc., FreshCap Mushrooms Ltd., Fungi Perfecti LLC, Gaia Herbs Inc., Life Extension Foundation, Mud Wtr Inc., Mushroom Wisdom Inc., Nammex, Natures Way Brands LLC, NOW Health Group Inc., Odyssey Elixir, Om Mushroom Superfood, Pure Encapsulations LLC, Real Mushrooms, Solaray Inc., Sun Potion Foods, Terrasoul Superfoods, Troop, VidaCap are a few of the key vendors in the Functional Mushroom market.

North America will register the highest growth rate of 47.8% among the other regions. Therefore, the Functional Mushroom market in North America is expected to garner significant business opportunities for the vendors during the forecast period.

US, Canada, Mexico, Germany, UK, France, Italy, Spain, The Netherlands, China, Japan, India, South Korea, Australia, Indonesia, Brazil, Argentina, Colombia, UAE, Saudi Arabia, South Africa, Israel, Turkey

  • Increasing consumer demand for immune resilience and nootropic benefits is the driving factor this market.

The Functional Mushroom market vendors should focus on grabbing business opportunities from the Application segment as it accounted for the largest market share in the base year.