Indonesia Furniture Market Size 2024-2028
The indonesia furniture market size is forecast to increase by USD 4 billion at a CAGR of 14.2% between 2023 and 2028.
What will be the size of the Indonesia Furniture Market during the forecast period?
How is this market segmented and which is the largest segment?
The market research report provides comprehensive data (region-wise segment analysis), with forecasts and estimates in "USD million" for the period 2024-2028, as well as historical data from 2018-2022 for the following segments.
- Type
- Residential
- Commercial
- Delivery Mode
- Offline
- Online
- Geography
- Indonesia
By Type Insights
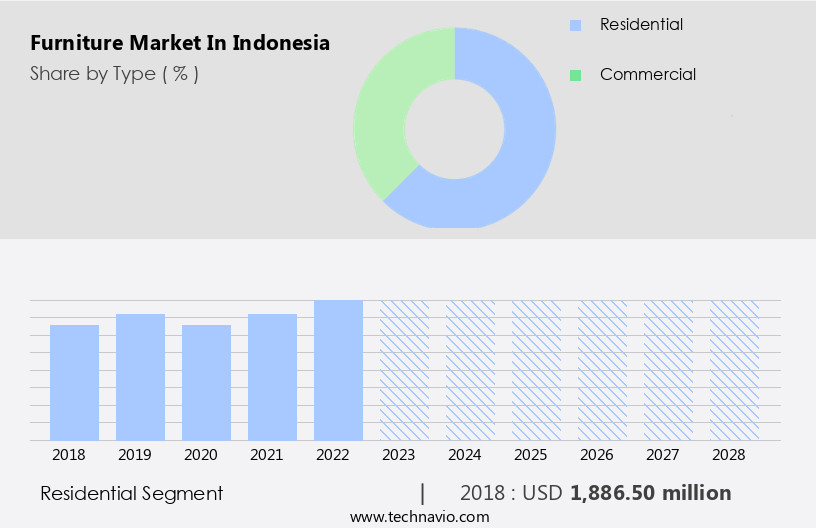
- The residential segment is estimated to witness significant growth during the forecast period.
The market encompasses a range of products including lounge chairs, benches, sofas, tables for dining and kitchen use, outdoor seating, and various chairs. This segment experiences growth due to the rising preference for multifunctional, space-saving residential furniture, particularly foldable beds and extendable sofa sets. The real estate sector's expansion in Indonesia, coupled with an increase in housing construction projects, fuels the demand for luxury residential furniture. In 2020, the Indonesian Ministry of Public Works and Housing announced subsidies for home loans for 175,000 low-income families, further boosting the residential furniture market. Commercial furniture, including office furniture, also experiences growth due to the increasing trend of remote work and flexible work arrangements.
Unique designs, sustainable materials like bamboo, recycled wood, and reclaimed wood, and technology integration through 3D printing, augmented reality (AR), and virtual reality (VR) are key trends in both residential and commercial furniture markets. Sustainable initiatives, such as the use of natural wood, processed wood, and composite materials like plywood, MDF, and particleboard, are gaining popularity. Styles and designs, stains, paints, and treatments cater to various residential and commercial settings, including institutional settings. The market incorporates ergonomic furniture, health and wellness considerations, and space utilization in interior design aesthetics. Key players offer compact, multifunctional furniture and space-saving products to cater to urban areas' infrastructural development.
The market also includes antimicrobial agents, environment-friendly furniture with non-toxic components, and FSC-certified wood.
Get a glance at the market share of various segments Request Free Sample
The Residential segment was valued at USD 1886.50 million in 2018 and showed a gradual increase during the forecast period.
Market Dynamics
Our researchers analyzed the data with 2023 as the base year, along with the key drivers, trends, and challenges. A holistic analysis of drivers will help companies refine their marketing strategies to gain a competitive advantage.
What are the key market drivers leading to the rise in adoption of Indonesia Furniture Market?
Rapid growth in urbanization is the key driver of the market.
What are the market trends shaping the Indonesia Furniture Market?
Rising emphasis on eco-friendly furniture is the upcoming trend In the market.
What challenges does Indonesia Furniture Market face during the growth?
Unstable prices of raw materials of furniture is a key challenge affecting the market growth.
Exclusive Indonesia Furniture Market Customer Landscape
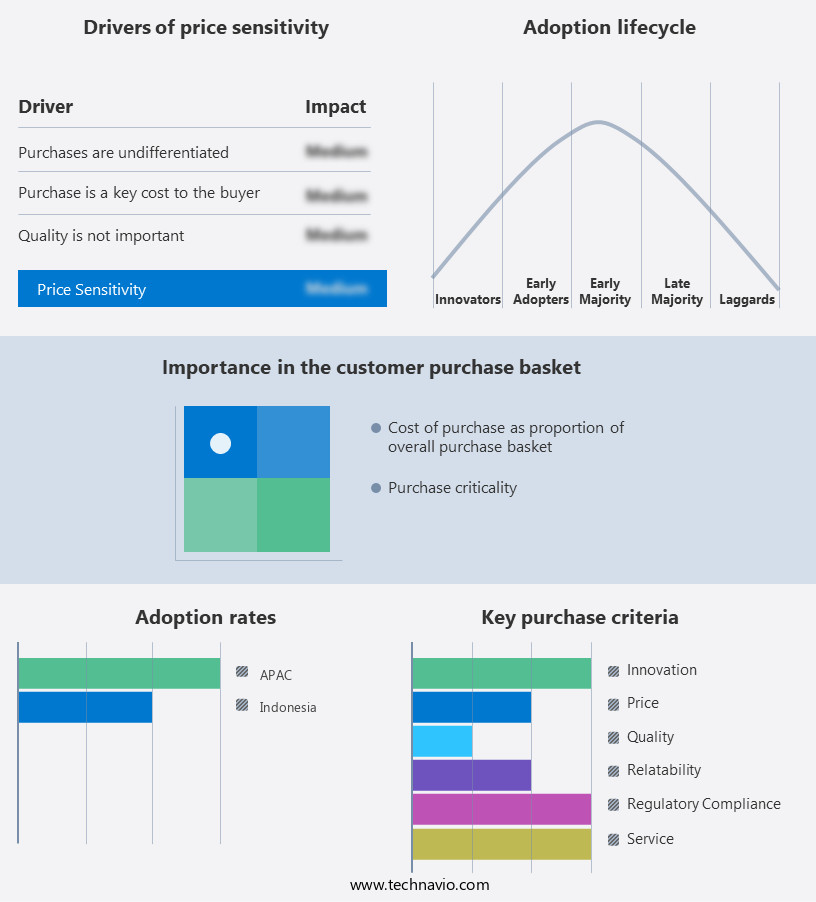
The market forecasting report includes the adoption lifecycle of the market, covering from the innovator’s stage to the laggard’s stage. It focuses on adoption rates in different regions based on penetration. Furthermore, the report also includes key purchase criteria and drivers of price sensitivity to help companies evaluate and develop their market growth analysis strategies.
Customer Landscape
Key Companies & Market Insights
Companies are implementing various strategies, such as strategic alliances, market forecast partnerships, mergers and acquisitions, geographical expansion, and product/service launches, to enhance their presence In the market.
The market research and growth report includes detailed analyses of the competitive landscape of the market and information about key companies, including:
- CV Raisa House Indonesia
- Dawood Indonesia
- Fabelio
- Galeri Jepara
- GGS
- Informa
- Integra Group
- Inter IKEA Holding BV
- Kalingga Putra
- Lio Collection
- PT Chitose International Tbk.
- PT VIVERE Multi Kreasi
- Republic Furniture Group
- Vixi Inc.
- Wahana Kayu
- Wisanka Indonesia
Qualitative and quantitative analysis of companies has been conducted to help clients understand the wider business environment as well as the strengths and weaknesses of key market players. Data is qualitatively analyzed to categorize companies as pure play, category-focused, industry-focused, and diversified; it is quantitatively analyzed to categorize companies as dominant, leading, strong, tentative, and weak.
Research Analyst Overview
The market is a significant player In the global furniture industry, catering to both residential and commercial sectors. This market is driven by various factors, including the real estate sector's growth, home renovation activities, and the increasing trend towards sustainable and eco-friendly furniture. Indonesia's furniture industry is known for its unique designs and diverse range of styles. The country's rich natural resources, such as bamboo, recycled wood, and reclaimed wood, are popular choices for furniture production. These materials offer a rustic and vintage aesthetic, making them a preferred option for interior decoration in both residential and commercial settings. Sustainability is a key trend In the furniture market, with consumers increasingly seeking furniture made from renewable resources.
Wood remains a popular choice due to its natural beauty and durability. However, there is also a growing demand for processed woods, such as plywood, MDF, and particleboard, which offer cost-effective alternatives. The office the market is also experiencing significant growth, driven by the increasing trend towards remote work and flexible work arrangements. Office design is becoming more focused on ergonomics and health and wellness, with modular and compact furniture gaining popularity for their space-saving properties. The residential furniture market is another significant segment, with housing construction and renovation activities driving demand. Stylish designs and unique pieces are popular choices for residential settings, with living room, bedroom, dining room, and kitchen furniture being the most sought-after categories.
Recycling initiatives are also gaining traction In the furniture industry, with many manufacturers adopting sustainable practices to reduce their environmental footprint. This includes using antimicrobial agents, non-toxic components, and FSC-certified wood. The e-commerce sector is transforming the way furniture is bought and sold in Indonesia. E-commerce platforms and online distribution channels have made it easier for consumers to access a wide range of furniture options from the comfort of their homes. The hospitality sector is also a significant customer base for furniture manufacturers, with hotels and resorts requiring large quantities of furniture for their properties. In conclusion, the market is a dynamic and diverse industry, driven by various factors such as real estate growth, home renovation, sustainability, and e-commerce.
The market offers a wide range of furniture options, from unique designs to sustainable materials, catering to both residential and commercial sectors. The industry's focus on innovation and sustainability is expected to continue driving growth In the coming years.
|
Market Scope |
|
|
Report Coverage |
Details |
|
Page number |
126 |
|
Base year |
2023 |
|
Historic period |
2018-2022 |
|
Forecast period |
2024-2028 |
|
Growth momentum & CAGR |
Accelerate at a CAGR of 14.2% |
|
Market growth 2024-2028 |
USD 3996.4 million |
|
Market structure |
Fragmented |
|
YoY growth 2023-2024(%) |
12.4 |
|
Competitive landscape |
Leading Companies, Market Positioning of Companies, Competitive Strategies, and Industry Risks |
What are the Key Data Covered in this Market Research Report?
- CAGR of the market during the forecast period
- Detailed information on factors that will drive the market growth and forecasting between 2024 and 2028
- Precise estimation of the size of the market and its contribution of the market in focus to the parent market
- Accurate predictions about upcoming market growth and trends and changes in consumer behaviour
- Growth of the market across Indonesia
- Thorough analysis of the market’s competitive landscape and detailed information about companies
- Comprehensive analysis of factors that will challenge the growth of market companies
We can help! Our analysts can customize this market research report to meet your requirements Get in touch


