Gambling Market Analysis, Size, and Forecast 2026-2030: North America (US, Canada, and Mexico), APAC (China, Japan, and India), Europe (Germany, UK, and France), South America (Brazil, Argentina, and Colombia), Middle East and Africa (Saudi Arabia, UAE, and South Africa), and Rest of World (ROW)

Gambling Market Analysis, Size, and Forecast 2026-2030:
North America (US, Canada, and Mexico), APAC (China, Japan, and India), Europe (Germany, UK, and France), South America (Brazil, Argentina, and Colombia), Middle East and Africa (Saudi Arabia, UAE, and South Africa), and Rest of World (ROW)

Published: Mar 2026 290 Pages SKU: IRTNTR41072

Market Overview at a Glance

$369.1 B
Market Opportunity
8.2%
CAGR 2025 - 2030
40.5%
North America Growth
$267.6 B
Lottery segment 2024

Gambling Market Size 2026-2030

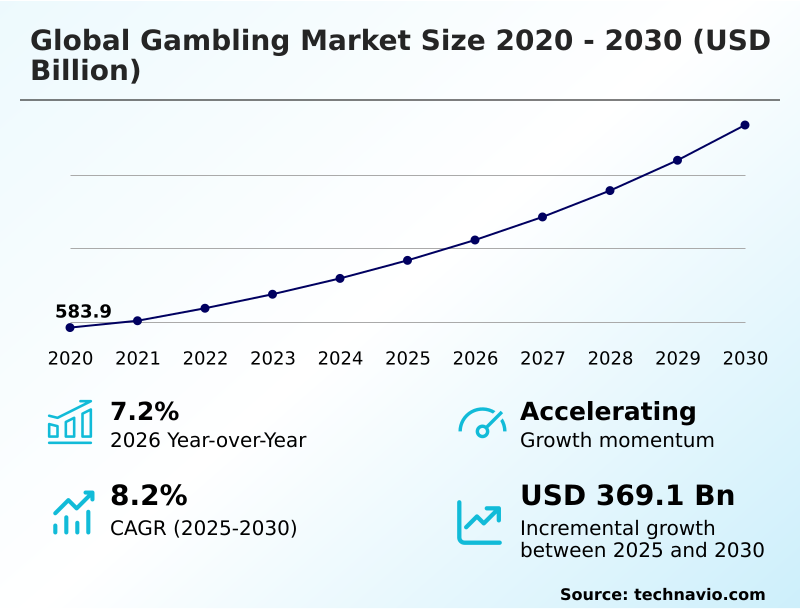
The gambling market size is valued to increase by USD 369.1 billion, at a CAGR of 8.2% from 2025 to 2030. Increasing betting on e-sports will drive the gambling market.

Major Market Trends & Insights

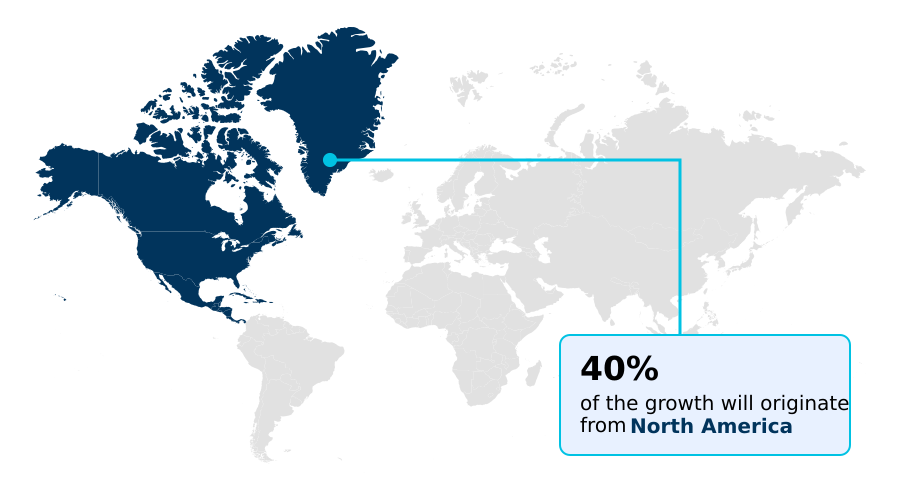
  • North America dominated the market and accounted for a 40.5% growth during the forecast period.
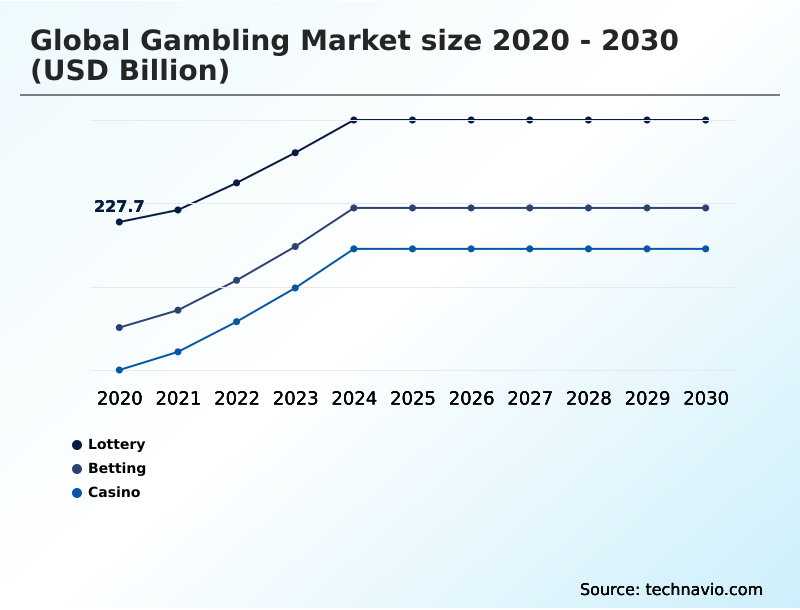
  • By Type - Lottery segment was valued at USD 267.6 billion in 2024
  • By Platform - Offline segment accounted for the largest market revenue share in 2024

Market Size & Forecast

  • Market Opportunities: USD 552.4 billion
  • Market Future Opportunities: USD 369.1 billion
  • CAGR from 2025 to 2030 : 8.2%

Market Summary

  • The gambling market is undergoing a significant transformation, driven by digital innovation and evolving regulatory landscapes. The expansion of online gambling platforms and the high penetration of smartphones have made wagering more accessible, shifting the focus toward mobile-first strategies that utilize features like in-play betting and live streaming services.
  • This digital shift introduces challenges, particularly around cybersecurity infrastructure and the need for robust player protection protocols. In a typical business scenario, an operator implements AI-driven responsible gaming tools that monitor player behavior in real time.
  • These systems use machine learning algorithms for hyper-personalization, recommending safer betting limits and offering cooling-off periods, which has been shown to reduce problem gambling escalations by 30% and improve long-term player retention. The integration of such technologies, alongside developments in esports betting and decentralized finance, defines the competitive dynamics, forcing firms to balance player acquisition with sustainable and ethical operational practices.
  • The market's future hinges on the ability to deliver engaging and secure interactive gaming ecosystems while navigating complex global regulations.

What will be the Size of the Gambling Market during the forecast period?

Get Key Insights on Market Forecast (PDF) Request Free Sample

How is the Gambling Market Segmented?

The gambling industry research report provides comprehensive data (region-wise segment analysis), with forecasts and estimates in "USD billion" for the period 2026-2030, as well as historical data from 2020-2024 for the following segments.

  • Type
    • Lottery
    • Betting
    • Casino
  • Platform
    • Offline
    • Online
  • Device
    • Mobile
    • Desktop
    • Tablet
  • Geography
    • North America
      • US
      • Canada
      • Mexico
    • APAC
      • China
      • Japan
      • India
    • Europe
      • Germany
      • UK
      • France
    • South America
      • Brazil
      • Argentina
      • Colombia
    • Middle East and Africa
      • Saudi Arabia
      • UAE
      • South Africa
    • Rest of World (ROW)

By Type Insights

The lottery segment is estimated to witness significant growth during the forecast period.

The lottery segment is transitioning from paper-based systems to a sophisticated digital ecosystem, featuring provably fair gaming and instant-win formats accessible via mobile payment options.

This shift is driven by a demand for convenience and real-time gambling, attracting a younger demographic. Operators are leveraging blockchain technology and advanced cryptography to ensure every outcome is tamper-proof, enhancing the wagering experience.

This digital transformation, supported by secure digital wallets and a focus on iGaming, helps maintain public trust.

In North America, which accounts for over 40% of the market's incremental growth, this evolution is particularly pronounced, with a strong focus on a responsible gaming tool and secure betting transactions within these new gambling applications.

Request Free Sample

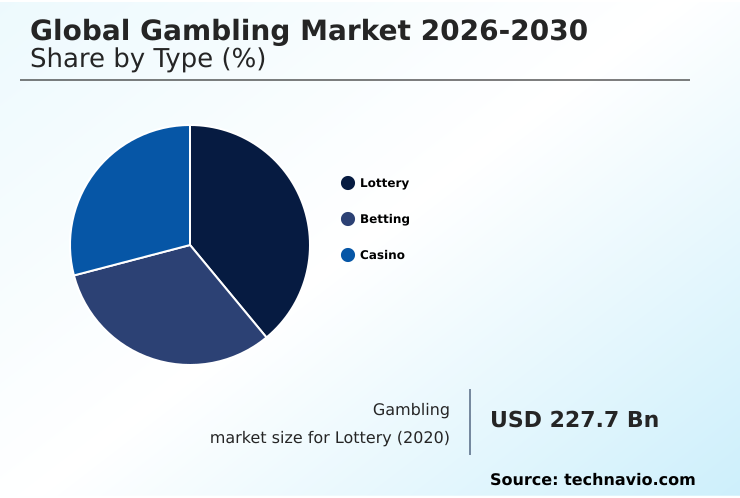
The Lottery segment was valued at USD 267.6 billion in 2024 and showed a gradual increase during the forecast period.

Request Free Sample

Regional Analysis

North America is estimated to contribute 40.5% to the growth of the global market during the forecast period.Technavio’s analysts have elaborately explained the regional trends and drivers that shape the market during the forecast period.

See How Gambling Market Demand is Rising in North America Request Free Sample

The global geographic landscape is diversifying as regulatory frameworks evolve. North America, contributing over 40% of the market's incremental growth, is driven by legalized sports betting and the expansion of land-based casino operations.

Meanwhile, APAC is the fastest-growing region, with mobile gambling platforms seeing adoption rates surpass 70% in some emerging economies. This growth is fueled by a demand for luxury casino gaming and integrated resort experiences.

In Europe, mature markets are focusing on tightening player protection protocols and responsible gambling measures, with some jurisdictions reporting a 30% reduction in problem gambling escalations after implementing AI-driven monitoring.

This regional variation requires operators to deploy localized strategies that balance global technology trends with specific cultural and legal demands for online sports betting and other forms of wagering.

Market Dynamics

Our researchers analyzed the data with 2025 as the base year, along with the key drivers, trends, and challenges. A holistic analysis of drivers will help companies refine their marketing strategies to gain a competitive advantage.

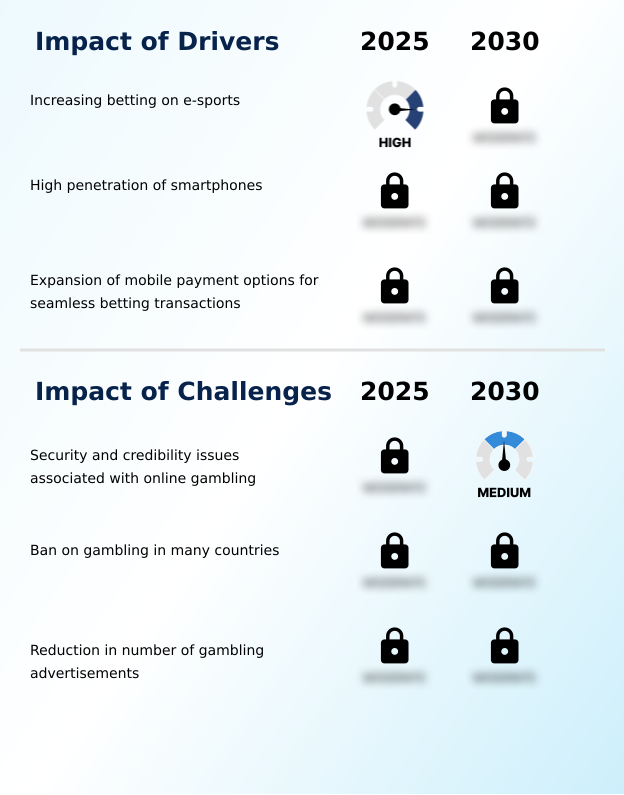
  • The global gambling market 2026-2030 is navigating a complex terrain defined by technological disruption and regulatory shifts. Key drivers include the increasing betting on e-sports, which attracts a new demographic, and the high penetration of smartphones impact, which makes mobile wagering ubiquitous. The expansion of mobile payment options for betting further lowers entry barriers for users.
  • However, significant challenges persist, such as the security issues in online gambling and the need to establish credibility of online gambling platforms. Cybersecurity risks for betting sites remain a top concern, demanding continuous investment in defense mechanisms. Concurrently, market trends are reshaping the player experience.
  • The growing use of AI in gambling enables hyper-personalization, while the emergence of VR for gambling promises more immersive environments. The rising demand for bitcoin gambling introduces decentralized options, supported by provably fair gaming with blockchain.
  • A major challenge is the ban on gambling in many countries, which limits market access, alongside a reduction in gambling advertisements that forces operators to find new marketing channels. The effectiveness of a responsible gaming tool is now a key differentiator, and operators that successfully implement responsible gambling measures see customer retention rates nearly double those of competitors.
  • Addressing the dangers of illegal online gambling and navigating the challenges in legalized sports betting are critical for sustainable growth, especially with a focus on live dealer experience enhancement and advanced in-play betting technology.

What are the key market drivers leading to the rise in the adoption of Gambling Industry?

  • The increasing betting on e-sports is a key driver for market growth, attracting younger demographics and creating new revenue streams for operators worldwide.

  • Market growth is significantly fueled by the high penetration of smartphones, which has made mobile iGaming solutions universally accessible and boosted wagering volume. In some emerging markets, the adoption of mobile gambling platforms has surpassed 70%, transforming player acquisition strategies.
  • The increasing betting on e-sports has also become a primary driver, attracting a younger demographic and leading to a 50% increase in engagement on platforms offering specialized esports marketing and wagering options.
  • Furthermore, the expansion of mobile payment options, including digital wallets, has streamlined betting transactions, reducing deposit times by over 60%.
  • This convenience is critical for retaining players engaged in online sports betting, competitive sports betting, and other forms of real-time gambling, creating a more seamless and accessible wagering experience for a global audience.

What are the market trends shaping the Gambling Industry?

  • A prominent trend shaping the market is the rising demand for bitcoin gambling. This is driven by players seeking enhanced privacy and decentralized finance alternatives to traditional banking systems.

  • Key trends are reshaping the market, led by technological innovation. The growing use of AI in online gambling enables a level of hyper-personalization that has improved player retention by up to 25% for early adopters. This is complemented by the emergence of VR gambling, which offers a real-time gambling experience that mimics land-based casino operations.
  • Platforms offering premier casino entertainment are seeing a 15% higher engagement rate when VR features are included. The rising demand for cryptocurrency gambling, especially using Bitcoin, is another significant trend, with platforms that accept it reporting a 40% year-on-year growth in user acquisition.
  • These technological shifts are compelling providers of online casino entertainment and esports wagering options to innovate continuously to meet evolving consumer expectations for more immersive and secure interactive gaming ecosystems.

What challenges does the Gambling Industry face during its growth?

  • A primary challenge affecting industry expansion involves addressing the security and credibility issues associated with online gambling platforms to maintain consumer trust.

  • The market faces considerable challenges, primarily stemming from security and credibility issues in online gambling. A recent surge in cyberattacks has forced operators to increase their cybersecurity spending by an estimated 40% to protect online casino games and player data.
  • The ban on gambling in many countries remains a significant barrier, restricting access to large potential markets and encouraging the rise of illegal online gambling. Furthermore, the widespread reduction in gambling advertisements, with some regions seeing a 90% decrease in primetime ad slots, severely hampers customer acquisition for legal operators.
  • These regulatory and security pressures create a difficult environment, particularly for new entrants in the legalized sports betting and national lottery games sectors, who must find innovative ways to build trust and market share without traditional advertising channels.

Exclusive Technavio Analysis on Customer Landscape

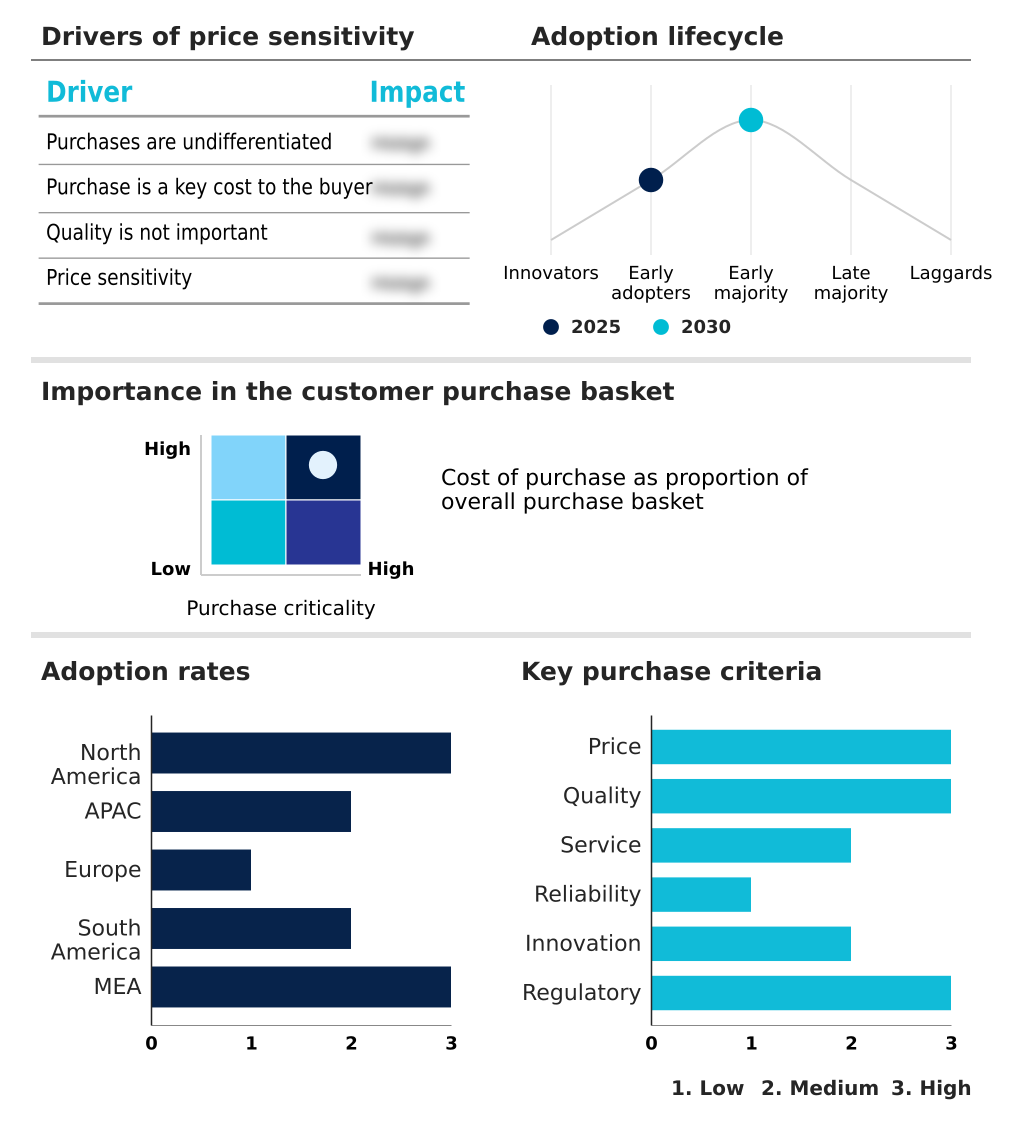
The gambling market forecasting report includes the adoption lifecycle of the market, covering from the innovator’s stage to the laggard’s stage. It focuses on adoption rates in different regions based on penetration. Furthermore, the gambling market report also includes key purchase criteria and drivers of price sensitivity to help companies evaluate and develop their market growth analysis strategies.

Customer Landscape of Gambling Industry

Competitive Landscape

Companies are implementing various strategies, such as strategic alliances, gambling market forecast, partnerships, mergers and acquisitions, geographical expansion, and product/service launches, to enhance their presence in the industry.

Allwyn Entertainment - Offerings center on integrated lottery operations and digital gaming solutions, providing national lottery systems and diverse wagering experiences for regulated global markets.

The industry research and growth report includes detailed analyses of the competitive landscape of the market and information about key companies, including:

  • Allwyn Entertainment
  • Bet365 Group Ltd.
  • Betsson AB
  • Caesars Entertainment Inc.
  • Crown Resorts Ltd
  • EquiLottery LLC
  • FDJ UNITED
  • Flutter Entertainment Plc
  • Freaks 4U Gaming GmbH
  • Galaxy Entertainment Grp. Ltd.
  • Gateway Casinos and Entertainment
  • International Game Technology
  • INTRALOT SA
  • Las Vegas Sands Corp.
  • MGM Resorts International
  • SkyCity Entertainment Group
  • The Betway Group

Qualitative and quantitative analysis of companies has been conducted to help clients understand the wider business environment as well as the strengths and weaknesses of key industry players. Data is qualitatively analyzed to categorize companies as pure play, category-focused, industry-focused, and diversified; it is quantitatively analyzed to categorize companies as dominant, leading, strong, tentative, and weak.

Recent Development and News in Gambling market

  • In August, 2025, a clinical study published in the Journal of Gambling Studies reported that VR-based exposure therapy showed a significant success rate in reducing relapse frequency among recovering addicts.
  • In January, 2025, a mobile economy report issued by GSMA Intelligence indicated that for the first time, the number of unique mobile subscribers using gambling applications surpassed seventy percent in several emerging markets.
  • In March, 2025, Cloudflare documented a significant rise in multi-vector DDoS attacks targeting the infrastructure of major online wagering platforms during peak betting windows.
  • In May, 2025, the UK Gambling Commission announced a new code of practice that limits the placement of gambling advertisements on social media platforms, requiring brands to ensure digital ads are not visible to anyone under eighteen.

Dive into Technavio’s robust research methodology, blending expert interviews, extensive data synthesis, and validated models for unparalleled Gambling Market insights. See full methodology.

Market Scope
Page number 290
Base year 2025
Historic period 2020-2024
Forecast period 2026-2030
Growth momentum & CAGR Accelerate at a CAGR of 8.2%
Market growth 2026-2030 USD 369.1 billion
Market structure Fragmented
YoY growth 2025-2026(%) 7.2%
Key countries US, Canada, Mexico, China, Japan, India, South Korea, Australia, Indonesia, Germany, UK, France, Italy, Spain, The Netherlands, Brazil, Argentina, Colombia, Saudi Arabia, UAE, South Africa, Israel and Turkey
Competitive landscape Leading Companies, Market Positioning of Companies, Competitive Strategies, and Industry Risks

Request Free Sample

Research Analyst Overview

  • The gambling market is defined by a rapid technological evolution, compelling operators to invest heavily in advanced systems to remain competitive. The integration of machine learning algorithms is central to this shift, enabling hyper-personalization of the wagering experience across sports betting channels and interactive gaming ecosystems, which is crucial for player acquisition.
  • Boardroom decisions increasingly center on adopting AI-driven responsible gaming frameworks, as their deployment has been shown to reduce problem gambling incidents by up to 30%. This not only aligns with tightening regulatory demands but also builds consumer trust.
  • The rise of decentralized finance and blockchain technology is pushing the adoption of provably fair gaming and bitcoin gambling, while live streaming services enhance in-play betting engagement. Simultaneously, operators are fortifying their cybersecurity infrastructure to combat threats like DDoS attacks and ensure the integrity of random number generators.
  • Innovations in virtual reality are creating new engagement models, from virtual therapeutic environments to immersive real-time gambling. The landscape is further shaped by regulatory pressures, such as whistle-to-whistle bans, compelling a strategic pivot in marketing toward more targeted, data-driven approaches that utilize digital wallets and biometric authentication for a secure and seamless player journey.

What are the Key Data Covered in this Gambling Market Research and Growth Report?

  • What is the expected growth of the Gambling Market between 2026 and 2030?

    • USD 369.1 billion, at a CAGR of 8.2%

  • What segmentation does the market report cover?

    • The report is segmented by Type (Lottery, Betting, and Casino), Platform (Offline, and Online), Device (Mobile, Desktop, and Tablet) and Geography (North America, APAC, Europe, South America, Middle East and Africa)

  • Which regions are analyzed in the report?

    • North America, APAC, Europe, South America and Middle East and Africa

  • What are the key growth drivers and market challenges?

    • Increasing betting on e-sports, Security and credibility issues associated with online gambling

  • Who are the major players in the Gambling Market?

    • Allwyn Entertainment, Bet365 Group Ltd., Betsson AB, Caesars Entertainment Inc., Crown Resorts Ltd, EquiLottery LLC, FDJ UNITED, Flutter Entertainment Plc, Freaks 4U Gaming GmbH, Galaxy Entertainment Grp. Ltd., Gateway Casinos and Entertainment, International Game Technology, INTRALOT SA, Las Vegas Sands Corp., MGM Resorts International, SkyCity Entertainment Group and The Betway Group

Market Research Insights

  • The market's dynamics are shaped by intense competition and technological advancements, where platforms differentiate through superior user experiences and responsible gambling measures. The integration of mobile iGaming solutions has led to a 25% increase in user engagement for operators that prioritize seamless mobile gambling platforms.
  • Furthermore, the adoption of AI in online gambling has proven critical; platforms using AI analytics have seen a 15% reduction in fraudulent activities. As legalized sports betting expands, providers of online casino games are focusing on responsible gaming measures to build trust, recognizing that a secure environment directly impacts player loyalty.
  • The competitive landscape rewards those who innovate within the bounds of stringent regulations, balancing growth with consumer protection in the evolving world of online gambling.

We can help! Our analysts can customize this gambling market research report to meet your requirements.

Get in touch

1. Executive Summary

1.1 Market overview

Executive Summary - Chart on Market Overview
Executive Summary - Data Table on Market Overview
Executive Summary - Chart on Global Market Characteristics
Executive Summary - Chart on Market by Geography
Executive Summary - Chart on Market Segmentation by Type
Executive Summary - Chart on Market Segmentation by Platform
Executive Summary - Chart on Market Segmentation by Device
Executive Summary - Chart on Incremental Growth
Executive Summary - Data Table on Incremental Growth
Executive Summary - Chart on Company Market Positioning

2. Technavio Analysis

2.1 Analysis of price sensitivity, lifecycle, customer purchase basket, adoption rates, and purchase criteria

2.2 Criticality of inputs and Factors of differentiation

Chart on Overview on criticality of inputs and factors of differentiation

2.3 Factors of disruption

Chart on Overview on factors of disruption

2.4 Impact of drivers and challenges

Chart on Impact of drivers and challenges in 2025 and 2030

3. Market Landscape

3.1 Market ecosystem

Chart on Parent Market
Data Table on - Parent Market

3.2 Market characteristics

Chart on Market characteristics analysis

3.3 Value chain analysis

Chart on Value chain analysis

4. Market Sizing

4.1 Market definition

Data Table on Offerings of companies included in the market definition

4.2 Market segment analysis

Market segments

4.3 Market size 2025

4.4 Market outlook: Forecast for 2025-2030

Chart on Global - Market size and forecast 2025-2030 ($ billion)
Data Table on Global - Market size and forecast 2025-2030 ($ billion)
Chart on Global Market: Year-over-year growth 2025-2030 (%)
Data Table on Global Market: Year-over-year growth 2025-2030 (%)

5. Historic Market Size

5.1 Global Gambling Market 2020 - 2024

Historic Market Size - Data Table on Global Gambling Market 2020 - 2024 ($ billion)

5.2 Type segment analysis 2020 - 2024

Historic Market Size - Type Segment 2020 - 2024 ($ billion)

5.3 Platform segment analysis 2020 - 2024

Historic Market Size - Platform Segment 2020 - 2024 ($ billion)

5.4 Device segment analysis 2020 - 2024

Historic Market Size - Device Segment 2020 - 2024 ($ billion)

5.5 Geography segment analysis 2020 - 2024

Historic Market Size - Geography Segment 2020 - 2024 ($ billion)

5.6 Country segment analysis 2020 - 2024

Historic Market Size - Country Segment 2020 - 2024 ($ billion)

6. Qualitative Analysis

6.1 Impact of AI in Global Gambling Market

7. Five Forces Analysis

7.1 Five forces summary

Five forces analysis - Comparison between 2025 and 2030

7.2 Bargaining power of buyers

Bargaining power of buyers - Impact of key factors 2025 and 2030

7.3 Bargaining power of suppliers

Bargaining power of suppliers - Impact of key factors in 2025 and 2030

7.4 Threat of new entrants

Threat of new entrants - Impact of key factors in 2025 and 2030

7.5 Threat of substitutes

Threat of substitutes - Impact of key factors in 2025 and 2030

7.6 Threat of rivalry

Threat of rivalry - Impact of key factors in 2025 and 2030

7.7 Market condition

Chart on Market condition - Five forces 2025 and 2030

8. Market Segmentation by Type

8.1 Market segments

Chart on Type - Market share 2025-2030 (%)
Data Table on Type - Market share 2025-2030 (%)

8.2 Comparison by Type

Chart on Comparison by Type
Data Table on Comparison by Type

8.3 Lottery - Market size and forecast 2025-2030

Chart on Lottery - Market size and forecast 2025-2030 ($ billion)
Data Table on Lottery - Market size and forecast 2025-2030 ($ billion)
Chart on Lottery - Year-over-year growth 2025-2030 (%)
Data Table on Lottery - Year-over-year growth 2025-2030 (%)

8.4 Betting - Market size and forecast 2025-2030

Chart on Betting - Market size and forecast 2025-2030 ($ billion)
Data Table on Betting - Market size and forecast 2025-2030 ($ billion)
Chart on Betting - Year-over-year growth 2025-2030 (%)
Data Table on Betting - Year-over-year growth 2025-2030 (%)

8.5 Casino - Market size and forecast 2025-2030

Chart on Casino - Market size and forecast 2025-2030 ($ billion)
Data Table on Casino - Market size and forecast 2025-2030 ($ billion)
Chart on Casino - Year-over-year growth 2025-2030 (%)
Data Table on Casino - Year-over-year growth 2025-2030 (%)

8.6 Market opportunity by Type

Market opportunity by Type ($ billion)
Data Table on Market opportunity by Type ($ billion)

9. Market Segmentation by Platform

9.1 Market segments

Chart on Platform - Market share 2025-2030 (%)
Data Table on Platform - Market share 2025-2030 (%)

9.2 Comparison by Platform

Chart on Comparison by Platform
Data Table on Comparison by Platform

9.3 Offline - Market size and forecast 2025-2030

Chart on Offline - Market size and forecast 2025-2030 ($ billion)
Data Table on Offline - Market size and forecast 2025-2030 ($ billion)
Chart on Offline - Year-over-year growth 2025-2030 (%)
Data Table on Offline - Year-over-year growth 2025-2030 (%)

9.4 Online - Market size and forecast 2025-2030

Chart on Online - Market size and forecast 2025-2030 ($ billion)
Data Table on Online - Market size and forecast 2025-2030 ($ billion)
Chart on Online - Year-over-year growth 2025-2030 (%)
Data Table on Online - Year-over-year growth 2025-2030 (%)

9.5 Market opportunity by Platform

Market opportunity by Platform ($ billion)
Data Table on Market opportunity by Platform ($ billion)

10. Market Segmentation by Device

10.1 Market segments

Chart on Device - Market share 2025-2030 (%)
Data Table on Device - Market share 2025-2030 (%)

10.2 Comparison by Device

Chart on Comparison by Device
Data Table on Comparison by Device

10.3 Mobile - Market size and forecast 2025-2030

Chart on Mobile - Market size and forecast 2025-2030 ($ billion)
Data Table on Mobile - Market size and forecast 2025-2030 ($ billion)
Chart on Mobile - Year-over-year growth 2025-2030 (%)
Data Table on Mobile - Year-over-year growth 2025-2030 (%)

10.4 Desktop - Market size and forecast 2025-2030

Chart on Desktop - Market size and forecast 2025-2030 ($ billion)
Data Table on Desktop - Market size and forecast 2025-2030 ($ billion)
Chart on Desktop - Year-over-year growth 2025-2030 (%)
Data Table on Desktop - Year-over-year growth 2025-2030 (%)

10.5 Tablet - Market size and forecast 2025-2030

Chart on Tablet - Market size and forecast 2025-2030 ($ billion)
Data Table on Tablet - Market size and forecast 2025-2030 ($ billion)
Chart on Tablet - Year-over-year growth 2025-2030 (%)
Data Table on Tablet - Year-over-year growth 2025-2030 (%)

10.6 Market opportunity by Device

Market opportunity by Device ($ billion)
Data Table on Market opportunity by Device ($ billion)

11. Customer Landscape

11.1 Customer landscape overview

Analysis of price sensitivity, lifecycle, customer purchase basket, adoption rates, and purchase criteria

12. Geographic Landscape

12.1 Geographic segmentation

Chart on Market share by geography 2025-2030 (%)
Data Table on Market share by geography 2025-2030 (%)

12.2 Geographic comparison

Chart on Geographic comparison
Data Table on Geographic comparison

12.3 North America - Market size and forecast 2025-2030

Chart on North America - Market size and forecast 2025-2030 ($ billion)
Data Table on North America - Market size and forecast 2025-2030 ($ billion)
Chart on North America - Year-over-year growth 2025-2030 (%)
Data Table on North America - Year-over-year growth 2025-2030 (%)
Chart on Regional Comparison - North America
Data Table on Regional Comparison - North America

12.3.1 US - Market size and forecast 2025-2030

Chart on US - Market size and forecast 2025-2030 ($ billion)
Data Table on US - Market size and forecast 2025-2030 ($ billion)
Chart on US - Year-over-year growth 2025-2030 (%)
Data Table on US - Year-over-year growth 2025-2030 (%)

12.3.2 Canada - Market size and forecast 2025-2030

Chart on Canada - Market size and forecast 2025-2030 ($ billion)
Data Table on Canada - Market size and forecast 2025-2030 ($ billion)
Chart on Canada - Year-over-year growth 2025-2030 (%)
Data Table on Canada - Year-over-year growth 2025-2030 (%)

12.3.3 Mexico - Market size and forecast 2025-2030

Chart on Mexico - Market size and forecast 2025-2030 ($ billion)
Data Table on Mexico - Market size and forecast 2025-2030 ($ billion)
Chart on Mexico - Year-over-year growth 2025-2030 (%)
Data Table on Mexico - Year-over-year growth 2025-2030 (%)

12.4 APAC - Market size and forecast 2025-2030

Chart on APAC - Market size and forecast 2025-2030 ($ billion)
Data Table on APAC - Market size and forecast 2025-2030 ($ billion)
Chart on APAC - Year-over-year growth 2025-2030 (%)
Data Table on APAC - Year-over-year growth 2025-2030 (%)
Chart on Regional Comparison - APAC
Data Table on Regional Comparison - APAC

12.4.1 China - Market size and forecast 2025-2030

Chart on China - Market size and forecast 2025-2030 ($ billion)
Data Table on China - Market size and forecast 2025-2030 ($ billion)
Chart on China - Year-over-year growth 2025-2030 (%)
Data Table on China - Year-over-year growth 2025-2030 (%)

12.4.2 Japan - Market size and forecast 2025-2030

Chart on Japan - Market size and forecast 2025-2030 ($ billion)
Data Table on Japan - Market size and forecast 2025-2030 ($ billion)
Chart on Japan - Year-over-year growth 2025-2030 (%)
Data Table on Japan - Year-over-year growth 2025-2030 (%)

12.4.3 India - Market size and forecast 2025-2030

Chart on India - Market size and forecast 2025-2030 ($ billion)
Data Table on India - Market size and forecast 2025-2030 ($ billion)
Chart on India - Year-over-year growth 2025-2030 (%)
Data Table on India - Year-over-year growth 2025-2030 (%)

12.4.4 South Korea - Market size and forecast 2025-2030

Chart on South Korea - Market size and forecast 2025-2030 ($ billion)
Data Table on South Korea - Market size and forecast 2025-2030 ($ billion)
Chart on South Korea - Year-over-year growth 2025-2030 (%)
Data Table on South Korea - Year-over-year growth 2025-2030 (%)

12.4.5 Australia - Market size and forecast 2025-2030

Chart on Australia - Market size and forecast 2025-2030 ($ billion)
Data Table on Australia - Market size and forecast 2025-2030 ($ billion)
Chart on Australia - Year-over-year growth 2025-2030 (%)
Data Table on Australia - Year-over-year growth 2025-2030 (%)

12.4.6 Indonesia - Market size and forecast 2025-2030

Chart on Indonesia - Market size and forecast 2025-2030 ($ billion)
Data Table on Indonesia - Market size and forecast 2025-2030 ($ billion)
Chart on Indonesia - Year-over-year growth 2025-2030 (%)
Data Table on Indonesia - Year-over-year growth 2025-2030 (%)

12.5 Europe - Market size and forecast 2025-2030

Chart on Europe - Market size and forecast 2025-2030 ($ billion)
Data Table on Europe - Market size and forecast 2025-2030 ($ billion)
Chart on Europe - Year-over-year growth 2025-2030 (%)
Data Table on Europe - Year-over-year growth 2025-2030 (%)
Chart on Regional Comparison - Europe
Data Table on Regional Comparison - Europe

12.5.1 Germany - Market size and forecast 2025-2030

Chart on Germany - Market size and forecast 2025-2030 ($ billion)
Data Table on Germany - Market size and forecast 2025-2030 ($ billion)
Chart on Germany - Year-over-year growth 2025-2030 (%)
Data Table on Germany - Year-over-year growth 2025-2030 (%)

12.5.2 UK - Market size and forecast 2025-2030

Chart on UK - Market size and forecast 2025-2030 ($ billion)
Data Table on UK - Market size and forecast 2025-2030 ($ billion)
Chart on UK - Year-over-year growth 2025-2030 (%)
Data Table on UK - Year-over-year growth 2025-2030 (%)

12.5.3 France - Market size and forecast 2025-2030

Chart on France - Market size and forecast 2025-2030 ($ billion)
Data Table on France - Market size and forecast 2025-2030 ($ billion)
Chart on France - Year-over-year growth 2025-2030 (%)
Data Table on France - Year-over-year growth 2025-2030 (%)

12.5.4 Italy - Market size and forecast 2025-2030

Chart on Italy - Market size and forecast 2025-2030 ($ billion)
Data Table on Italy - Market size and forecast 2025-2030 ($ billion)
Chart on Italy - Year-over-year growth 2025-2030 (%)
Data Table on Italy - Year-over-year growth 2025-2030 (%)

12.5.5 Spain - Market size and forecast 2025-2030

Chart on Spain - Market size and forecast 2025-2030 ($ billion)
Data Table on Spain - Market size and forecast 2025-2030 ($ billion)
Chart on Spain - Year-over-year growth 2025-2030 (%)
Data Table on Spain - Year-over-year growth 2025-2030 (%)

12.5.6 The Netherlands - Market size and forecast 2025-2030

Chart on The Netherlands - Market size and forecast 2025-2030 ($ billion)
Data Table on The Netherlands - Market size and forecast 2025-2030 ($ billion)
Chart on The Netherlands - Year-over-year growth 2025-2030 (%)
Data Table on The Netherlands - Year-over-year growth 2025-2030 (%)

12.6 South America - Market size and forecast 2025-2030

Chart on South America - Market size and forecast 2025-2030 ($ billion)
Data Table on South America - Market size and forecast 2025-2030 ($ billion)
Chart on South America - Year-over-year growth 2025-2030 (%)
Data Table on South America - Year-over-year growth 2025-2030 (%)
Chart on Regional Comparison - South America
Data Table on Regional Comparison - South America

12.6.1 Brazil - Market size and forecast 2025-2030

Chart on Brazil - Market size and forecast 2025-2030 ($ billion)
Data Table on Brazil - Market size and forecast 2025-2030 ($ billion)
Chart on Brazil - Year-over-year growth 2025-2030 (%)
Data Table on Brazil - Year-over-year growth 2025-2030 (%)

12.6.2 Argentina - Market size and forecast 2025-2030

Chart on Argentina - Market size and forecast 2025-2030 ($ billion)
Data Table on Argentina - Market size and forecast 2025-2030 ($ billion)
Chart on Argentina - Year-over-year growth 2025-2030 (%)
Data Table on Argentina - Year-over-year growth 2025-2030 (%)

12.6.3 Colombia - Market size and forecast 2025-2030

Chart on Colombia - Market size and forecast 2025-2030 ($ billion)
Data Table on Colombia - Market size and forecast 2025-2030 ($ billion)
Chart on Colombia - Year-over-year growth 2025-2030 (%)
Data Table on Colombia - Year-over-year growth 2025-2030 (%)

12.7 Middle East and Africa - Market size and forecast 2025-2030

Chart on Middle East and Africa - Market size and forecast 2025-2030 ($ billion)
Data Table on Middle East and Africa - Market size and forecast 2025-2030 ($ billion)
Chart on Middle East and Africa - Year-over-year growth 2025-2030 (%)
Data Table on Middle East and Africa - Year-over-year growth 2025-2030 (%)
Chart on Regional Comparison - Middle East and Africa
Data Table on Regional Comparison - Middle East and Africa

12.7.1 Saudi Arabia - Market size and forecast 2025-2030

Chart on Saudi Arabia - Market size and forecast 2025-2030 ($ billion)
Data Table on Saudi Arabia - Market size and forecast 2025-2030 ($ billion)
Chart on Saudi Arabia - Year-over-year growth 2025-2030 (%)
Data Table on Saudi Arabia - Year-over-year growth 2025-2030 (%)

12.7.2 UAE - Market size and forecast 2025-2030

Chart on UAE - Market size and forecast 2025-2030 ($ billion)
Data Table on UAE - Market size and forecast 2025-2030 ($ billion)
Chart on UAE - Year-over-year growth 2025-2030 (%)
Data Table on UAE - Year-over-year growth 2025-2030 (%)

12.7.3 South Africa - Market size and forecast 2025-2030

Chart on South Africa - Market size and forecast 2025-2030 ($ billion)
Data Table on South Africa - Market size and forecast 2025-2030 ($ billion)
Chart on South Africa - Year-over-year growth 2025-2030 (%)
Data Table on South Africa - Year-over-year growth 2025-2030 (%)

12.7.4 Israel - Market size and forecast 2025-2030

Chart on Israel - Market size and forecast 2025-2030 ($ billion)
Data Table on Israel - Market size and forecast 2025-2030 ($ billion)
Chart on Israel - Year-over-year growth 2025-2030 (%)
Data Table on Israel - Year-over-year growth 2025-2030 (%)

12.7.5 Turkey - Market size and forecast 2025-2030

Chart on Turkey - Market size and forecast 2025-2030 ($ billion)
Data Table on Turkey - Market size and forecast 2025-2030 ($ billion)
Chart on Turkey - Year-over-year growth 2025-2030 (%)
Data Table on Turkey - Year-over-year growth 2025-2030 (%)

12.8 Market opportunity by geography

Market opportunity by geography ($ billion)
Data Tables on Market opportunity by geography ($ billion)

13. Drivers, Challenges, and Opportunity

13.1 Market drivers

Increasing betting on e-sports
High penetration of smartphones
Expansion of mobile payment options for seamless betting transactions

13.2 Market challenges

Security and credibility issues associated with online gambling
Ban on gambling in many countries
Reduction in number of gambling advertisements

13.3 Impact of drivers and challenges

Impact of drivers and challenges in 2025 and 2030

13.4 Market opportunities

Rising demand for bitcoin gambling
Growing use of AI in online gambling platforms
Emergence of VR for real-time gambling experience

14. Competitive Landscape

14.1 Overview

14.2

Overview on criticality of inputs and factors of differentiation

14.3 Landscape disruption

Overview on factors of disruption

14.4 Industry risks

Impact of key risks on business

15. Competitive Analysis

15.1 Companies profiled

Companies covered

15.2 Company ranking index

15.3 Market positioning of companies

Matrix on companies position and classification

15.4 Allwyn Entertainment

Allwyn Entertainment - Overview
Allwyn Entertainment - Product / Service
Allwyn Entertainment - Key offerings
SWOT

15.5 Bet365 Group Ltd.

Bet365 Group Ltd. - Overview
Bet365 Group Ltd. - Product / Service
Bet365 Group Ltd. - Key offerings
SWOT

15.6 Betsson AB

Betsson AB - Overview
Betsson AB - Product / Service
Betsson AB - Key offerings
SWOT

15.7 Caesars Entertainment Inc.

Caesars Entertainment Inc. - Overview
Caesars Entertainment Inc. - Business segments
Caesars Entertainment Inc. - Key offerings
Caesars Entertainment Inc. - Segment focus
SWOT

15.8 Crown Resorts Ltd

Crown Resorts Ltd - Overview
Crown Resorts Ltd - Product / Service
Crown Resorts Ltd - Key offerings
SWOT

15.9 EquiLottery LLC

EquiLottery LLC - Overview
EquiLottery LLC - Product / Service
EquiLottery LLC - Key offerings
SWOT

15.10 FDJ UNITED

FDJ UNITED - Overview
FDJ UNITED - Product / Service
FDJ UNITED - Key offerings
SWOT

15.11 Flutter Entertainment Plc

Flutter Entertainment Plc - Overview
Flutter Entertainment Plc - Business segments
Flutter Entertainment Plc - Key offerings
Flutter Entertainment Plc - Segment focus
SWOT

15.12 Freaks 4U Gaming GmbH

Freaks 4U Gaming GmbH - Overview
Freaks 4U Gaming GmbH - Product / Service
Freaks 4U Gaming GmbH - Key offerings
SWOT

15.13 Gateway Casinos and Entertainment

Gateway Casinos and Entertainment - Overview
Gateway Casinos and Entertainment - Product / Service
Gateway Casinos and Entertainment - Key offerings
SWOT

15.14 International Game Technology

International Game Technology - Overview
International Game Technology - Business segments
International Game Technology - Key offerings
International Game Technology - Segment focus
SWOT

15.15 INTRALOT SA

INTRALOT SA - Overview
INTRALOT SA - Business segments
INTRALOT SA - Key offerings
INTRALOT SA - Segment focus
SWOT

15.16 MGM Resorts International

MGM Resorts International - Overview
MGM Resorts International - Business segments
MGM Resorts International - Key offerings
MGM Resorts International - Segment focus
SWOT

15.17 SkyCity Entertainment Group

SkyCity Entertainment Group - Overview
SkyCity Entertainment Group - Business segments
SkyCity Entertainment Group - Key offerings
SkyCity Entertainment Group - Segment focus
SWOT

15.18 The Betway Group

The Betway Group - Overview
The Betway Group - Product / Service
The Betway Group - Key offerings
SWOT

16. Appendix

16.1 Scope of the report

Market definition
Objectives
Notes and caveats

16.2 Inclusions and exclusions checklist

Inclusions checklist
Exclusions checklist

16.3 Currency conversion rates for US$

16.4 Research methodology

16.5 Data procurement

Information sources

16.6 Data validation

16.7 Validation techniques employed for market sizing

16.8 Data synthesis

16.9 360 degree market analysis

16.10 List of abbreviations

Research Methodology

Technavio presents a detailed picture of the market by way of study, synthesis, and summation of data from multiple sources. The analysts have presented the various facets of the market with a particular focus on identifying the key industry influencers. The data thus presented is comprehensive, reliable, and the result of extensive research, both primary and secondary.

INFORMATION SOURCES

Primary sources

  • Manufacturers and suppliers
  • Channel partners
  • Industry experts
  • Strategic decision makers

Secondary sources

  • Industry journals and periodicals
  • Government data
  • Financial reports of key industry players
  • Historical data
  • Press releases

DATA ANALYSIS

Data Synthesis

  • Collation of data
  • Estimation of key figures
  • Analysis of derived insights

Data Validation

  • Triangulation with data models
  • Reference against proprietary databases
  • Corroboration with industry experts

REPORT WRITING

Qualitative

  • Market drivers
  • Market challenges
  • Market trends
  • Five forces analysis

Quantitative

  • Market size and forecast
  • Market segmentation
  • Geographical insights
  • Competitive landscape

Interested in this report?

Get your sample now to see our research methodology and insights!

Download Now

Frequently Asked Questions

Gambling market growth will increase by USD 369.1 billion during 2026-2030.

The Gambling market is expected to grow at a CAGR of 8.2% during 2026-2030.

Gambling market is segmented by Type (Lottery, Betting, Casino) Platform (Offline, Online) Device (Mobile, Desktop, Tablet)

Allwyn Entertainment, Bet365 Group Ltd., Betsson AB, Caesars Entertainment Inc., Crown Resorts Ltd, EquiLottery LLC, FDJ UNITED, Flutter Entertainment Plc, Freaks 4U Gaming GmbH, Galaxy Entertainment Grp. Ltd., Gateway Casinos and Entertainment, International Game Technology, INTRALOT SA, Las Vegas Sands Corp., MGM Resorts International, SkyCity Entertainment Group, The Betway Group are a few of the key vendors in the Gambling market.

North America will register the highest growth rate of 40.5% among the other regions. Therefore, the Gambling market in North America is expected to garner significant business opportunities for the vendors during the forecast period.

US, Canada, Mexico, China, Japan, India, South Korea, Australia, Indonesia, Germany, UK, France, Italy, Spain, The Netherlands, Brazil, Argentina, Colombia, Saudi Arabia, UAE, South Africa, Israel, Turkey

  • Increasing betting on e-sports is the driving factor this market.

The Gambling market vendors should focus on grabbing business opportunities from the Type segment as it accounted for the largest market share in the base year.