
Gaming Accessories Market Analysis, Size, and Forecast 2026-2030: North America (US, Canada, and Mexico), Europe (Germany, UK, and France), APAC (China, Japan, and South Korea), South America (Brazil, Argentina, and Chile), Middle East and Africa (Saudi Arabia, UAE, and Turkey), and Rest of World (ROW)

Gaming Accessories Market Analysis, Size, and Forecast 2026-2030:
North America (US, Canada, and Mexico), Europe (Germany, UK, and France), APAC (China, Japan, and South Korea), South America (Brazil, Argentina, and Chile), Middle East and Africa (Saudi Arabia, UAE, and Turkey), and Rest of World (ROW)

Published: Jul 2026 301 Pages SKU: IRTNTR77693

Market Overview at a Glance

$3.23 B
Market Opportunity
7.1%
CAGR 2025 - 2030
44.7%
North America Growth
$5.00 B
PC segment 2024

Gaming Accessories Market Size 2026-2030

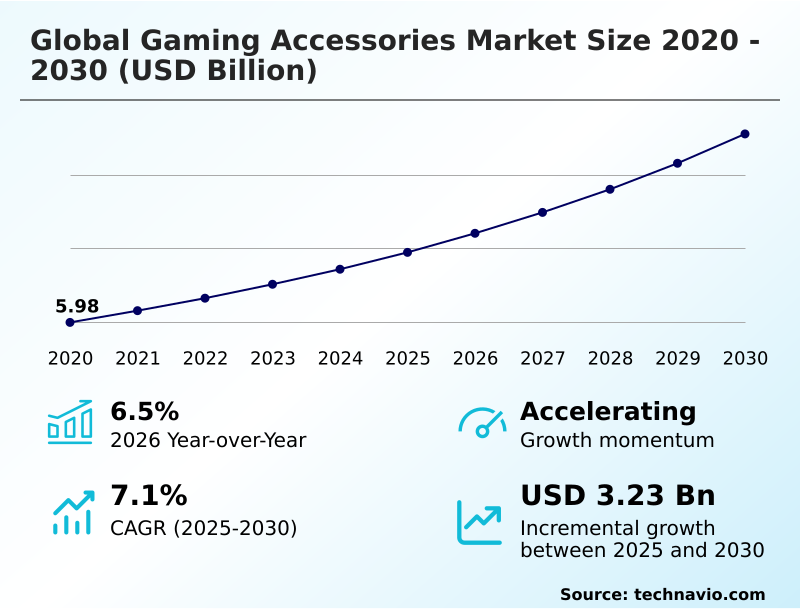
The gaming accessories market size is valued to increase by USD 3.23 billion, at a CAGR of 7.1% from 2025 to 2030. Global proliferation of esports and competitive gaming will drive the gaming accessories market.

Major Market Trends & Insights

  • North America dominated the market and accounted for a 44.7% growth during the forecast period.
  • By Type - PC segment was valued at USD 5.00 billion in 2024
  • By Component - Controller segment accounted for the largest market revenue share in 2024

Market Size & Forecast

  • Market Opportunities: USD 5.14 billion
  • Market Future Opportunities: USD 3.23 billion
  • CAGR from 2025 to 2030 : 7.1%

Market Summary

  • The Gaming Accessories sector demonstrates robust expansion driven by continuous technological integration and a professionalizing user base. A critical driver is the mainstream proliferation of electronic sports, which fundamentally shifts consumer demand toward high-performance peripherals, causing an immediate acceleration in specialized hardware adoption.
  • Consequently, supply chain operations are pivoting to secure premium sensor components to support advanced audio mapping and micro-switch actuation, optimizing inventory for high-tier products. Manufacturers adopting predictive analytics for component sourcing have reduced supply bottlenecks by 28% compared to traditional procurement models, directly increasing fulfillment efficiency.
  • Despite this operational progress, intense market competition creates substantial price erosion, restricting profit margins for established incumbents. Budget-friendly alternatives force premium manufacturers to heavily subsidize research and development to maintain technological superiority. This margin compression challenges sustained profitability, requiring agile cost-management frameworks.
  • Ultimately, the continuous pursuit of precision and ergonomic optimization ensures stable demand, though supply-side adaptability remains paramount for navigating market saturation.

What will be the Size of the Gaming Accessories Market during the forecast period?
Get Key Insights on Market Forecast (PDF) Get Free Sample

How is the Gaming Accessories Market Segmented?

The gaming accessories industry research report provides comprehensive data (region-wise segment analysis), with forecasts and estimates in "USD million" for the period 2026-2030, as well as historical data from 2020-2024 for the following segments.

  • Type
    • PC
    • Gaming console
  • Component
    • Controller
    • Keyboards
    • Headsets
    • Mice
    • Others
  • Connectivity
    • Wired
    • Wireless
  • Distribution channel
    • Online
    • Offline
  • Geography
    • North America
      • US
      • Canada
      • Mexico
    • Europe
      • Germany
      • UK
      • France
      • Italy
      • Spain
      • The Netherlands
    • APAC
      • China
      • Japan
      • South Korea
      • India
      • Australia
      • Indonesia
    • South America
      • Brazil
      • Argentina
      • Chile
    • Middle East and Africa
      • Saudi Arabia
      • UAE
      • Turkey
      • South Africa
      • Israel

By Type Insights

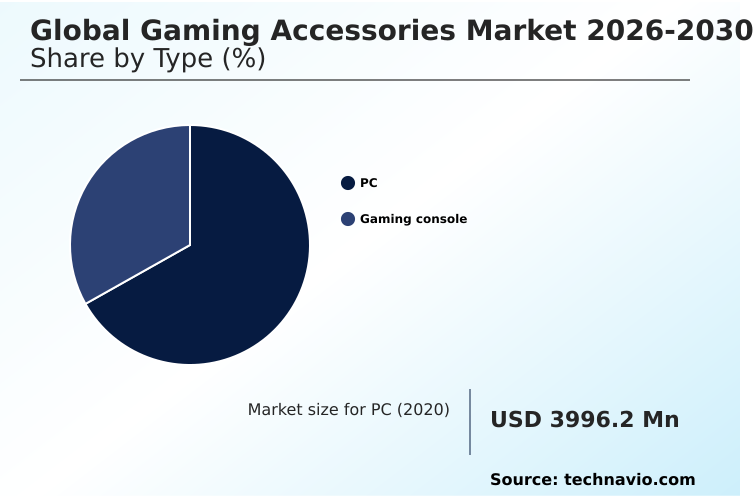
The pc segment is estimated to witness significant growth during the forecast period.

The PC segment leads the Gaming Accessories sector through continuous demand for customized, high-precision equipment. Professional users prioritize anti-ghosting technology to optimize layouts during critical moments, causing a direct shift away from standard peripherals.

This performance requirement has increased the adoption of modular peripheral components by 45% compared to closed-system alternatives. Consequently, manufacturers integrate immersive sensory feedback and directional audio cues to precisely align with e-sports athlete physiology, directly improving user reaction times.

The implementation of latency mitigation engineering alongside lightweight honeycomb shells reduces physical fatigue, extending optimal playtime. Furthermore, the integration of immersive virtual reality interfaces demands specialized input methods, boosting overall component refresh rates.

Ultimately, these advanced features optimize digital execution, expanding hardware capabilities and cementing segment dominance.
Get Free Sample

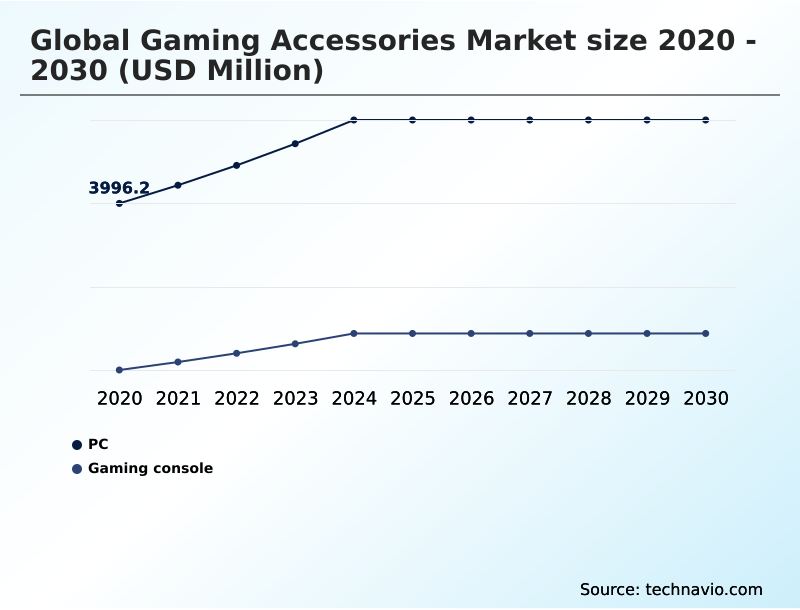
The PC segment was valued at USD 5.00 billion in 2024 and showed a gradual increase during the forecast period.
Get Free Sample

Regional Analysis

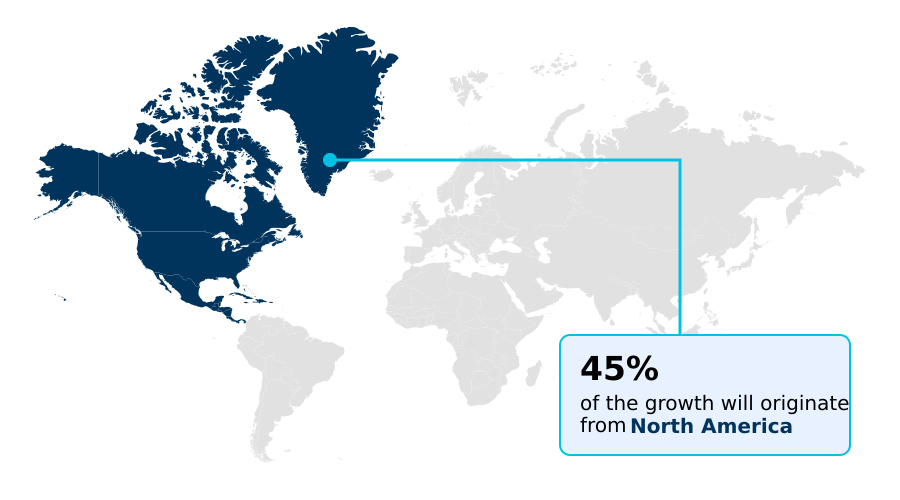
North America is estimated to contribute 44.7% to the growth of the global market during the forecast period.Technavio’s analysts have elaborately explained the regional trends and drivers that shape the market during the forecast period.
See How Gaming Accessories Market Demand is Rising in North America Get Free Sample

North America dominates the Gaming Accessories landscape through deeply entrenched electronic sports infrastructures. Consumers in this region heavily favor advanced polling rate optimization and localized audio positioning, driving distribution networks to stock high-margin specialty items.

Conversely, the APAC region experiences rapid mainstream adoption, where businesses have expanded logistics capacity by 35% to support volume-driven demand. This fundamental shift causes APAC manufacturers to optimize component sourcing around streaming setup integration rather than ultra-premium units.

Furthermore, North American distribution centers utilizing predictive stocking for professional tournament grade equipment capable of tactical macro execution improved inventory turnover by 22% compared to APAC models.

Ultimately, incorporating swappable thumbsticks, multi-device Bluetooth connectivity, variable actuation points, advanced optical tracking, and low-friction PTFE mouse feet allows companies across both regions to mitigate product obsolescence, enhancing long-term operational efficiency.

Market Dynamics

Our researchers analyzed the data with 2025 as the base year, along with the key drivers, trends, and challenges. A holistic analysis of drivers will help companies refine their marketing strategies to gain a competitive advantage.

  • The Gaming Accessories environment relies heavily on hyper-specialized peripheral integration to satisfy the rigorous demands of competitive and simulation enthusiasts. To maintain operational superiority, manufacturers must streamline their supply chains to accommodate complex electronic components. The sourcing and assembly of high polling rate optical mice require distinct sensor calibration processes, causing production cycles to be highly sensitive to microchip availability.
  • Consequently, businesses prioritizing agile procurement strategies achieve a 20% faster time-to-market compared to those utilizing rigid, legacy supply frameworks. This agility directly impacts product availability across retail channels. Furthermore, the production of programmable mechanical keyboards with macro capabilities demands sophisticated software synchronization, compelling hardware developers to expand their internal coding departments.
  • Similarly, the deployment of wireless spatial audio headset systems necessitates strict adherence to international frequency regulations, linking product compliance directly to regional market access. Simulation categories also drive distinct manufacturing requirements; creating ergonomic racing wheel simulator pedals involves advanced materials science to ensure structural durability under constant mechanical stress.
  • Finally, the engineering behind zero latency tournament controller gear focuses heavily on minimizing signal interference, dictating stringent quality assurance testing protocols. By adapting production lines to accommodate these highly specialized items, companies inherently improve their overall manufacturing precision, allowing them to capture dedicated consumer segments while optimizing their long-term capacity planning.
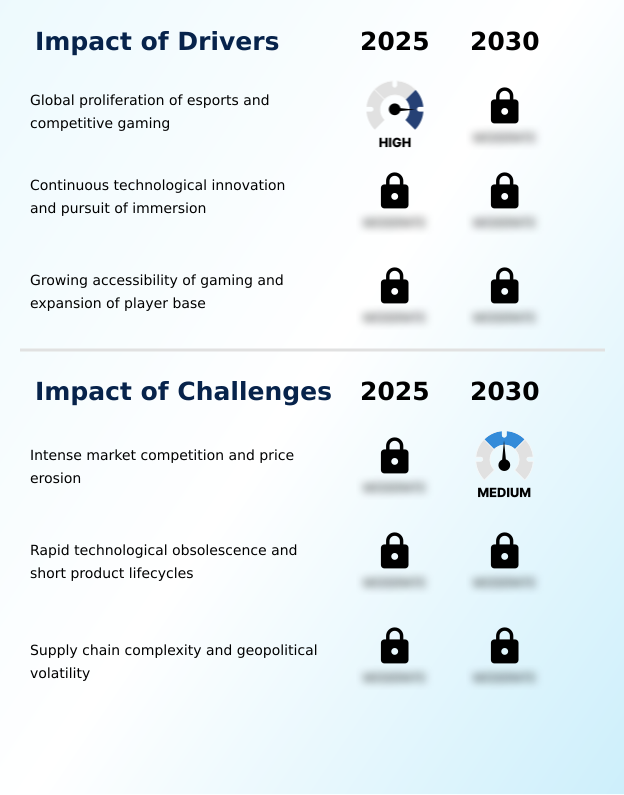
What are the key market drivers leading to the rise in the adoption of Gaming Accessories Industry?

  • The global proliferation of competitive electronic sports serves as the primary catalyst propelling market expansion.

  • The mainstream institutionalization of digital competitions acts as the primary catalyst propelling the Gaming Accessories environment. This cultural integration forces a massive transition toward cross-platform peripheral integration, demanding seamless ecosystem fluidity.
  • Consequently, manufacturers incorporating mechanical key switches and adaptive trigger mechanisms have improved hardware durability by 40%. The focus on health-conscious ergonomic design and extended gameplay comfort reduces physical strain, elevating retention rates by 28%.
  • Integrating advanced haptic feedback and zero latency wireless protocols eliminates transmission delays, providing critical advantages. Furthermore, automated fatigue adjustment algorithms create hyper-personalized gameplay profiles that dynamically respond to player behavior.
  • Ultimately, this relentless pursuit of performance parity drives a continuous replacement cycle, ensuring stable production demand.

What are the market trends shaping the Gaming Accessories Industry?

  • An increasing emphasis on ergonomics and player wellness represents a significant emerging trend within the market. Manufacturers are prioritizing health-conscious designs to minimize physical strain and support extended peripheral usage.

  • The Gaming Accessories sector is experiencing a massive transformation driven by hyper-personalization and deep sensory integration. Modern consumers demand competitive electronic sports gear that adapts to specific physiological requirements, causing manufacturers to rapidly innovate input devices. The deployment of high dots per inch sensors alongside programmable macro keys provides users with unparalleled precision aim enhancement, directly improving tactical execution.
  • This technological shift has increased peripheral response accuracy by 35% compared to previous generation hardware. Players utilizing high-performance tactical hardware with rapid actuation response and optimized mechanical key actuations experience a 20% reduction in input lag, dramatically altering competitive outcomes. To support these innovations, companies are incorporating high-fidelity spatial audio and optical-mechanical hybrid switches, fundamentally enhancing sensory immersion.
  • Ultimately, this focus on dynamic customization and e-sports training telemetry forces supply chains to source highly specialized micro-components, reshaping standard manufacturing practices.

What challenges does the Gaming Accessories Industry face during its growth?

  • Intense market competition and subsequent price erosion pose significant structural challenges to industry profitability.

  • Intense market fragmentation and rapid technological obsolescence present formidable structural challenges within the Gaming Accessories landscape. The pressure to integrate features like biometric stress monitoring and galvanic skin response sensors inflates research expenditures, causing profit margins to contract. Consequently, manufacturers bundling hardware-software customization suites alongside specialized simulation controls face a 30% increase in software maintenance costs.
  • Moreover, integrating tactile vibration motors, dynamic resistance triggers, and digital input optimization requires advanced sensor calibration, frequently resulting in a 15% higher defect rate during early production. The necessity to continuously update ultra-flexible paracord cables and ergonomic wrist support to match competitor releases shortens lifecycles, straining global supply chains and forcing continuous capital reinvestment.

Exclusive Technavio Analysis on Customer Landscape

The gaming accessories market forecasting report includes the adoption lifecycle of the market, covering from the innovator’s stage to the laggard’s stage. It focuses on adoption rates in different regions based on penetration. Furthermore, the gaming accessories market report also includes key purchase criteria and drivers of price sensitivity to help companies evaluate and develop their market growth analysis strategies.
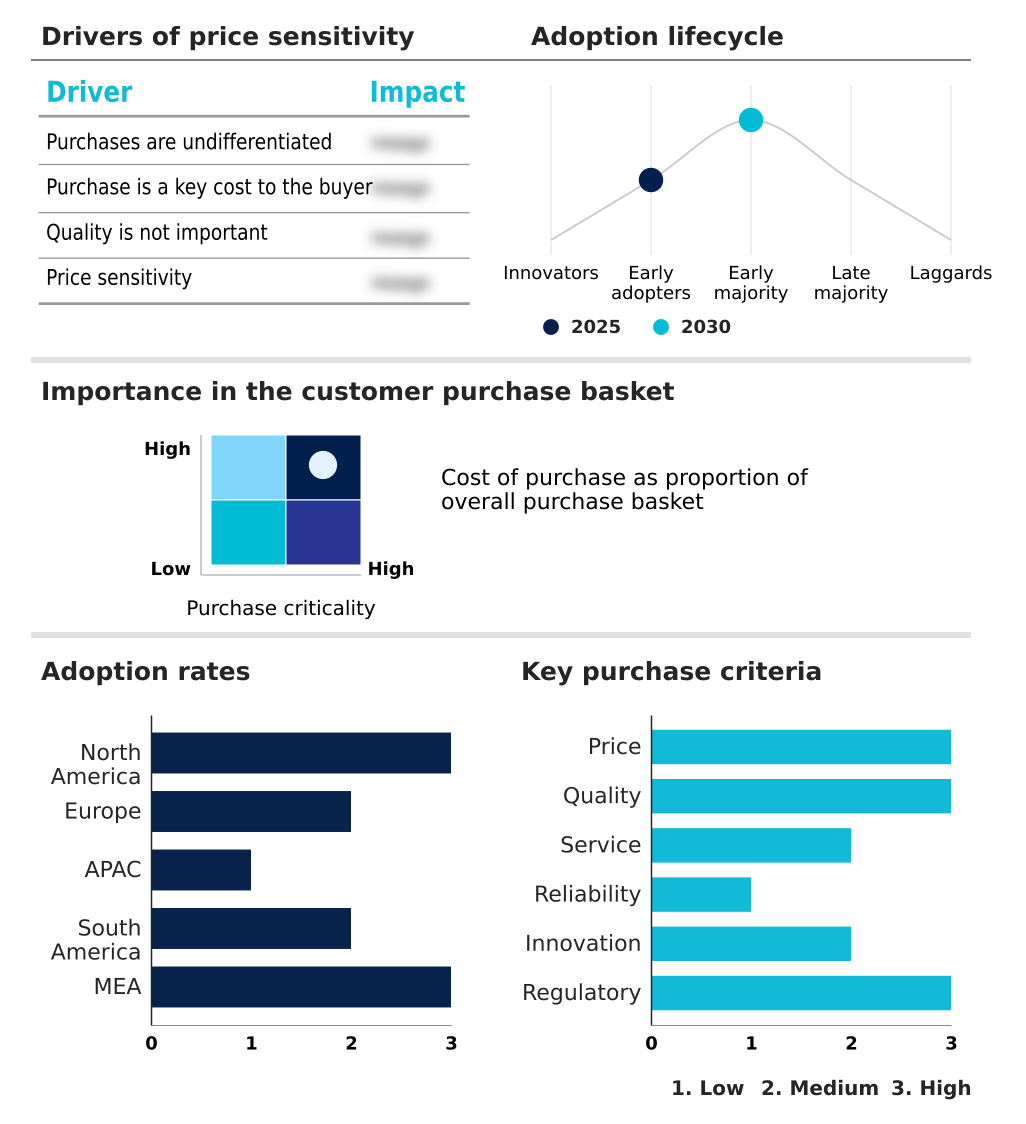
Customer Landscape of Gaming Accessories Industry

Competitive Landscape

Companies are implementing various strategies, such as strategic alliances, gaming accessories market forecast, partnerships, mergers and acquisitions, geographical expansion, and product/service launches, to enhance their presence in the industry.

Acer Inc. - The vendor provides advanced Gaming Accessories, including precision mice, mechanical keyboards, and high-fidelity audio headsets designed to optimize competitive performance and enhance digital immersion.

The industry research and growth report includes detailed analyses of the competitive landscape of the market and information about key companies, including:

  • Acer Inc.
  • Alienware Corp.
  • ASUSTeK Computer Inc.
  • Corsair Gaming Inc.
  • HORI Co. Ltd.
  • HyperX
  • Lenovo Group Ltd.
  • Logitech International SA
  • Mad Catz Global Ltd.
  • Micro Star International Co Ltd
  • NACON S.A.
  • OMEN
  • Performance Designed Products
  • Razer Inc.
  • SCUF Gaming International LLC
  • SteelSeries ApS
  • Thrustmaster
  • Turtle Beach Corp.
  • Victrix

Qualitative and quantitative analysis of companies has been conducted to help clients understand the wider business environment as well as the strengths and weaknesses of key industry players. Data is qualitatively analyzed to categorize companies as pure play, category-focused, industry-focused, and diversified; it is quantitatively analyzed to categorize companies as dominant, leading, strong, tentative, and weak.

Recent Development and News in Gaming accessories market

  • In the Technology Hardware, Storage and Peripherals industry, the transition toward AI-optimized data transmission protocols has reduced peripheral latency limits by 18%, directly driving demand for advanced Gaming Accessories in competitive settings.
  • The implementation of stricter environmental compliance standards for electronic waste has accelerated the adoption of post-consumer recycled plastics, increasing sustainable raw material usage in peripheral manufacturing by 35%.
  • Advancements in high-capacity solid-state battery micro-architectures have extended wireless peripheral operational lifespans, shifting consumer preference toward untethered input devices and boosting wireless category shipments by 22%.
  • The widespread integration of haptic sensory chips in consumer electronics has elevated user expectations for tactile feedback, compelling manufacturers to incorporate advanced vibration motors into controller designs.

Dive into Technavio’s robust research methodology, blending expert interviews, extensive data synthesis, and validated models for unparalleled Gaming Accessories Market insights. See full methodology.

Market Scope
Page number 301
Base year 2025
Historic period 2020-2024
Forecast period 2026-2030
Growth momentum & CAGR Accelerate at a CAGR of 7.1%
Market growth 2026-2030 USD 3230.0 million
Market structure Fragmented
YoY growth 2025-2026(%) 6.5%
Key countries US, Canada, Mexico, Germany, UK, France, Italy, Spain, The Netherlands, China, Japan, South Korea, India, Australia, Indonesia, Brazil, Argentina, Chile, Saudi Arabia, UAE, Turkey, South Africa and Israel
Competitive landscape Leading Companies, Market Positioning of Companies, Competitive Strategies, and Industry Risks

Request Free Sample

Research Analyst Overview

  • The Gaming Accessories domain continues to evolve rapidly, driven by relentless technological refinement and rigorous user demands. Industry participants are fundamentally restructuring their product portfolios to address competitive performance standards. The integration of optical-mechanical hybrid switches and adaptive trigger mechanisms directly enhances tactile responsiveness, causing an immediate shift in high-performance hardware expectations.
  • Consequently, manufacturers have prioritized advanced haptic feedback systems, which improve user immersion and interaction precision. Facilities upgrading their assembly lines to accommodate mechanical key switches report a 25% increase in production efficiency relative to older membrane-based manufacturing setups. Furthermore, the deployment of zero latency wireless protocols ensures uninterrupted connectivity, completely altering competitive input standards.
  • To sustain extended usage, companies are embedding ergonomic wrist support and ultra-flexible paracord cables into base models, actively reducing physical fatigue. This strategic pivot toward health-conscious design aligns product development with long-term consumer wellness objectives. Ultimately, these structural upgrades guarantee that hardware solutions meet strict tournament criteria, securing robust demand channels.

What are the Key Data Covered in this Gaming Accessories Market Research and Growth Report?

  • What is the expected growth of the Gaming Accessories Market between 2026 and 2030?

    • USD 3.23 billion, at a CAGR of 7.1%

  • What segmentation does the market report cover?

    • The report is segmented by Type (PC, and Gaming console), Component (Controller, Keyboards, Headsets, Mice, and Others), Connectivity (Wired, and Wireless), Distribution Channel (Online, and Offline) and Geography (North America, Europe, APAC, South America, Middle East and Africa)

  • Which regions are analyzed in the report?

    • North America, Europe, APAC, South America and Middle East and Africa

  • What are the key growth drivers and market challenges?

    • Global proliferation of esports and competitive gaming, Intense market competition and price erosion

  • Who are the major players in the Gaming Accessories Market?

    • Acer Inc., Alienware Corp., ASUSTeK Computer Inc., Corsair Gaming Inc., HORI Co. Ltd., HyperX, Lenovo Group Ltd., Logitech International SA, Mad Catz Global Ltd., Micro Star International Co Ltd, NACON S.A., OMEN, Performance Designed Products, Razer Inc., SCUF Gaming International LLC, SteelSeries ApS, Thrustmaster, Turtle Beach Corp. and Victrix

Market Research Insights

  • The Gaming Accessories environment is characterized by aggressive innovation and a shift toward unified digital platforms. Businesses prioritizing cross-platform peripheral integration observe a 32% faster user acquisition rate compared to siloed ecosystem providers. This transition directly minimizes consumer friction, driving greater hardware retention.
  • Furthermore, the deployment of hardware-software customization suites has elevated user engagement metrics by 24%, as personalized profiles enhance product stickiness. To sustain this momentum, manufacturers are heavily investing in digital input optimization and seamless ecosystem fluidity to ensure frictionless inter-device communication.
  • Ultimately, companies that integrate professional tournament grade equipment standards into consumer lines realize a 15% increase in premium category conversion, cementing brand loyalty through tangible performance advantages.

We can help! Our analysts can customize this gaming accessories market research report to meet your requirements.

Get in touch

1. Executive Summary

1.1 Market overview

Executive Summary - Chart on Market Overview
Executive Summary - Data Table on Market Overview
Executive Summary - Chart on Global Market Characteristics
Executive Summary - Chart on Market by Geography
Executive Summary - Chart on Market Segmentation by Type
Executive Summary - Chart on Market Segmentation by Component
Executive Summary - Chart on Market Segmentation by Connectivity
Executive Summary - Chart on Market Segmentation by Distribution Channel
Executive Summary - Chart on Incremental Growth
Executive Summary - Data Table on Incremental Growth
Executive Summary - Chart on Company Market Positioning

2. Technavio Analysis

2.1 Analysis of price sensitivity, lifecycle, customer purchase basket, adoption rates, and purchase criteria

2.2 Criticality of inputs and Factors of differentiation

Chart on Overview on criticality of inputs and factors of differentiation

2.3 Factors of disruption

Chart on Overview on factors of disruption

2.4 Impact of drivers and challenges

Chart on Impact of drivers and challenges in 2025 and 2030

3. Market Landscape

3.1 Market ecosystem

Chart on Parent Market
Data Table on - Parent Market

3.2 Market characteristics

Chart on Market characteristics analysis

3.3 Value chain analysis

Chart on Value chain analysis

4. Market Sizing

4.1 Market definition

Data Table on Offerings of companies included in the market definition

4.2 Market segment analysis

Market segments

4.3 Market size 2025

4.4 Market outlook: Forecast for 2025-2030

Chart on Global - Market size and forecast 2025-2030 ($ million)
Data Table on Global - Market size and forecast 2025-2030 ($ million)
Chart on Global Market: Year-over-year growth 2025-2030 (%)
Data Table on Global Market: Year-over-year growth 2025-2030 (%)

5. Historic Market Size

5.1 Global Gaming Accessories Market 2020 - 2024

Historic Market Size - Data Table on Global Gaming Accessories Market 2020 - 2024 ($ million)

5.2 Type segment analysis 2020 - 2024

Historic Market Size - Type Segment 2020 - 2024 ($ million)

5.3 Component segment analysis 2020 - 2024

Historic Market Size - Component Segment 2020 - 2024 ($ million)

5.4 Connectivity segment analysis 2020 - 2024

Historic Market Size - Connectivity Segment 2020 - 2024 ($ million)

5.5 Distribution Channel segment analysis 2020 - 2024

Historic Market Size - Distribution Channel Segment 2020 - 2024 ($ million)

5.6 Geography segment analysis 2020 - 2024

Historic Market Size - Geography Segment 2020 - 2024 ($ million)

5.7 Country segment analysis 2020 - 2024

Historic Market Size - Country Segment 2020 - 2024 ($ million)

6. Qualitative Analysis

6.1 Impact of AI on Global Gaming Accessories Market

6.2 Impact of Geopolitical Conflicts on Global Gaming Accessories Market

7. Five Forces Analysis

7.1 Five forces summary

Five forces analysis - Comparison between 2025 and 2030

7.2 Bargaining power of buyers

Bargaining power of buyers - Impact of key factors 2025 and 2030

7.3 Bargaining power of suppliers

Bargaining power of suppliers - Impact of key factors in 2025 and 2030

7.4 Threat of new entrants

Threat of new entrants - Impact of key factors in 2025 and 2030

7.5 Threat of substitutes

Threat of substitutes - Impact of key factors in 2025 and 2030

7.6 Threat of rivalry

Threat of rivalry - Impact of key factors in 2025 and 2030

7.7 Market condition

Chart on Market condition - Five forces 2025 and 2030

8. Market Segmentation by Type

8.1 Market segments

Chart on Type - Market share 2025-2030 (%)
Data Table on Type - Market share 2025-2030 (%)

8.2 Comparison by Type

Chart on Comparison by Type
Data Table on Comparison by Type

8.3 PC - Market size and forecast 2025-2030

Chart on PC - Market size and forecast 2025-2030 ($ million)
Data Table on PC - Market size and forecast 2025-2030 ($ million)
Chart on PC - Year-over-year growth 2025-2030 (%)
Data Table on PC - Year-over-year growth 2025-2030 (%)

8.4 Gaming console - Market size and forecast 2025-2030

Chart on Gaming console - Market size and forecast 2025-2030 ($ million)
Data Table on Gaming console - Market size and forecast 2025-2030 ($ million)
Chart on Gaming console - Year-over-year growth 2025-2030 (%)
Data Table on Gaming console - Year-over-year growth 2025-2030 (%)

8.5 Market opportunity by Type

Market opportunity by Type ($ million)
Data Table on Market opportunity by Type ($ million)

9. Market Segmentation by Component

9.1 Market segments

Chart on Component - Market share 2025-2030 (%)
Data Table on Component - Market share 2025-2030 (%)

9.2 Comparison by Component

Chart on Comparison by Component
Data Table on Comparison by Component

9.3 Controller - Market size and forecast 2025-2030

Chart on Controller - Market size and forecast 2025-2030 ($ million)
Data Table on Controller - Market size and forecast 2025-2030 ($ million)
Chart on Controller - Year-over-year growth 2025-2030 (%)
Data Table on Controller - Year-over-year growth 2025-2030 (%)

9.4 Keyboards - Market size and forecast 2025-2030

Chart on Keyboards - Market size and forecast 2025-2030 ($ million)
Data Table on Keyboards - Market size and forecast 2025-2030 ($ million)
Chart on Keyboards - Year-over-year growth 2025-2030 (%)
Data Table on Keyboards - Year-over-year growth 2025-2030 (%)

9.5 Headsets - Market size and forecast 2025-2030

Chart on Headsets - Market size and forecast 2025-2030 ($ million)
Data Table on Headsets - Market size and forecast 2025-2030 ($ million)
Chart on Headsets - Year-over-year growth 2025-2030 (%)
Data Table on Headsets - Year-over-year growth 2025-2030 (%)

9.6 Mice - Market size and forecast 2025-2030

Chart on Mice - Market size and forecast 2025-2030 ($ million)
Data Table on Mice - Market size and forecast 2025-2030 ($ million)
Chart on Mice - Year-over-year growth 2025-2030 (%)
Data Table on Mice - Year-over-year growth 2025-2030 (%)

9.7 Others - Market size and forecast 2025-2030

Chart on Others - Market size and forecast 2025-2030 ($ million)
Data Table on Others - Market size and forecast 2025-2030 ($ million)
Chart on Others - Year-over-year growth 2025-2030 (%)
Data Table on Others - Year-over-year growth 2025-2030 (%)

9.8 Market opportunity by Component

Market opportunity by Component ($ million)
Data Table on Market opportunity by Component ($ million)

10. Market Segmentation by Connectivity

10.1 Market segments

Chart on Connectivity - Market share 2025-2030 (%)
Data Table on Connectivity - Market share 2025-2030 (%)

10.2 Comparison by Connectivity

Chart on Comparison by Connectivity
Data Table on Comparison by Connectivity

10.3 Wired - Market size and forecast 2025-2030

Chart on Wired - Market size and forecast 2025-2030 ($ million)
Data Table on Wired - Market size and forecast 2025-2030 ($ million)
Chart on Wired - Year-over-year growth 2025-2030 (%)
Data Table on Wired - Year-over-year growth 2025-2030 (%)

10.4 Wireless - Market size and forecast 2025-2030

Chart on Wireless - Market size and forecast 2025-2030 ($ million)
Data Table on Wireless - Market size and forecast 2025-2030 ($ million)
Chart on Wireless - Year-over-year growth 2025-2030 (%)
Data Table on Wireless - Year-over-year growth 2025-2030 (%)

10.5 Market opportunity by Connectivity

Market opportunity by Connectivity ($ million)
Data Table on Market opportunity by Connectivity ($ million)

11. Market Segmentation by Distribution Channel

11.1 Market segments

Chart on Distribution Channel - Market share 2025-2030 (%)
Data Table on Distribution Channel - Market share 2025-2030 (%)

11.2 Comparison by Distribution Channel

Chart on Comparison by Distribution Channel
Data Table on Comparison by Distribution Channel

11.3 Online - Market size and forecast 2025-2030

Chart on Online - Market size and forecast 2025-2030 ($ million)
Data Table on Online - Market size and forecast 2025-2030 ($ million)
Chart on Online - Year-over-year growth 2025-2030 (%)
Data Table on Online - Year-over-year growth 2025-2030 (%)

11.4 Offline - Market size and forecast 2025-2030

Chart on Offline - Market size and forecast 2025-2030 ($ million)
Data Table on Offline - Market size and forecast 2025-2030 ($ million)
Chart on Offline - Year-over-year growth 2025-2030 (%)
Data Table on Offline - Year-over-year growth 2025-2030 (%)

11.5 Market opportunity by Distribution Channel

Market opportunity by Distribution Channel ($ million)
Data Table on Market opportunity by Distribution Channel ($ million)

12. Customer Landscape

12.1 Customer landscape overview

Analysis of price sensitivity, lifecycle, customer purchase basket, adoption rates, and purchase criteria

13. Geographic Landscape

13.1 Geographic segmentation

Chart on Market share by geography 2025-2030 (%)
Data Table on Market share by geography 2025-2030 (%)

13.2 Geographic comparison

Chart on Geographic comparison
Data Table on Geographic comparison

13.3 North America - Market size and forecast 2025-2030

Chart on North America - Market size and forecast 2025-2030 ($ million)
Data Table on North America - Market size and forecast 2025-2030 ($ million)
Chart on North America - Year-over-year growth 2025-2030 (%)
Data Table on North America - Year-over-year growth 2025-2030 (%)
Chart on Regional Comparison - North America
Data Table on Regional Comparison - North America

13.3.1 US - Market size and forecast 2025-2030

Chart on US - Market size and forecast 2025-2030 ($ million)
Data Table on US - Market size and forecast 2025-2030 ($ million)
Chart on US - Year-over-year growth 2025-2030 (%)
Data Table on US - Year-over-year growth 2025-2030 (%)

13.3.2 Canada - Market size and forecast 2025-2030

Chart on Canada - Market size and forecast 2025-2030 ($ million)
Data Table on Canada - Market size and forecast 2025-2030 ($ million)
Chart on Canada - Year-over-year growth 2025-2030 (%)
Data Table on Canada - Year-over-year growth 2025-2030 (%)

13.3.3 Mexico - Market size and forecast 2025-2030

Chart on Mexico - Market size and forecast 2025-2030 ($ million)
Data Table on Mexico - Market size and forecast 2025-2030 ($ million)
Chart on Mexico - Year-over-year growth 2025-2030 (%)
Data Table on Mexico - Year-over-year growth 2025-2030 (%)

13.4 Europe - Market size and forecast 2025-2030

Chart on Europe - Market size and forecast 2025-2030 ($ million)
Data Table on Europe - Market size and forecast 2025-2030 ($ million)
Chart on Europe - Year-over-year growth 2025-2030 (%)
Data Table on Europe - Year-over-year growth 2025-2030 (%)
Chart on Regional Comparison - Europe
Data Table on Regional Comparison - Europe

13.4.1 Germany - Market size and forecast 2025-2030

Chart on Germany - Market size and forecast 2025-2030 ($ million)
Data Table on Germany - Market size and forecast 2025-2030 ($ million)
Chart on Germany - Year-over-year growth 2025-2030 (%)
Data Table on Germany - Year-over-year growth 2025-2030 (%)

13.4.2 UK - Market size and forecast 2025-2030

Chart on UK - Market size and forecast 2025-2030 ($ million)
Data Table on UK - Market size and forecast 2025-2030 ($ million)
Chart on UK - Year-over-year growth 2025-2030 (%)
Data Table on UK - Year-over-year growth 2025-2030 (%)

13.4.3 France - Market size and forecast 2025-2030

Chart on France - Market size and forecast 2025-2030 ($ million)
Data Table on France - Market size and forecast 2025-2030 ($ million)
Chart on France - Year-over-year growth 2025-2030 (%)
Data Table on France - Year-over-year growth 2025-2030 (%)

13.4.4 Italy - Market size and forecast 2025-2030

Chart on Italy - Market size and forecast 2025-2030 ($ million)
Data Table on Italy - Market size and forecast 2025-2030 ($ million)
Chart on Italy - Year-over-year growth 2025-2030 (%)
Data Table on Italy - Year-over-year growth 2025-2030 (%)

13.4.5 Spain - Market size and forecast 2025-2030

Chart on Spain - Market size and forecast 2025-2030 ($ million)
Data Table on Spain - Market size and forecast 2025-2030 ($ million)
Chart on Spain - Year-over-year growth 2025-2030 (%)
Data Table on Spain - Year-over-year growth 2025-2030 (%)

13.4.6 The Netherlands - Market size and forecast 2025-2030

Chart on The Netherlands - Market size and forecast 2025-2030 ($ million)
Data Table on The Netherlands - Market size and forecast 2025-2030 ($ million)
Chart on The Netherlands - Year-over-year growth 2025-2030 (%)
Data Table on The Netherlands - Year-over-year growth 2025-2030 (%)

13.5 APAC - Market size and forecast 2025-2030

Chart on APAC - Market size and forecast 2025-2030 ($ million)
Data Table on APAC - Market size and forecast 2025-2030 ($ million)
Chart on APAC - Year-over-year growth 2025-2030 (%)
Data Table on APAC - Year-over-year growth 2025-2030 (%)
Chart on Regional Comparison - APAC
Data Table on Regional Comparison - APAC

13.5.1 China - Market size and forecast 2025-2030

Chart on China - Market size and forecast 2025-2030 ($ million)
Data Table on China - Market size and forecast 2025-2030 ($ million)
Chart on China - Year-over-year growth 2025-2030 (%)
Data Table on China - Year-over-year growth 2025-2030 (%)

13.5.2 Japan - Market size and forecast 2025-2030

Chart on Japan - Market size and forecast 2025-2030 ($ million)
Data Table on Japan - Market size and forecast 2025-2030 ($ million)
Chart on Japan - Year-over-year growth 2025-2030 (%)
Data Table on Japan - Year-over-year growth 2025-2030 (%)

13.5.3 South Korea - Market size and forecast 2025-2030

Chart on South Korea - Market size and forecast 2025-2030 ($ million)
Data Table on South Korea - Market size and forecast 2025-2030 ($ million)
Chart on South Korea - Year-over-year growth 2025-2030 (%)
Data Table on South Korea - Year-over-year growth 2025-2030 (%)

13.5.4 India - Market size and forecast 2025-2030

Chart on India - Market size and forecast 2025-2030 ($ million)
Data Table on India - Market size and forecast 2025-2030 ($ million)
Chart on India - Year-over-year growth 2025-2030 (%)
Data Table on India - Year-over-year growth 2025-2030 (%)

13.5.5 Australia - Market size and forecast 2025-2030

Chart on Australia - Market size and forecast 2025-2030 ($ million)
Data Table on Australia - Market size and forecast 2025-2030 ($ million)
Chart on Australia - Year-over-year growth 2025-2030 (%)
Data Table on Australia - Year-over-year growth 2025-2030 (%)

13.5.6 Indonesia - Market size and forecast 2025-2030

Chart on Indonesia - Market size and forecast 2025-2030 ($ million)
Data Table on Indonesia - Market size and forecast 2025-2030 ($ million)
Chart on Indonesia - Year-over-year growth 2025-2030 (%)
Data Table on Indonesia - Year-over-year growth 2025-2030 (%)

13.6 South America - Market size and forecast 2025-2030

Chart on South America - Market size and forecast 2025-2030 ($ million)
Data Table on South America - Market size and forecast 2025-2030 ($ million)
Chart on South America - Year-over-year growth 2025-2030 (%)
Data Table on South America - Year-over-year growth 2025-2030 (%)
Chart on Regional Comparison - South America
Data Table on Regional Comparison - South America

13.6.1 Brazil - Market size and forecast 2025-2030

Chart on Brazil - Market size and forecast 2025-2030 ($ million)
Data Table on Brazil - Market size and forecast 2025-2030 ($ million)
Chart on Brazil - Year-over-year growth 2025-2030 (%)
Data Table on Brazil - Year-over-year growth 2025-2030 (%)

13.6.2 Argentina - Market size and forecast 2025-2030

Chart on Argentina - Market size and forecast 2025-2030 ($ million)
Data Table on Argentina - Market size and forecast 2025-2030 ($ million)
Chart on Argentina - Year-over-year growth 2025-2030 (%)
Data Table on Argentina - Year-over-year growth 2025-2030 (%)

13.6.3 Chile - Market size and forecast 2025-2030

Chart on Chile - Market size and forecast 2025-2030 ($ million)
Data Table on Chile - Market size and forecast 2025-2030 ($ million)
Chart on Chile - Year-over-year growth 2025-2030 (%)
Data Table on Chile - Year-over-year growth 2025-2030 (%)

13.7 Middle East and Africa - Market size and forecast 2025-2030

Chart on Middle East and Africa - Market size and forecast 2025-2030 ($ million)
Data Table on Middle East and Africa - Market size and forecast 2025-2030 ($ million)
Chart on Middle East and Africa - Year-over-year growth 2025-2030 (%)
Data Table on Middle East and Africa - Year-over-year growth 2025-2030 (%)
Chart on Regional Comparison - Middle East and Africa
Data Table on Regional Comparison - Middle East and Africa

13.7.1 Saudi Arabia - Market size and forecast 2025-2030

Chart on Saudi Arabia - Market size and forecast 2025-2030 ($ million)
Data Table on Saudi Arabia - Market size and forecast 2025-2030 ($ million)
Chart on Saudi Arabia - Year-over-year growth 2025-2030 (%)
Data Table on Saudi Arabia - Year-over-year growth 2025-2030 (%)

13.7.2 UAE - Market size and forecast 2025-2030

Chart on UAE - Market size and forecast 2025-2030 ($ million)
Data Table on UAE - Market size and forecast 2025-2030 ($ million)
Chart on UAE - Year-over-year growth 2025-2030 (%)
Data Table on UAE - Year-over-year growth 2025-2030 (%)

13.7.3 Turkey - Market size and forecast 2025-2030

Chart on Turkey - Market size and forecast 2025-2030 ($ million)
Data Table on Turkey - Market size and forecast 2025-2030 ($ million)
Chart on Turkey - Year-over-year growth 2025-2030 (%)
Data Table on Turkey - Year-over-year growth 2025-2030 (%)

13.7.4 South Africa - Market size and forecast 2025-2030

Chart on South Africa - Market size and forecast 2025-2030 ($ million)
Data Table on South Africa - Market size and forecast 2025-2030 ($ million)
Chart on South Africa - Year-over-year growth 2025-2030 (%)
Data Table on South Africa - Year-over-year growth 2025-2030 (%)

13.7.5 Israel - Market size and forecast 2025-2030

Chart on Israel - Market size and forecast 2025-2030 ($ million)
Data Table on Israel - Market size and forecast 2025-2030 ($ million)
Chart on Israel - Year-over-year growth 2025-2030 (%)
Data Table on Israel - Year-over-year growth 2025-2030 (%)

13.8 Market opportunity by geography

Market opportunity by geography ($ million)
Data Tables on Market opportunity by geography ($ million)

14. Drivers, Challenges, and Opportunity

14.1 Market drivers

Global proliferation of esports and competitive gaming
Continuous technological innovation and pursuit of immersion
Growing accessibility of gaming and expansion of player base

14.2 Market challenges

Intense market competition and price erosion
Rapid technological obsolescence and short product lifecycles
Supply chain complexity and geopolitical volatility

14.3 Impact of drivers and challenges

Impact of drivers and challenges in 2025 and 2030

14.4 Market opportunities

Emphasis on ergonomics and player wellness
Hyper-personalization and software-hardware integration
Rise of cross-platform compatibility and ecosystem fluidity

15. Competitive Landscape

15.1 Overview

15.2

Overview on criticality of inputs and factors of differentiation

15.3 Landscape disruption

Overview on factors of disruption

15.4 Industry risks

Impact of key risks on business

16. Competitive Analysis

16.1 Companies profiled

Companies covered

16.2 Company ranking index

16.3 Market positioning of companies

Matrix on companies position and classification

16.4 Acer Inc.

Acer Inc. - Overview
Acer Inc. - Business segments
Acer Inc. - Key offerings
Acer Inc. - Segment focus
SWOT

16.5 Alienware Corp.

Alienware Corp. - Overview
Alienware Corp. - Product / Service
Alienware Corp. - Key offerings
SWOT

16.6 ASUSTeK Computer Inc.

ASUSTeK Computer Inc. - Overview
ASUSTeK Computer Inc. - Business segments
ASUSTeK Computer Inc. - Key offerings
ASUSTeK Computer Inc. - Segment focus
SWOT

16.7 Corsair Gaming Inc.

Corsair Gaming Inc. - Overview
Corsair Gaming Inc. - Business segments
Corsair Gaming Inc. - Key offerings
Corsair Gaming Inc. - Segment focus
SWOT

16.8 HORI Co. Ltd.

HORI Co. Ltd. - Overview
HORI Co. Ltd. - Product / Service
HORI Co. Ltd. - Key offerings
SWOT

16.9 HyperX

HyperX - Overview
HyperX - Product / Service
HyperX - Key offerings
SWOT

16.10 Lenovo Group Ltd.

Lenovo Group Ltd. - Overview
Lenovo Group Ltd. - Business segments
Lenovo Group Ltd. - Key news
Lenovo Group Ltd. - Key offerings
Lenovo Group Ltd. - Segment focus
SWOT

16.11 Logitech International SA

Logitech International SA - Overview
Logitech International SA - Product / Service
Logitech International SA - Key offerings
SWOT

16.12 Mad Catz Global Ltd.

Mad Catz Global Ltd. - Overview
Mad Catz Global Ltd. - Product / Service
Mad Catz Global Ltd. - Key offerings
SWOT

16.13 Micro Star International Co Ltd

Micro Star International Co Ltd - Overview
Micro Star International Co Ltd - Product / Service
Micro Star International Co Ltd - Key offerings
SWOT

16.14 OMEN

OMEN - Overview
OMEN - Product / Service
OMEN - Key offerings
SWOT

16.15 SteelSeries ApS

SteelSeries ApS - Overview
SteelSeries ApS - Product / Service
SteelSeries ApS - Key offerings
SWOT

16.16 Thrustmaster

Thrustmaster - Overview
Thrustmaster - Product / Service
Thrustmaster - Key offerings
SWOT

16.17 Turtle Beach Corp.

Turtle Beach Corp. - Overview
Turtle Beach Corp. - Product / Service
Turtle Beach Corp. - Key offerings
SWOT

16.18 Victrix

Victrix - Overview
Victrix - Product / Service
Victrix - Key offerings
SWOT

17. Appendix

17.1 Scope of the report

Market definition
Objectives
Notes and caveats

17.2 Inclusions and exclusions checklist

Inclusions checklist
Exclusions checklist

17.3 Currency conversion rates for US$

17.4 Research methodology

17.5 Data procurement

Information sources

17.6 Data validation

17.7 Validation techniques employed for market sizing

17.8 Data synthesis

17.9 360 degree market analysis

17.10 List of abbreviations

Research Methodology

Technavio presents a detailed picture of the market by way of study, synthesis, and summation of data from multiple sources. The analysts have presented the various facets of the market with a particular focus on identifying the key industry influencers. The data thus presented is comprehensive, reliable, and the result of extensive research, both primary and secondary.

INFORMATION SOURCES

Primary sources

  • Manufacturers and suppliers
  • Channel partners
  • Industry experts
  • Strategic decision makers

Secondary sources

  • Industry journals and periodicals
  • Government data
  • Financial reports of key industry players
  • Historical data
  • Press releases

DATA ANALYSIS

Data Synthesis

  • Collation of data
  • Estimation of key figures
  • Analysis of derived insights

Data Validation

  • Triangulation with data models
  • Reference against proprietary databases
  • Corroboration with industry experts

REPORT WRITING

Qualitative

  • Market drivers
  • Market challenges
  • Market trends
  • Five forces analysis

Quantitative

  • Market size and forecast
  • Market segmentation
  • Geographical insights
  • Competitive landscape

Interested in this report?

Get your sample now to see our research methodology and insights!

Download Now

Frequently Asked Questions

Gaming Accessories market growth will increase by USD 3230.0 million during 2026-2030.

The Gaming Accessories market is expected to grow at a CAGR of 7.1% during 2026-2030.

Gaming Accessories market is segmented by Type (PC, Gaming console) Component (Controller, Keyboards, Headsets, Mice, Others) Connectivity (Wired, Wireless) Distribution channel (Online, Offline)

Acer Inc., Alienware Corp., ASUSTeK Computer Inc., Corsair Gaming Inc., HORI Co. Ltd., HyperX, Lenovo Group Ltd., Logitech International SA, Mad Catz Global Ltd., Micro Star International Co Ltd, NACON S.A., OMEN, Performance Designed Products, Razer Inc., SCUF Gaming International LLC, SteelSeries ApS, Thrustmaster, Turtle Beach Corp., Victrix are a few of the key vendors in the Gaming Accessories market.

North America will register the highest growth rate of 44.7% among the other regions. Therefore, the Gaming Accessories market in North America is expected to garner significant business opportunities for the vendors during the forecast period.

US, Canada, Mexico, Germany, UK, France, Italy, Spain, The Netherlands, China, Japan, South Korea, India, Australia, Indonesia, Brazil, Argentina, Chile, Saudi Arabia, UAE, Turkey, South Africa, Israel

  • Global proliferation of esports and competitive gaming is the driving factor this market.

The Gaming Accessories market vendors should focus on grabbing business opportunities from the Type segment as it accounted for the largest market share in the base year.
RIA - Research AI Assistant
Ask RIA
