Gear Pump Market Size 2025-2029
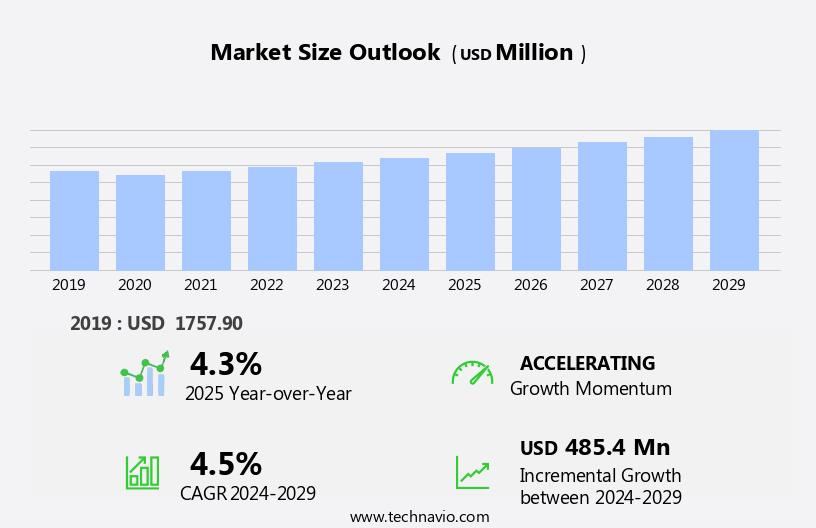
The gear pump market size is forecast to increase by USD 485.4 million at a CAGR of 4.5% between 2024 and 2029.
- The market is driven by the mechanization of agriculture and the expansion of the agriculture machinery industry. The increasing adoption of modern farming techniques and technologies, particularly in developing economies, fuels the demand for efficient and reliable gear pumps in irrigation systems and agricultural machinery. Additionally, rising investments in chemical manufacturing facilities in emerging economies contribute to market growth, as these industries require large quantities of pumps for their operations.
- Companies in the market must navigate these challenges by exploring new opportunities in agriculture and other industries, as well as improving the efficiency and durability of their products to meet evolving customer needs. However, the market faces challenges, including the contraction of the mining industry in China, a significant consumer of gear pumps, due to regulatory changes and economic factors. The gear pumps market encompasses various end-use industries, including construction equipment and the automotive sector.
What will be the Size of the Gear Pump Market during the forecast period?
Explore in-depth regional segment analysis with market size data - historical 2019-2023 and forecasts 2025-2029 - in the full report.
Request Free Sample
In the construction sector, the demand for gear pumps is driven by the need for efficient pump solutions in heavy-duty applications, such as those found in mining operations like Porcupine Mine. The industrial pump industry also relies heavily on gear pumps for moving viscous fluids in sectors like chlor alkali production and water treatment activities. The automotive sector utilizes gear pumps for hydraulic systems, ensuring smooth operation of intermeshing gears in automobiles. Meanwhile, the agricultural machinery sector benefits from the energy efficiency of positive displacement pumps, which are often used to transport fluids in farming equipment.
The market for gear pumps continues to evolve, with a growing focus on ethylene dichloride production and wastewater treatment plants. As industries seek more sustainable and cost-effective solutions, gear pumps are increasingly being adopted for their ability to handle a wide range of applications and deliver reliable performance. Overall, the gear pumps market is a dynamic and essential component of numerous industries, offering innovative pump solutions for diverse applications.
How is this Gear Pump Industry segmented?
The gear pump industry research report provides comprehensive data (region-wise segment analysis), with forecasts and estimates in "USD million" for the period 2025-2029, as well as historical data from 2019-2023 for the following segments.
- End-user
- Heavy industry sector
- Agriculture and forestry
- Automotive
- Others
- Type
- External gear pump
- Internal gear pump
- Capacity
- 100-300 bar
- Less than 100 bar
- Above 300 bar
- Material
- Cast iron
- Stainless steel
- Bronze
- Other alloys
- Geography
- North America
- US
- Canada
- Europe
- France
- Germany
- Italy
- UK
- APAC
- China
- India
- Japan
- South Korea
- Rest of World (ROW)
- North America
By End-user Insights
The Heavy industry sector segment is estimated to witness significant growth during the forecast period. The market encompasses the demand for pumps utilized in capital-intensive industries such as mining, infrastructure, and construction. The primary driver of this market is the growth of these sectors, which necessitates the use of high-performance pumps in heavy industrial machinery. These pumps contribute to energy savings and efficient machinery operation. Water scarcity and environmental sustainability are significant trends influencing the market, with an increasing focus on water treatment activities and customized solutions for various applications. The petrochemical industry, including projects like Porcupine Mine and Chlor alkali production, relies heavily on gear pumps for chemical processing and transportation of viscous fluids.
Smart manufacturing practices and Industry 4.0 integration have led to advancements in gear pump technology, enhancing energy efficiency and reducing noise generation. The automotive sector and agricultural machinery also utilize gear pumps for various applications, such as hydraulic systems and fuel transport. The pandemic restrictions have impacted various industries, leading to fluctuations in demand for gear pumps. However, the market is expected to recover as industrial activity resumes. Petrochemical manufacturers and construction equipment manufacturers remain key players in the market, with a focus on energy-efficient solutions for their operations. Gear pumps are used in various industries, including the chemical processing sector, plastic goods manufacturing, and household goods production.
The market for gear pumps is diverse, catering to various applications, from diesel oil transportation in the mining sector to lubricating oil circulation in the automotive industry. The market is expected to grow, driven by the increasing demand for efficient and sustainable pump solutions.
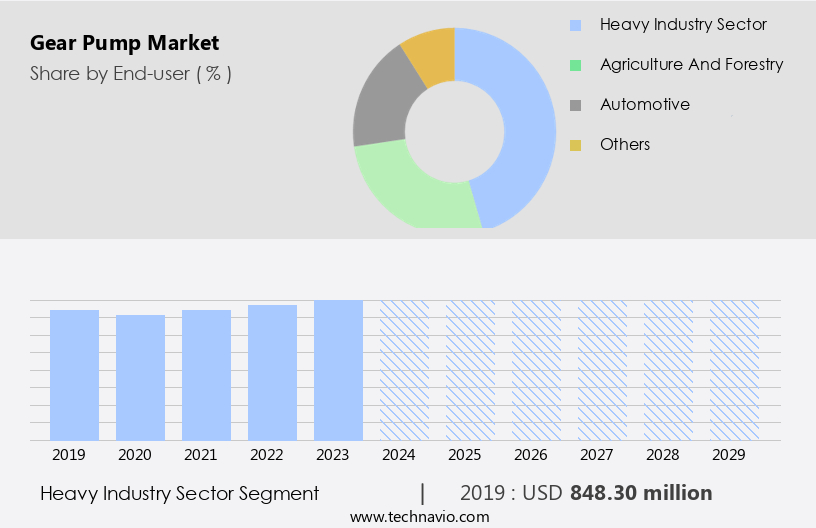
The Heavy industry sector segment was valued at USD 848.30 million in 2019 and showed a gradual increase during the forecast period.
The Gear Pump Market is gaining significant traction, fueled by growth in petrochemical projects and the expansion of interstate crude pipeline infrastructure. These sectors demand robust and precise pumping systems, making hydraulic gear pump technology essential for reliable fluid transfer under high-pressure conditions. Additionally, as industries prioritize sustainability, there's a rising emphasis on energy efficient solutions that reduce operational costs and environmental impact. Gear pumps are increasingly integrated into systems requiring low maintenance, high efficiency, and compact design.
Regional Analysis
APAC is estimated to contribute 40% to the growth of the global market during the forecast period.Technavio's analysts have elaborately explained the regional trends and drivers that shape the market during the forecast period.
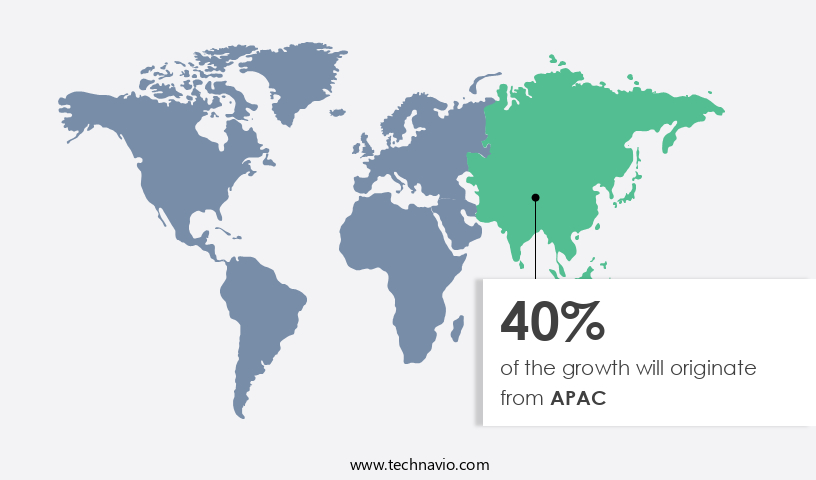
The market in APAC is experiencing significant growth due to the increasing industrial activity and infrastructure projects in the region. In the construction sector, the adoption of advanced machinery and material-handling equipment is on the rise, driving the demand for gear pumps in the region. Moreover, the petrochemical industry's expansion, particularly in countries like China and India, is contributing to the market's growth. For instance, the Porcupine Mine in Canada's expansion will require the use of large quantities of gear pumps for the transportation of minerals. The trend towards energy efficiency and environmental sustainability is also influencing the market. Gear pumps' ability to handle viscous fluids and mixed chemicals makes them an ideal choice for various applications, including water treatment activities and chemical production.
In the water management sector, gear pumps are used in wastewater treatment plants and interstate crude pipelines. The petrochemical industry's environmental concerns have led to the adoption of gear pumps in place of traditional pumps due to their energy efficiency and lower noise generation. The automotive sector is another significant end-user, with gear pumps used in various applications, including Maple cream machinery and diesel oil transportation. The industrial pump industry's shift towards Industry 4.0 and customized solutions is also driving the market's growth. Companies such as Concentric AB are investing in research and development to offer advanced gear pumps with intermeshing gears that provide better efficiency and reliability.
The market's growth is further boosted by the increasing demand for energy-efficient solutions in various industries, including plastic goods, household goods, and chemical processing. However, the pandemic restrictions have impacted the market's growth, particularly in the automotive sector and construction equipment industry. Nevertheless, the market is expected to recover as industrial activity resumes, and the demand for gear pumps continues to grow. The gear pumps market is a significant segment of the industrial pump industry, catering to various sectors including construction, water treatment, and the automotive industry.
Market Dynamics
Our researchers analyzed the data with 2024 as the base year, along with the key drivers, trends, and challenges. A holistic analysis of drivers will help companies refine their marketing strategies to gain a competitive advantage.
What are the Gear Pump market drivers leading to the rise in the adoption of Industry?
- The mechanization of agriculture and the subsequent growth of the agriculture machinery industry serve as the primary drivers of the market. Gear pumps play a significant role in various industries, including the automotive sector, infrastructure projects, petrochemical manufacturers, and the chemical processing sector. In the automotive industry, gear pumps are used in fuel systems, hydraulic systems, and cooling systems. In infrastructure projects, they are employed for water management and construction equipment. In the petrochemical and chemical processing sectors, gear pumps are utilized in the transportation and processing of substances such as ethylene dichloride and sodium silicate. The global agricultural sector also relies on gear pumps, particularly in tractors, combine and forage harvesters, field sprayers, poultry house machinery, and specialized harvesting machinery.
- Despite the slow evolution of electronic integration in agriculture, the sector needs to increase total factor productivity (TFP) to meet the projected agricultural production requirements by 2050. This will necessitate the mechanization of various agricultural practices, leading to an increased adoption rate of mechanized agricultural machinery, including gear pump-equipped tractors, automatic seed dispensers, and harvesting machines. Gear pumps' versatility and reliability make them a preferred choice for numerous applications across various industries. Their ability to handle high pressure and flow rates, combined with their robust design, ensures their long-term durability and efficiency. As the demand for mechanized machinery continues to grow across various sectors, the market for gear pumps is expected to expand accordingly.
What are the Gear Pump market trends shaping the Industry?
- In emerging economies, there is a growing trend towards increased investments in chemical manufacturing facilities. This investment rise is a significant development in the global chemical industry market. The global gear pumps market experiences significant growth due to the increasing demand for plastic goods and the need for energy-efficient solutions in various industries. Positive displacement pumps, including gear pumps, are extensively used in the transportation and dosing of a wide range of fluids, such as diesel oil, lubricating oil, and crude oil, in sectors like mining, household goods, and wastewater treatment plants.
- The gear pumps market is expected to continue its upward trend as the demand for chemical products increases in response to growing investments in the chemical industry. The expansion of these industries, particularly in emerging economies, is fueling the market's growth. For instance, the mining sector's demand for gear pumps is driven by the extraction and processing of minerals, while the household goods industry relies on these pumps for the production of maple cream machinery and other consumer products.
How does Gear Pump market faces challenges during its growth?
- The contraction in the mining industry, particularly in China, poses a significant challenge and hinders the sector's growth. The global mining industry is currently facing challenges due to the economic slowdown in China, the world's largest importer of coal and a significant consumer of mined metals and minerals. This slowdown has resulted in an oversupply of commodities, leading to decreased revenues and profits for mining companies.
- Despite these challenges, the mining industry continues to operate, albeit at a slower pace. The industry's reliance on China for demand and imports makes it a critical market to monitor. Companies must adapt to these changing market dynamics to remain competitive and profitable. High production costs of energy, labor, and equipment further exacerbate the issue, increasing debts and hindering market growth. This growth can be attributed to the burgeoning construction industry, particularly in developing economies like China and India, which is leading to increased demand for construction machinery and material-handling equipment.
Exclusive Customer Landscape
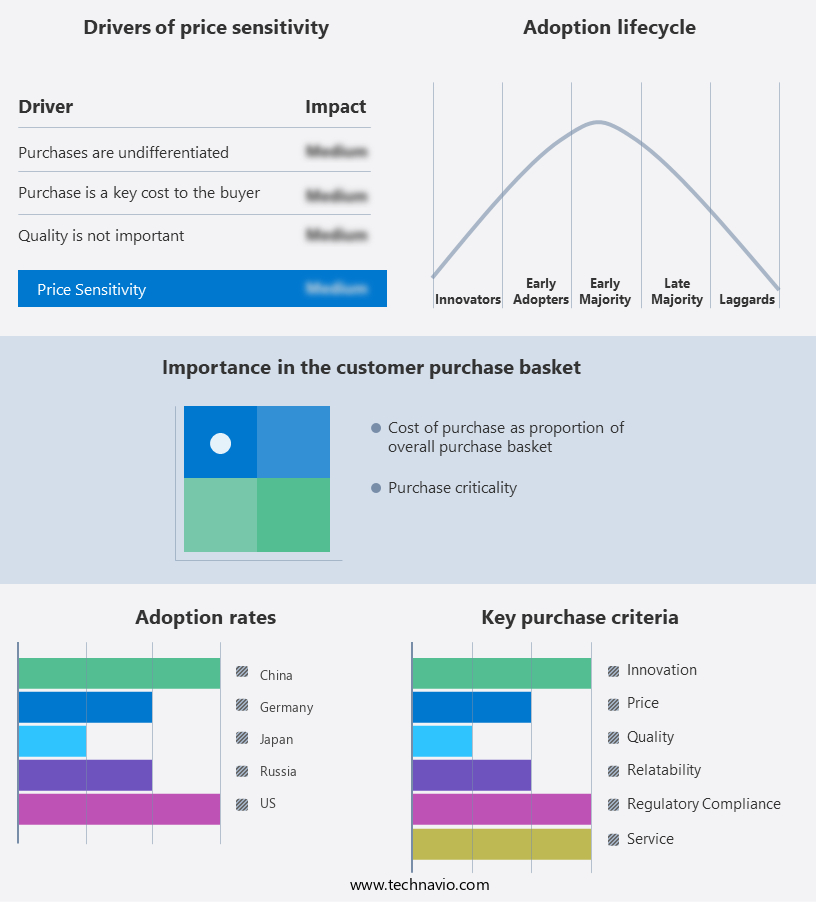
The gear pump market forecasting report includes the adoption lifecycle of the market, covering from the innovator's stage to the laggard's stage. It focuses on adoption rates in different regions based on penetration. Furthermore, the gear pump market report also includes key purchase criteria and drivers of price sensitivity to help companies evaluate and develop their market growth analysis strategies.
Customer Landscape
Key Companies & Market Insights
Companies are implementing various strategies, such as strategic alliances, gear pump market forecast, partnerships, mergers and acquisitions, geographical expansion, and product/service launches, to enhance their presence in the industry.
A and S Hydraulic Co. Ltd. - The company specializes in providing a diverse selection of gear pumps, including the Atos POX-34940 and Atos POX-349 models, catering to various industrial applications.
The industry research and growth report includes detailed analyses of the competitive landscape of the market and information about key companies, including:
- A and S Hydraulic Co. Ltd.
- Bailey International LLC
- Bucher Industries AG
- CASAPPA SpA
- Daikin Industries Ltd.
- Danfoss AS
- Eaton Corp. plc
- Flowserve Corp.
- Hayward Tyler Fluid Handling Ltd.
- Hudaco Industries Ltd.
- IDEX Corp.
- Kawasaki Heavy Industries Ltd.
- KSB SE and Co. KGaA
- KYB Corp.
- Linde Hydraulics GmbH and Co. KG
- Maag Pump Systems
- Parker Hannifin Corp.
- Permco Inc.
- Robert Bosch GmbH
- Roper Pump Co.
Qualitative and quantitative analysis of companies has been conducted to help clients understand the wider business environment as well as the strengths and weaknesses of key industry players. Data is qualitatively analyzed to categorize companies as pure play, category-focused, industry-focused, and diversified; it is quantitatively analyzed to categorize companies as dominant, leading, strong, tentative, and weak.
Recent Development and News in Gear Pump Market
- In January 2024, Gardner Denver, a leading industrial equipment manufacturer, announced the launch of its new line of energy-efficient gear pumps, the "Booster Series," designed for oil and gas applications. These pumps reportedly offer up to 30% energy savings compared to traditional gear pumps (Gardner Denver press release).
- In March 2024, Waukesha Bearings, a subsidiary of Dana Incorporated, entered into a strategic partnership with Schaeffler Group to develop and manufacture advanced gear pump solutions for the wind energy sector. This collaboration aimed to leverage both companies' expertise in bearing technology and pump design (Dana Incorporated press release).
- In April 2025, Eaton Corporation completed the acquisition of Triple-R Pump & Engineering, a leading provider of gear pumps and related equipment for the water and wastewater industry. The acquisition expanded Eaton's portfolio and strengthened its position in the industrial pump market (Eaton Corporation press release).
- In May 2025, the European Union approved new regulations on the use of gear pumps in the chemical industry, mandating stricter emission standards and energy efficiency requirements. The new regulations are expected to drive demand for advanced gear pumps that meet these stringent guidelines (European Commission press release).
Research Analyst Overview
The market continues to evolve in response to the dynamic interplay of various market forces and industry trends. In the realm of water management, the scarcity of this vital resource fuels the demand for efficient and sustainable pumping solutions. Meanwhile, the petrochemical industry's expansion drives the need for robust and reliable gear pumps capable of handling mixed chemicals and viscous fluids. Smart manufacturing practices are increasingly shaping the industrial pump industry, with a focus on energy efficiency and customized solutions tailored to specific applications. The chemical production sector, for instance, requires pumps that can handle the unique demands of chlor alkali and ethylene dichloride production.
The construction sector's infrastructure projects necessitate pumps that can withstand the rigors of heavy-duty applications, while the automotive sector seeks quieter and more energy-efficient gear pumps for their vehicles. In the mining sector, external gear pumps are preferred for their ability to handle abrasive materials, while internal gear pumps excel in applications requiring high pressure and low flow rates. The ongoing pandemic restrictions have led to a shift towards remote monitoring and predictive maintenance, further driving the adoption of Industry 4.0 technologies in the market. Environmental sustainability remains a crucial consideration, with manufacturers focusing on reducing noise generation and minimizing environmental pollution.
The market's continuous unfolding is reflected in its diverse applications, from water treatment activities and hydraulic systems to the production of plastic goods, sodium silicate, and even household goods. The market's dynamic nature ensures that gear pump manufacturers must remain agile and responsive to meet the evolving needs of their customers.
Dive into Technavio's robust research methodology, blending expert interviews, extensive data synthesis, and validated models for unparalleled Gear Pump Market insights. See full methodology.
|
Market Scope |
|
|
Report Coverage |
Details |
|
Page number |
242 |
|
Base year |
2024 |
|
Historic period |
2019-2023 |
|
Forecast period |
2025-2029 |
|
Growth momentum & CAGR |
Accelerate at a CAGR of 4.5% |
|
Market growth 2025-2029 |
USD 485.4 million |
|
Market structure |
Fragmented |
|
YoY growth 2024-2025(%) |
4.3 |
|
Key countries |
US, China, India, Japan, Germany, UK, South Korea, France, Canada, and Italy |
|
Competitive landscape |
Leading Companies, Market Positioning of Companies, Competitive Strategies, and Industry Risks |
What are the Key Data Covered in this Gear Pump Market Research and Growth Report?
- CAGR of the Gear Pump industry during the forecast period
- Detailed information on factors that will drive the growth and forecasting between 2025 and 2029
- Precise estimation of the size of the market and its contribution of the industry in focus to the parent market
- Accurate predictions about upcoming growth and trends and changes in consumer behaviour
- Growth of the market across APAC, North America, Europe, South America, and Middle East and Africa
- Thorough analysis of the market's competitive landscape and detailed information about companies
- Comprehensive analysis of factors that will challenge the gear pump market growth of industry companies
We can help! Our analysts can customize this gear pump market research report to meet your requirements.
 RIA -
RIA - 
