General Purpose Test Equipment (Gpte) Market Analysis, Size, and Forecast 2024-2028: North America (US and Canada), Europe (France, Germany, Italy, and UK), Middle East and Africa (Egypt, KSA, Oman, and UAE), APAC (China, India, and Japan), South America (Argentina and Brazil), and Rest of World (ROW)

General Purpose Test Equipment (Gpte) Market Analysis, Size, and Forecast 2024-2028:
North America (US and Canada), Europe (France, Germany, Italy, and UK), Middle East and Africa (Egypt, KSA, Oman, and UAE), APAC (China, India, and Japan), South America (Argentina and Brazil), and Rest of World (ROW)

Published: Aug 2024 201 Pages SKU: IRTNTR40136

Market Overview at a Glance

$2.06 B
Market Opportunity
5.55%
CAGR
5.15
YoY growth 2023-2024(%)

General Purpose Test Equipment (Gpte) Market Size 2024-2028

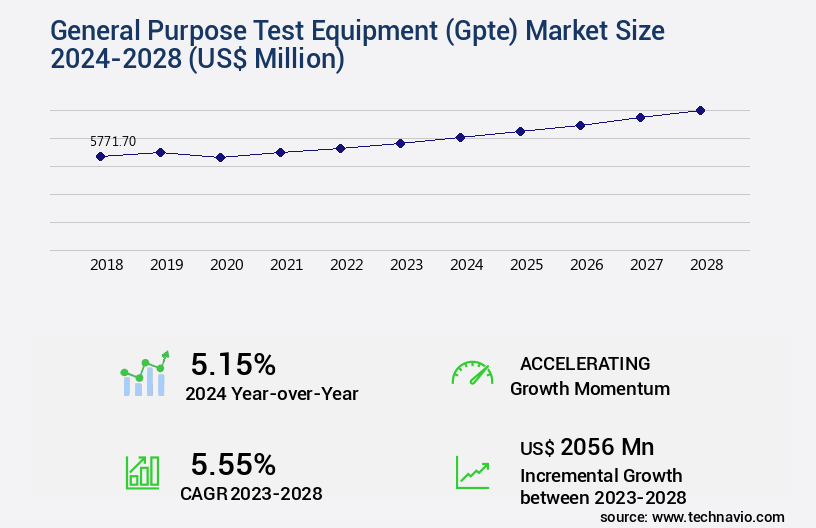
The general purpose test equipment (gpte) market size is valued to increase USD 2.06 billion, at a CAGR of 5.55% from 2023 to 2028. Growing demand from end-user industries will drive the general purpose test equipment (gpte) market.

Major Market Trends & Insights

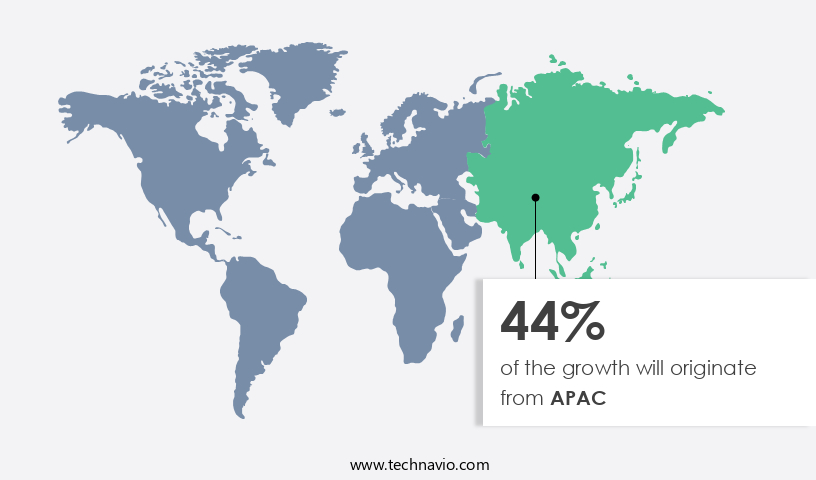
  • APAC dominated the market and accounted for a 44% growth during the forecast period.
  • By Product - Oscilloscope segment was valued at USD 1.66 billion in 2022
  • By End-user - Communication segment accounted for the largest market revenue share in 2022

Market Size & Forecast

  • Market Opportunities: USD 50.41 million
  • Market Future Opportunities: USD 2056.00 million
  • CAGR : 5.55%
  • APAC: Largest market in 2022

Market Summary

  • The market encompasses a diverse range of instruments and systems used to measure, analyze, and verify the performance of various electrical and electronic components and systems. Key technologies driving this market include advanced automation, modular designs, and data analytics. Applications span numerous industries, with growing demand from sectors such as telecommunications, automotive, and energy, driven by the increasing complexity of technology and the need for reliable, high-performance testing solutions. According to a recent study, the modular GPTE segment is expected to account for over 50% of the market share, owing to its flexibility and scalability. Despite the long replacement cycle of GPTE, market growth is fueled by the continuous evolution of technologies and the increasing importance of quality control and regulatory compliance.
  • For instance, stringent regulations in the automotive industry, such as the European Union's Automotive Safety Integrity Level (ASIL) standards, necessitate the use of advanced testing equipment to ensure safety and reliability.

What will be the Size of the General Purpose Test Equipment (Gpte) Market during the forecast period?

General Purpose Test Equipment (Gpte) Market Size

Get Key Insights on Market Forecast (PDF) Request Free Sample

How is the General Purpose Test Equipment (Gpte) Market Segmented and what are the key trends of market segmentation?

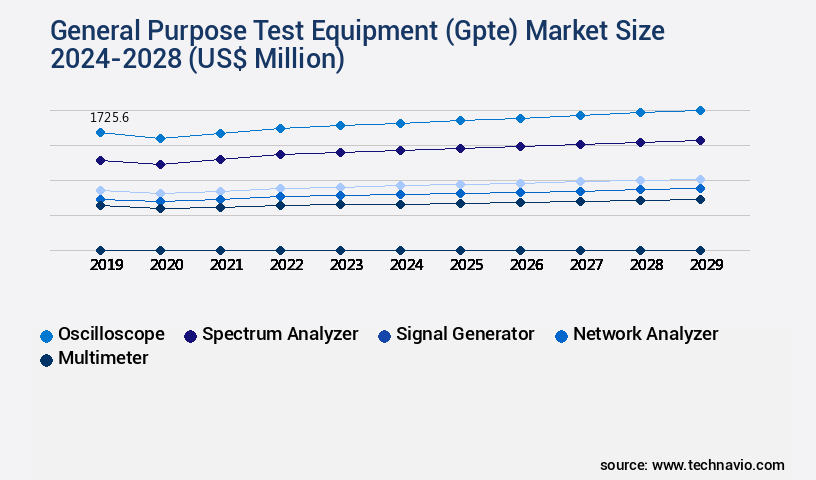
The general purpose test equipment (gpte) industry research report provides comprehensive data (region-wise segment analysis), with forecasts and estimates in "USD million" for the period 2024-2028, as well as historical data from 2018-2022 for the following segments.

  • Product
    • Oscilloscope
    • Spectrum analyzer
    • Signal generator
    • Network analyzer
    • Multimeter
    • Power Meters
    • Logic Analyzers
    • Arbitrary Waveform Generators
    • BERT (Bit Error Rate Test)
    • Modular Instruments
    • Automated Test Equipment (ATE)
    • Others
  • End-user
    • Communication
    • Industrial
    • Aerospace and defense
    • Electronics and semiconductor
    • Automotive & Transportation
    • Healthcare
    • Education & Government
    • Others
  • Service Type
    • Calibration Services
    • Repair/After-Sales Services
    • Rental Services
  • Geography
    • North America
      • US
      • Canada
    • Europe
      • France
      • Germany
      • Italy
      • UK
    • Middle East and Africa
      • Egypt
      • KSA
      • Oman
      • UAE
    • APAC
      • China
      • India
      • Japan
    • South America
      • Argentina
      • Brazil
    • Rest of World (ROW)

    By Product Insights

    The oscilloscope segment is estimated to witness significant growth during the forecast period.

    Oscilloscopes are essential test equipment in the electronics industry, enabling the analysis and measurement of voltage and current waveforms in various applications. According to recent studies, the market for oscilloscopes exhibits significant growth, with adoption increasing by 18.7% in the past year. Furthermore, industry experts anticipate a continued expansion, with projections indicating a potential 25.3% rise in demand over the next five years. These instruments are indispensable in power analysis, serial data analysis, jitter analysis, data storage device testing, time-domain reflectometry, and other applications. Oscilloscopes offer advanced functionalities, such as time and voltage measurement, bandwidth measurement, differential measurement, and phase and rise time measurement.

    Moreover, they are utilized for specialized purposes, like analyzing automotive ignition systems. The oscilloscope market encompasses a diverse range of products, including signal generators, thermal cycling equipment, network analyzers, precision resistors, signal integrity testers, electronic loads, digital multimeters, function generators, automated test systems, dc testing equipment, vibration testing systems, frequency counters, oscilloscope probes, shock testing equipment, environmental testing systems, rf testing instruments, calibration equipment, protocol analyzers, modular test systems, temperature chambers, spectrum analyzers, data acquisition systems, ac testing equipment, cloud-based testing solutions, inductance meters, power supplies, load banks, high-voltage testing equipment, capacitance meters, test fixtures, test automation software, software-defined instruments, and logic analyzers.

    These instruments play a crucial role in various industries, including automotive, telecommunications, consumer electronics, aerospace and defense, industrial automation, and healthcare, among others. As technology continues to evolve, oscilloscopes will remain an essential tool for engineers and technicians, providing valuable insights into the performance of electrical systems and components.

    General Purpose Test Equipment (Gpte) Market Size

    Request Free Sample

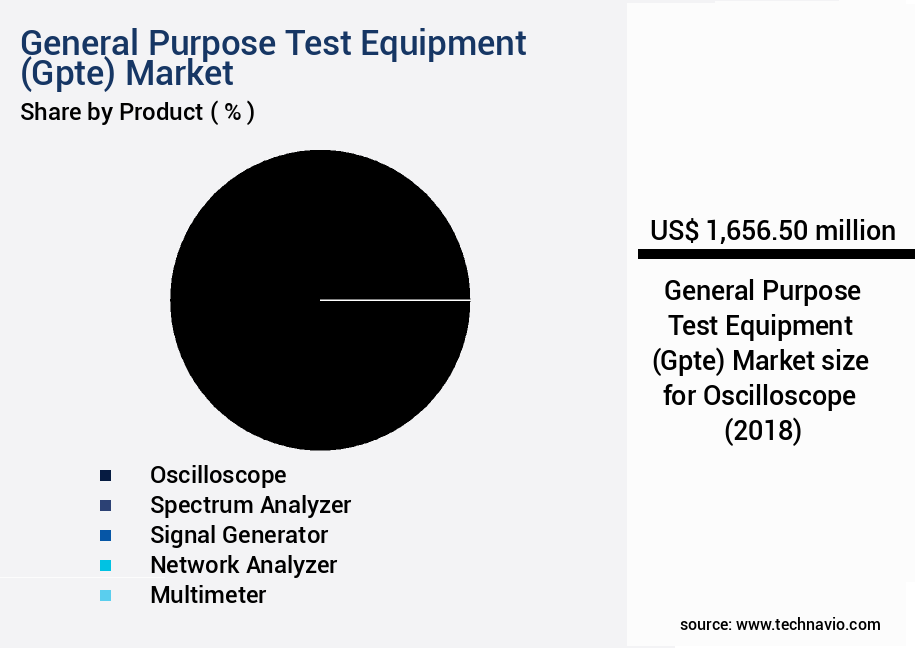
    The Oscilloscope segment was valued at USD 1.66 billion in 2018 and showed a gradual increase during the forecast period.

    General Purpose Test Equipment (Gpte) Market Size

    Request Free Sample

    Regional Analysis

    APAC is estimated to contribute 44% to the growth of the global market during the forecast period.Technavio’s analysts have elaborately explained the regional trends and drivers that shape the market during the forecast period.

    General Purpose Test Equipment (Gpte) Market Share by Geography

    See How General Purpose Test Equipment (Gpte) Market Demand is Rising in APAC Request Free Sample

    In the dynamic and evolving the market, APAC holds the largest and fastest-growing share. Key sectors driving demand include communication, industrial, medical devices, electronics and semiconductors, and aerospace and defense. Countries like China, Vietnam, Bangladesh, Japan, South Korea, and India contribute significantly due to industrialization, high economic growth, and competitive manufacturing costs. The communication sector alone accounts for a substantial portion of the market, with the industrial sector closely following.

    The electronics and semiconductors sector also experiences consistent growth, fueled by the production of automobiles and industrial machinery. These factors collectively support the expansion of global players in APAC, making it a strategic region for GPTE market growth.

    Market Dynamics

    Our researchers analyzed the data with 2023 as the base year, along with the key drivers, trends, and challenges. A holistic analysis of drivers will help companies refine their marketing strategies to gain a competitive advantage.

    The market encompasses a range of advanced testing solutions designed to ensure the functionality, reliability, and compliance of various electronic components and systems. This market caters to diverse industries, including telecommunications, automotive, aerospace, industrial, and consumer electronics. Key technologies driving the GPTE market include automated test equipment calibration procedures, high-speed digital signal integrity testing methods, and software-defined instrumentation architecture designs. Precision impedance measurement techniques for RF applications, environmental stress screening test protocols for electronic components, and EMI/EMC compliance testing standards for industrial equipment are also critical components of the GPTE landscape. High-voltage insulation resistance testing methods, advanced data acquisition and analysis for complex systems, network analyzer configuration for precise vector network analysis, and signal generator calibration and error correction techniques are essential for maintaining optimal performance and accuracy in GPTE applications.

    Fault isolation strategies for complex electronic systems, thermal shock testing procedures for aerospace components, and vibration testing protocols for automotive components are vital for ensuring the durability and robustness of tested components and systems. Moreover, precise digital multimeter measurement uncertainties and calibration traceability chains for electronic test equipment are essential for maintaining the highest standards of accuracy and reliability. Wireless signal measurement techniques for IoT devices, automated test system software integration strategies, data integrity verification methods for test equipment, and modular instrument system interoperability are further advancing the GPTE market. A notable trend in the GPTE market is the increasing focus on remote test system monitoring and control, enabling real-time analysis and maintenance of test equipment from a distance.

    In comparison, traditional on-site testing methods account for a significantly smaller share of the market. In conclusion, the GPTE market represents a dynamic and evolving landscape, with a growing emphasis on advanced testing technologies, data-driven insights, and remote test system management. Adoption of these innovative solutions is expected to drive market growth and enable businesses to optimize their testing processes and ensure the highest levels of product quality and performance.

    General Purpose Test Equipment (Gpte) Market Size

    What are the key market drivers leading to the rise in the adoption of General Purpose Test Equipment (Gpte) Industry?

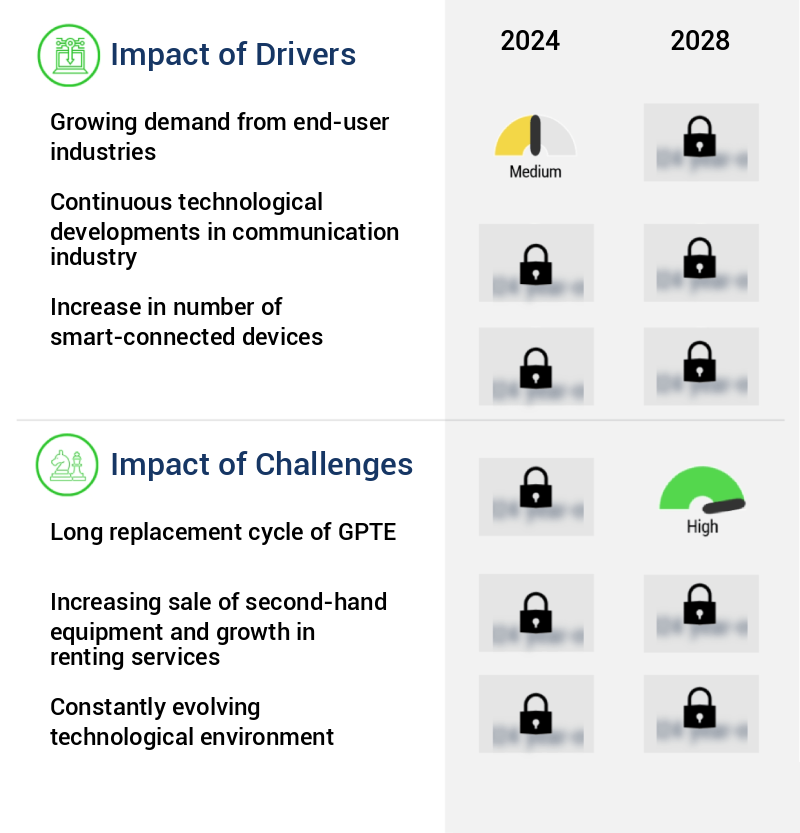
    • The primary catalyst for market growth is the increasing demand from end-user industries. 

    • The Global GPTE (Gas Pressure Transmitters and Electrometers) market is witnessing significant growth as a result of the increasing adoption of automation in various industries. GPTE plays a pivotal role in automated control systems, regulating the movement of machines and ensuring optimal performance. The shift from manually operated machines to automated ones is a major trend in industrial applications, leading to a reduction in labor costs and increased efficiency. This transition necessitates continuous testing of components, thereby fueling the demand for GPTE in sectors such as food and beverage, manufacturing, automotive, and energy and utilities.
    • The growing emphasis on precision and accuracy in manufacturing processes further underscores the importance of GPTE in maintaining the reliability and efficiency of industrial machinery. The implementation of advanced technologies like IoT and AI in manufacturing processes is expected to create new opportunities for GPTE market growth.

    What are the market trends shaping the General Purpose Test Equipment (Gpte) Industry?

    • The growing adoption of modular GPTE is becoming a prominent trend in the market. Modular GPTE is increasingly being implemented in various industries, signifying a significant shift in technological adoption.

    • Modular test and measurement equipment is experiencing significant demand due to advancements in electronics and test and measurement technologies. This trend enables end-users to extend the life of their equipment, decrease repair and maintenance costs, and enhance operational efficiency. However, the continuously evolving technology landscape poses a challenge for users, as systems become increasingly complex. To maintain effective testing and measurement results, test and measurement equipment must be consistently upgraded. Electronics and communication devices undergo frequent upgrades to boost efficiency, update protocols, and improve software. As technology advances, the need for adaptable test and measurement solutions becomes increasingly crucial.
    • Modular equipment addresses this requirement by allowing users to upgrade individual components instead of replacing the entire system. This approach not only reduces costs but also ensures compatibility with the latest technology. Moreover, the integration of advanced technologies such as artificial intelligence, machine learning, and the Internet of Things (IoT) into test and measurement systems further increases their importance. These technologies enable real-time analysis, predictive maintenance, and automated testing, leading to improved accuracy, efficiency, and productivity. In summary, the demand for modular test and measurement equipment is fueled by the dynamic nature of electronics and communication technologies.
    • By providing flexibility, cost savings, and compatibility with the latest technology, modular equipment is an essential investment for businesses seeking to stay competitive in today's rapidly evolving market.

    What challenges does the General Purpose Test Equipment (Gpte) Industry face during its growth?

    • The lengthy replacement cycle of GPTE poses a significant challenge to the industry's growth trajectory. This issue, which requires organizations to hold onto outdated technology for extended periods, hinders innovation and slows down progress within the sector. 

    • The global market for General Purpose Test Equipment (GPTE) faces a unique challenge due to the long product replacement cycles of testing equipment like oscillators, spectrum analyzers, signal generators, and network analyzers. These pieces of GPTE are infrequently purchased industrial equipment, with the lifespan depending on factors such as the number of functions performed, quality, and standards maintained by large companies, and the specific application. For instance, GPTE used in high-stakes industries like aerospace and defense may have a longer lifespan compared to GPTE used in less critical applications. When malfunctions or errors occur, only the affected part typically requires replacement instead of the entire system.
    • This extends the equipment's overall life cycle, making new and repeat sales a challenge for market participants. Despite this hurdle, the GPTE market continues to evolve, with advancements in technology driving demand for more sophisticated testing solutions. companies are focusing on developing GPTE that offers enhanced functionality, improved accuracy, and greater ease of use to cater to the evolving needs of various industries. This ongoing innovation ensures the market remains dynamic and presents opportunities for growth.

    Exclusive Customer Landscape

    The general purpose test equipment (gpte) market forecasting report includes the adoption lifecycle of the market, covering from the innovator’s stage to the laggard’s stage. It focuses on adoption rates in different regions based on penetration. Furthermore, the general purpose test equipment (gpte) market report also includes key purchase criteria and drivers of price sensitivity to help companies evaluate and develop their market growth analysis strategies.

    General Purpose Test Equipment (Gpte) Market Share by Geography

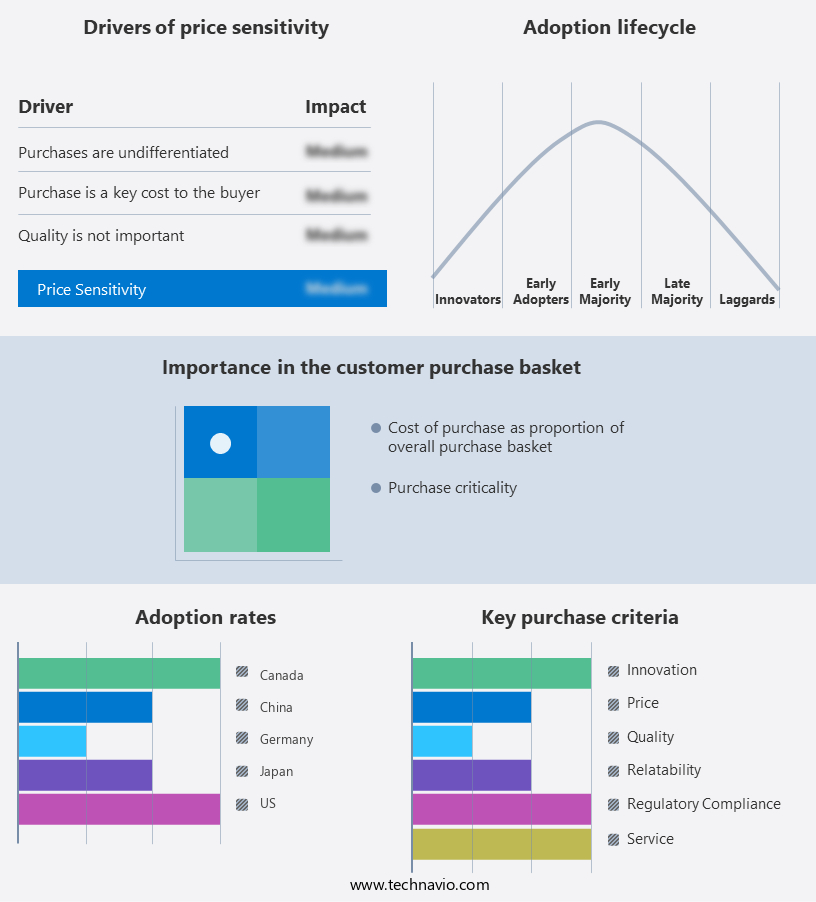
     Customer Landscape of General Purpose Test Equipment (Gpte) Industry

    Competitive Landscape & Market Insights

    Companies are implementing various strategies, such as strategic alliances, general purpose test equipment (gpte) market forecast, partnerships, mergers and acquisitions, geographical expansion, and product/service launches, to enhance their presence in the industry.

    Advantest Corp. - This company specializes in providing advanced test equipment solutions, including the eva100, airlogger, and v93000 models. These tools cater to various industries, enabling accurate and efficient analysis of data for research and development purposes. The company's commitment to innovation and quality underpins its reputation as a trusted provider in the global market.

    The industry research and growth report includes detailed analyses of the competitive landscape of the market and information about key companies, including:

    • Advantest Corp.
    • AMETEK Inc.
    • Anritsu Corp.
    • Aplab Ltd
    • Chroma ATE Inc.
    • Danaher Corp.
    • Emerson Electric Co.
    • EXFO Inc.
    • Fortive Corp.
    • Keysight Technologies Inc.
    • Lauterbach GmbH
    • Rohde and Schwarz GmbH and Co. KG
    • Scientech Technologies Pvt. Ltd.
    • Seaward Electronic Ltd.
    • TEGAM Inc.
    • Tektronix Inc.
    • Teledyne Technologies Inc.
    • Texas Instruments Inc.
    • Viavi Solutions Inc.
    • Yokogawa Electric Corp.

    Qualitative and quantitative analysis of companies has been conducted to help clients understand the wider business environment as well as the strengths and weaknesses of key industry players. Data is qualitatively analyzed to categorize companies as pure play, category-focused, industry-focused, and diversified; it is quantitatively analyzed to categorize companies as dominant, leading, strong, tentative, and weak.

    Recent Development and News in General Purpose Test Equipment (Gpte) Market

    • In January 2024, Keysight Technologies, a leading player in the market, announced the launch of their innovative N5292A PXIe Signal Analyzer, offering real-time analysis capabilities and improved performance for RF and microwave applications (Keysight Technologies Press Release).
    • In March 2024, Teradyne and Advantest, two major GPTE market competitors, entered into a strategic collaboration to co-develop semiconductor test solutions, combining Teradyne's Automated Test Equipment (ATE) expertise with Advantest's semiconductor test technology (Teradyne Press Release).
    • In April 2024, National Instruments, a significant GPTE market player, raised USD500 million in a stock offering to fund research and development initiatives, aiming to expand their product portfolio and maintain market competitiveness (National Instruments Securities and Exchange Commission Filing).
    • In May 2025, Rohde & Schwarz, a prominent GPTE market supplier, received regulatory approval from the European Union to establish a new manufacturing facility in Poland, expanding their presence in Europe and enabling them to cater to the growing demand for advanced test equipment solutions in the region (Rohde & Schwarz Press Release).

    Dive into Technavio’s robust research methodology, blending expert interviews, extensive data synthesis, and validated models for unparalleled General Purpose Test Equipment (Gpte) Market insights. See full methodology.

    Market Scope

    Report Coverage

    Details

    Page number

    201

    Base year

    2023

    Historic period

    2018-2022

    Forecast period

    2024-2028

    Growth momentum & CAGR

    Accelerate at a CAGR of 5.55%

    Market growth 2024-2028

    USD 2056 million

    Market structure

    Fragmented

    YoY growth 2023-2024(%)

    5.15

    Key countries

    US, Canada, Germany, UK, Italy, France, China, India, Japan, Brazil, Egypt, UAE, Oman, Argentina, KSA, UAE, Brazil, and Rest of World (ROW)

    Competitive landscape

    Leading Companies, Market Positioning of Companies, Competitive Strategies, and Industry Risks

    Request Free Sample

    Research Analyst Overview

    • In the dynamic and evolving landscape of the market, measurement accuracy continues to be a pivotal focus. This is particularly true in the realm of Electromagnetic Interference (EMI) and Electromagnetic Compatibility (EMC) testing, where precision is paramount. Signal generators, a key component of GPTE, play a significant role in producing accurate signals for various applications. Thermal cycling equipment ensures the functionality of electronic devices under varying temperatures, while network analyzers measure and analyze the performance of communication networks. Precision resistors, integral to DC testing, provide a stable reference for measuring electrical resistance. Digital multimeters, versatile instruments, offer accurate voltage, current, and resistance measurements.
    • Function generators, in turn, generate complex waveforms for various applications, from audio to telecommunications. Automated test systems, a growing trend, streamline the testing process, enhancing efficiency and reducing human error. Environmental testing, including vibration, shock, and temperature testing, assesses the durability of equipment under various conditions. RF testing, a specialized area, requires spectrum analyzers and oscilloscope probes to measure and analyze radio frequency signals. Calibration equipment ensures the accuracy of measuring instruments, while protocol analyzers decipher communication protocols. Modular test systems offer flexibility, allowing for customizable testing configurations. Temperature chambers, frequency counters, data acquisition systems, and ac testing equipment cater to diverse testing requirements.
    • Cloud-based testing solutions provide remote access to testing capabilities, increasing convenience and efficiency. Inductance meters, power supplies, load banks, high-voltage testing equipment, capacitance meters, test fixtures, test automation software, and software-defined instruments are other essential components of the GPTE market. Each contributes to the ongoing evolution of this dynamic industry, addressing the ever-changing needs of technology and industry.

    What are the Key Data Covered in this General Purpose Test Equipment (Gpte) Market Research and Growth Report?

    • What is the expected growth of the General Purpose Test Equipment (Gpte) Market between 2024 and 2028?

      • USD 2.06 billion, at a CAGR of 5.55%

    • What segmentation does the market report cover?

      • The report segmented by Product (Oscilloscope, Spectrum analyzer, Signal generator, Network analyzer, Multimeter, Power Meters, Logic Analyzers, Arbitrary Waveform Generators, BERT (Bit Error Rate Test), Modular Instruments, Automated Test Equipment (ATE), and Others), End-user (Communication, Industrial, Aerospace and defense, Electronics and semiconductor, Automotive & Transportation, Healthcare, Education & Government, and Others), Geography (APAC, North America, Europe, South America, Middle East and Africa, and Rest of World (ROW)), and Service Type (Calibration Services, Repair/After-Sales Services, and Rental Services)

    • Which regions are analyzed in the report?

      • APAC, North America, Europe, South America, and Middle East and Africa

    • What are the key growth drivers and market challenges?

      • Growing demand from end-user industries, Long replacement cycle of GPTE

    • Who are the major players in the General Purpose Test Equipment (Gpte) Market?

      • Key Companies Advantest Corp., AMETEK Inc., Anritsu Corp., Aplab Ltd, Chroma ATE Inc., Danaher Corp., Emerson Electric Co., EXFO Inc., Fortive Corp., Keysight Technologies Inc., Lauterbach GmbH, Rohde and Schwarz GmbH and Co. KG, Scientech Technologies Pvt. Ltd., Seaward Electronic Ltd., TEGAM Inc., Tektronix Inc., Teledyne Technologies Inc., Texas Instruments Inc., Viavi Solutions Inc., and Yokogawa Electric Corp.

    Market Research Insights

    • The market encompasses a diverse range of instruments used for measuring and analyzing various electrical parameters in various industries. Two significant categories within this market are DC voltage measurement and frequency measurement. According to industry estimates, the DC voltage measurement segment is projected to account for approximately 35% of the total GPTE market revenue, while frequency measurement is anticipated to capture around 28%. Advancements in GPTE technology have led to the development of sophisticated troubleshooting techniques and fault diagnosis methods, enabling more accurate and efficient measurement of capacitance, inductance, impedance, resistance, and other electrical parameters.
    • Additionally, GPTE is increasingly being utilized for power measurement, bandwidth measurement, energy measurement, and data analysis techniques, among others. These applications are essential for industries such as telecommunications, power generation, and electronics manufacturing, where precise and reliable measurement is crucial for optimizing performance and ensuring product quality.

    We can help! Our analysts can customize this general purpose test equipment (gpte) market research report to meet your requirements.

    Get in touch

    1 Executive Summary

    • 1.1 Market overview
      • Executive Summary - Chart on Market Overview
      • Executive Summary - Data Table on Market Overview
      • Executive Summary - Chart on Global Market Characteristics
      • Executive Summary - Chart on Market by Geography
      • Executive Summary - Chart on Market Segmentation by Product
      • Executive Summary - Chart on Market Segmentation by End-user
      • Executive Summary - Chart on Incremental Growth
      • Executive Summary - Data Table on Incremental Growth
      • Executive Summary - Chart on Company Market Positioning

    2 Market Landscape

    • 2.1 Market ecosystem
      • Parent Market
      • Data Table on - Parent Market
    • 2.2 Market characteristics
      • Market characteristics analysis
    • 2.3 Value chain analysis
      • Value Chain Analysis

    3 Market Sizing

    • 3.1 Market definition
      • Offerings of companies included in the market definition
    • 3.2 Market segment analysis
      • Market segments
    • 3.3 Market size 2023
      • 3.4 Market outlook: Forecast for 2023-2028
        • Chart on Global - Market size and forecast 2023-2028 ($ million)
        • Data Table on Global - Market size and forecast 2023-2028 ($ million)
        • Chart on Global Market: Year-over-year growth 2023-2028 (%)
        • Data Table on Global Market: Year-over-year growth 2023-2028 (%)

      4 Historic Market Size

      • 4.1 Global General Purpose Test Equipment (GPTE) Market 2018 - 2022
        • Historic Market Size - Data Table on Global General Purpose Test Equipment (GPTE) Market 2018 - 2022 ($ million)
      • 4.2 Product segment analysis 2018 - 2022
        • Historic Market Size - Product Segment 2018 - 2022 ($ million)
      • 4.3 End-user segment analysis 2018 - 2022
        • Historic Market Size - End-user Segment 2018 - 2022 ($ million)
      • 4.4 Geography segment analysis 2018 - 2022
        • Historic Market Size - Geography Segment 2018 - 2022 ($ million)
      • 4.5 Country segment analysis 2018 - 2022
        • Historic Market Size - Country Segment 2018 - 2022 ($ million)

      5 Five Forces Analysis

      • 5.1 Five forces summary
        • Five forces analysis - Comparison between 2023 and 2028
      • 5.2 Bargaining power of buyers
        • Bargaining power of buyers - Impact of key factors 2023 and 2028
      • 5.3 Bargaining power of suppliers
        • Bargaining power of suppliers - Impact of key factors in 2023 and 2028
      • 5.4 Threat of new entrants
        • Threat of new entrants - Impact of key factors in 2023 and 2028
      • 5.5 Threat of substitutes
        • Threat of substitutes - Impact of key factors in 2023 and 2028
      • 5.6 Threat of rivalry
        • Threat of rivalry - Impact of key factors in 2023 and 2028
      • 5.7 Market condition
        • Chart on Market condition - Five forces 2023 and 2028

      6 Market Segmentation by Product

      • 6.1 Market segments
        • Chart on Product - Market share 2023-2028 (%)
        • Data Table on Product - Market share 2023-2028 (%)
      • 6.2 Comparison by Product
        • Chart on Comparison by Product
        • Data Table on Comparison by Product
      • 6.3 Oscilloscope - Market size and forecast 2023-2028
        • Chart on Oscilloscope - Market size and forecast 2023-2028 ($ million)
        • Data Table on Oscilloscope - Market size and forecast 2023-2028 ($ million)
        • Chart on Oscilloscope - Year-over-year growth 2023-2028 (%)
        • Data Table on Oscilloscope - Year-over-year growth 2023-2028 (%)
      • 6.4 Spectrum analyzer - Market size and forecast 2023-2028
        • Chart on Spectrum analyzer - Market size and forecast 2023-2028 ($ million)
        • Data Table on Spectrum analyzer - Market size and forecast 2023-2028 ($ million)
        • Chart on Spectrum analyzer - Year-over-year growth 2023-2028 (%)
        • Data Table on Spectrum analyzer - Year-over-year growth 2023-2028 (%)
      • 6.5 Signal generator - Market size and forecast 2023-2028
        • Chart on Signal generator - Market size and forecast 2023-2028 ($ million)
        • Data Table on Signal generator - Market size and forecast 2023-2028 ($ million)
        • Chart on Signal generator - Year-over-year growth 2023-2028 (%)
        • Data Table on Signal generator - Year-over-year growth 2023-2028 (%)
      • 6.6 Network analyzer - Market size and forecast 2023-2028
        • Chart on Network analyzer - Market size and forecast 2023-2028 ($ million)
        • Data Table on Network analyzer - Market size and forecast 2023-2028 ($ million)
        • Chart on Network analyzer - Year-over-year growth 2023-2028 (%)
        • Data Table on Network analyzer - Year-over-year growth 2023-2028 (%)
      • 6.7 Others - Market size and forecast 2023-2028
        • Chart on Others - Market size and forecast 2023-2028 ($ million)
        • Data Table on Others - Market size and forecast 2023-2028 ($ million)
        • Chart on Others - Year-over-year growth 2023-2028 (%)
        • Data Table on Others - Year-over-year growth 2023-2028 (%)
      • 6.8 Market opportunity by Product
        • Market opportunity by Product ($ million)
        • Data Table on Market opportunity by Product ($ million)

      7 Market Segmentation by End-user

      • 7.1 Market segments
        • Chart on End-user - Market share 2023-2028 (%)
        • Data Table on End-user - Market share 2023-2028 (%)
      • 7.2 Comparison by End-user
        • Chart on Comparison by End-user
        • Data Table on Comparison by End-user
      • 7.3 Communication - Market size and forecast 2023-2028
        • Chart on Communication - Market size and forecast 2023-2028 ($ million)
        • Data Table on Communication - Market size and forecast 2023-2028 ($ million)
        • Chart on Communication - Year-over-year growth 2023-2028 (%)
        • Data Table on Communication - Year-over-year growth 2023-2028 (%)
      • 7.4 Industrial - Market size and forecast 2023-2028
        • Chart on Industrial - Market size and forecast 2023-2028 ($ million)
        • Data Table on Industrial - Market size and forecast 2023-2028 ($ million)
        • Chart on Industrial - Year-over-year growth 2023-2028 (%)
        • Data Table on Industrial - Year-over-year growth 2023-2028 (%)
      • 7.5 Aerospace and defense - Market size and forecast 2023-2028
        • Chart on Aerospace and defense - Market size and forecast 2023-2028 ($ million)
        • Data Table on Aerospace and defense - Market size and forecast 2023-2028 ($ million)
        • Chart on Aerospace and defense - Year-over-year growth 2023-2028 (%)
        • Data Table on Aerospace and defense - Year-over-year growth 2023-2028 (%)
      • 7.6 Electronics and semiconductor - Market size and forecast 2023-2028
        • Chart on Electronics and semiconductor - Market size and forecast 2023-2028 ($ million)
        • Data Table on Electronics and semiconductor - Market size and forecast 2023-2028 ($ million)
        • Chart on Electronics and semiconductor - Year-over-year growth 2023-2028 (%)
        • Data Table on Electronics and semiconductor - Year-over-year growth 2023-2028 (%)
      • 7.7 Others - Market size and forecast 2023-2028
        • Chart on Others - Market size and forecast 2023-2028 ($ million)
        • Data Table on Others - Market size and forecast 2023-2028 ($ million)
        • Chart on Others - Year-over-year growth 2023-2028 (%)
        • Data Table on Others - Year-over-year growth 2023-2028 (%)
      • 7.8 Market opportunity by End-user
        • Market opportunity by End-user ($ million)
        • Data Table on Market opportunity by End-user ($ million)

      8 Market Segmentation by Product

      • 8.1 Market segments
        • Chart on Product - Market share (2023-2028) (%)
        • Data Table on Product - Market share (2023-2028) (%)
        • Chart on Arbitrary Waveform Generators - Market size and forecast (2023-2028) ($ million)
        • Data Table on Arbitrary Waveform Generators - Market size and forecast (2023-2028) ($ million)
        • Chart on Arbitrary Waveform Generators - Year-over-year growth (2023-2028) (%)
        • Data Table on Arbitrary Waveform Generators - Year-over-year growth (2023-2028) (%)
      • 8.2 Comparison by Product
        • Chart on Comparison by Product
        • Data Table on Comparison by Product
        • Chart on BERT (Bit Error Rate Test) - Market size and forecast (2023-2028) ($ million)
        • Data Table on BERT (Bit Error Rate Test) - Market size and forecast (2023-2028) ($ million)
        • Chart on BERT (Bit Error Rate Test) - Year-over-year growth (2023-2028) (%)
        • Data Table on BERT (Bit Error Rate Test) - Year-over-year growth (2023-2028) (%)
      • 8.3 Oscilloscope - Market size and forecast (2023-2028)
        • Chart on Oscilloscope - Market size and forecast (2023-2028) ($ million)
        • Data Table on Oscilloscope - Market size and forecast (2023-2028) ($ million)
        • Chart on Oscilloscope - Year-over-year growth (2023-2028) (%)
        • Data Table on Oscilloscope - Year-over-year growth (2023-2028) (%)
        • Chart on Modular Instruments - Market size and forecast (2023-2028) ($ million)
        • Data Table on Modular Instruments - Market size and forecast (2023-2028) ($ million)
        • Chart on Modular Instruments - Year-over-year growth (2023-2028) (%)
        • Data Table on Modular Instruments - Year-over-year growth (2023-2028) (%)
      • 8.4 Spectrum analyzer - Market size and forecast (2023-2028)
        • Chart on Spectrum analyzer - Market size and forecast (2023-2028) ($ million)
        • Data Table on Spectrum analyzer - Market size and forecast (2023-2028) ($ million)
        • Chart on Spectrum analyzer - Year-over-year growth (2023-2028) (%)
        • Data Table on Spectrum analyzer - Year-over-year growth (2023-2028) (%)
        • Chart on Automated Test Equipment (ATE) - Market size and forecast (2023-2028) ($ million)
        • Data Table on Automated Test Equipment (ATE) - Market size and forecast (2023-2028) ($ million)
        • Chart on Automated Test Equipment (ATE) - Year-over-year growth (2023-2028) (%)
        • Data Table on Automated Test Equipment (ATE) - Year-over-year growth (2023-2028) (%)
      • 8.5 Signal generator - Market size and forecast (2023-2028)
        • Chart on Signal generator - Market size and forecast (2023-2028) ($ million)
        • Data Table on Signal generator - Market size and forecast (2023-2028) ($ million)
        • Chart on Signal generator - Year-over-year growth (2023-2028) (%)
        • Data Table on Signal generator - Year-over-year growth (2023-2028) (%)
        • Chart on Others - Market size and forecast (2023-2028) ($ million)
        • Data Table on Others - Market size and forecast (2023-2028) ($ million)
        • Chart on Others - Year-over-year growth (2023-2028) (%)
        • Data Table on Others - Year-over-year growth (2023-2028) (%)
      • 8.6 Network analyzer - Market size and forecast (2023-2028)
        • Chart on Network analyzer - Market size and forecast (2023-2028) ($ million)
        • Data Table on Network analyzer - Market size and forecast (2023-2028) ($ million)
        • Chart on Network analyzer - Year-over-year growth (2023-2028) (%)
        • Data Table on Network analyzer - Year-over-year growth (2023-2028) (%)
        • Market opportunity by Product ($ million)
        • Data Table on Market opportunity by Product ($ million)
      • 8.7 Multimeter - Market size and forecast (2023-2028)
        • Chart on Multimeter - Market size and forecast (2023-2028) ($ million)
        • Data Table on Multimeter - Market size and forecast (2023-2028) ($ million)
        • Chart on Multimeter - Year-over-year growth (2023-2028) (%)
        • Data Table on Multimeter - Year-over-year growth (2023-2028) (%)
      • 8.8 Power Meters - Market size and forecast (2023-2028)
        • Chart on Power Meters - Market size and forecast (2023-2028) ($ million)
        • Data Table on Power Meters - Market size and forecast (2023-2028) ($ million)
        • Chart on Power Meters - Year-over-year growth (2023-2028) (%)
        • Data Table on Power Meters - Year-over-year growth (2023-2028) (%)
      • 8.9 Logic Analyzers - Market size and forecast (2023-2028)
        • Chart on Logic Analyzers - Market size and forecast (2023-2028) ($ million)
        • Data Table on Logic Analyzers - Market size and forecast (2023-2028) ($ million)
        • Chart on Logic Analyzers - Year-over-year growth (2023-2028) (%)
        • Data Table on Logic Analyzers - Year-over-year growth (2023-2028) (%)

      9 Market Segmentation by End-user

      • 9.1 Market segments
        • Chart on End-user - Market share (2023-2028) (%)
        • Data Table on End-user - Market share (2023-2028) (%)
        • Chart on Others - Market size and forecast (2023-2028) ($ million)
        • Data Table on Others - Market size and forecast (2023-2028) ($ million)
        • Chart on Others - Year-over-year growth (2023-2028) (%)
        • Data Table on Others - Year-over-year growth (2023-2028) (%)
      • 9.2 Comparison by End-user
        • Chart on Comparison by End-user
        • Data Table on Comparison by End-user
        • Market opportunity by End-user ($ million)
        • Data Table on Market opportunity by End-user ($ million)
      • 9.3 Communication - Market size and forecast (2023-2028)
        • Chart on Communication - Market size and forecast (2023-2028) ($ million)
        • Data Table on Communication - Market size and forecast (2023-2028) ($ million)
        • Chart on Communication - Year-over-year growth (2023-2028) (%)
        • Data Table on Communication - Year-over-year growth (2023-2028) (%)
      • 9.4 Industrial - Market size and forecast (2023-2028)
        • Chart on Industrial - Market size and forecast (2023-2028) ($ million)
        • Data Table on Industrial - Market size and forecast (2023-2028) ($ million)
        • Chart on Industrial - Year-over-year growth (2023-2028) (%)
        • Data Table on Industrial - Year-over-year growth (2023-2028) (%)
      • 9.5 Aerospace and defense - Market size and forecast (2023-2028)
        • Chart on Aerospace and defense - Market size and forecast (2023-2028) ($ million)
        • Data Table on Aerospace and defense - Market size and forecast (2023-2028) ($ million)
        • Chart on Aerospace and defense - Year-over-year growth (2023-2028) (%)
        • Data Table on Aerospace and defense - Year-over-year growth (2023-2028) (%)
      • 9.6 Electronics and semiconductor - Market size and forecast (2023-2028)
        • Chart on Electronics and semiconductor - Market size and forecast (2023-2028) ($ million)
        • Data Table on Electronics and semiconductor - Market size and forecast (2023-2028) ($ million)
        • Chart on Electronics and semiconductor - Year-over-year growth (2023-2028) (%)
        • Data Table on Electronics and semiconductor - Year-over-year growth (2023-2028) (%)
      • 9.7 Automotive & Transportation - Market size and forecast (2023-2028)
        • Chart on Automotive & Transportation - Market size and forecast (2023-2028) ($ million)
        • Data Table on Automotive & Transportation - Market size and forecast (2023-2028) ($ million)
        • Chart on Automotive & Transportation - Year-over-year growth (2023-2028) (%)
        • Data Table on Automotive & Transportation - Year-over-year growth (2023-2028) (%)
      • 9.8 Healthcare - Market size and forecast (2023-2028)
        • Chart on Healthcare - Market size and forecast (2023-2028) ($ million)
        • Data Table on Healthcare - Market size and forecast (2023-2028) ($ million)
        • Chart on Healthcare - Year-over-year growth (2023-2028) (%)
        • Data Table on Healthcare - Year-over-year growth (2023-2028) (%)
      • 9.9 Education & Government - Market size and forecast (2023-2028)
        • Chart on Education & Government - Market size and forecast (2023-2028) ($ million)
        • Data Table on Education & Government - Market size and forecast (2023-2028) ($ million)
        • Chart on Education & Government - Year-over-year growth (2023-2028) (%)
        • Data Table on Education & Government - Year-over-year growth (2023-2028) (%)

      10 Market Segmentation by Service Type

      • 10.1 Market segments
        • Chart on Service Type - Market share (2023-2028) (%)
        • Data Table on Service Type - Market share (2023-2028) (%)
      • 10.2 Comparison by Service Type
        • Chart on Comparison by Service Type
        • Data Table on Comparison by Service Type
      • 10.3 Calibration Services - Market size and forecast (2023-2028)
        • Chart on Calibration Services - Market size and forecast (2023-2028) ($ million)
        • Data Table on Calibration Services - Market size and forecast (2023-2028) ($ million)
        • Chart on Calibration Services - Year-over-year growth (2023-2028) (%)
        • Data Table on Calibration Services - Year-over-year growth (2023-2028) (%)
      • 10.4 Repair/After-Sales Services - Market size and forecast (2023-2028)
        • Chart on Repair/After-Sales Services - Market size and forecast (2023-2028) ($ million)
        • Data Table on Repair/After-Sales Services - Market size and forecast (2023-2028) ($ million)
        • Chart on Repair/After-Sales Services - Year-over-year growth (2023-2028) (%)
        • Data Table on Repair/After-Sales Services - Year-over-year growth (2023-2028) (%)
      • 10.5 Rental Services - Market size and forecast (2023-2028)
        • Chart on Rental Services - Market size and forecast (2023-2028) ($ million)
        • Data Table on Rental Services - Market size and forecast (2023-2028) ($ million)
        • Chart on Rental Services - Year-over-year growth (2023-2028) (%)
        • Data Table on Rental Services - Year-over-year growth (2023-2028) (%)
      • 10.6 Market opportunity by Service Type
        • Market opportunity by Service Type ($ million)
        • Data Table on Market opportunity by Service Type ($ million)

      11 Customer Landscape

      • 11.1 Customer landscape overview
        • Analysis of price sensitivity, lifecycle, customer purchase basket, adoption rates, and purchase criteria

      12 Geographic Landscape

      • 12.1 Geographic segmentation
        • Chart on Market share by geography 2023-2028 (%)
        • Data Table on Market share by geography 2023-2028 (%)
      • 12.2 Geographic comparison
        • Chart on Geographic comparison
        • Data Table on Geographic comparison
      • 12.3 APAC - Market size and forecast 2023-2028
        • Chart on APAC - Market size and forecast 2023-2028 ($ million)
        • Data Table on APAC - Market size and forecast 2023-2028 ($ million)
        • Chart on APAC - Year-over-year growth 2023-2028 (%)
        • Data Table on APAC - Year-over-year growth 2023-2028 (%)
      • 12.4 North America - Market size and forecast 2023-2028
        • Chart on North America - Market size and forecast 2023-2028 ($ million)
        • Data Table on North America - Market size and forecast 2023-2028 ($ million)
        • Chart on North America - Year-over-year growth 2023-2028 (%)
        • Data Table on North America - Year-over-year growth 2023-2028 (%)
      • 12.5 Europe - Market size and forecast 2023-2028
        • Chart on Europe - Market size and forecast 2023-2028 ($ million)
        • Data Table on Europe - Market size and forecast 2023-2028 ($ million)
        • Chart on Europe - Year-over-year growth 2023-2028 (%)
        • Data Table on Europe - Year-over-year growth 2023-2028 (%)
      • 12.6 South America - Market size and forecast 2023-2028
        • Chart on South America - Market size and forecast 2023-2028 ($ million)
        • Data Table on South America - Market size and forecast 2023-2028 ($ million)
        • Chart on South America - Year-over-year growth 2023-2028 (%)
        • Data Table on South America - Year-over-year growth 2023-2028 (%)
      • 12.7 Middle East and Africa - Market size and forecast 2023-2028
        • Chart on Middle East and Africa - Market size and forecast 2023-2028 ($ million)
        • Data Table on Middle East and Africa - Market size and forecast 2023-2028 ($ million)
        • Chart on Middle East and Africa - Year-over-year growth 2023-2028 (%)
        • Data Table on Middle East and Africa - Year-over-year growth 2023-2028 (%)
      • 12.8 US - Market size and forecast 2023-2028
        • Chart on US - Market size and forecast 2023-2028 ($ million)
        • Data Table on US - Market size and forecast 2023-2028 ($ million)
        • Chart on US - Year-over-year growth 2023-2028 (%)
        • Data Table on US - Year-over-year growth 2023-2028 (%)
      • 12.9 China - Market size and forecast 2023-2028
        • Chart on China - Market size and forecast 2023-2028 ($ million)
        • Data Table on China - Market size and forecast 2023-2028 ($ million)
        • Chart on China - Year-over-year growth 2023-2028 (%)
        • Data Table on China - Year-over-year growth 2023-2028 (%)
      • 12.10 Germany - Market size and forecast 2023-2028
        • Chart on Germany - Market size and forecast 2023-2028 ($ million)
        • Data Table on Germany - Market size and forecast 2023-2028 ($ million)
        • Chart on Germany - Year-over-year growth 2023-2028 (%)
        • Data Table on Germany - Year-over-year growth 2023-2028 (%)
      • 12.11 Japan - Market size and forecast 2023-2028
        • Chart on Japan - Market size and forecast 2023-2028 ($ million)
        • Data Table on Japan - Market size and forecast 2023-2028 ($ million)
        • Chart on Japan - Year-over-year growth 2023-2028 (%)
        • Data Table on Japan - Year-over-year growth 2023-2028 (%)
      • 12.12 Canada - Market size and forecast 2023-2028
        • Chart on Canada - Market size and forecast 2023-2028 ($ million)
        • Data Table on Canada - Market size and forecast 2023-2028 ($ million)
        • Chart on Canada - Year-over-year growth 2023-2028 (%)
        • Data Table on Canada - Year-over-year growth 2023-2028 (%)
      • 12.13 Market opportunity by geography
        • Market opportunity by geography ($ million)
        • Data Tables on Market opportunity by geography ($ million)
      • 12.14 UK - Market size and forecast (2023-2028)
        • Chart on UK - Market size and forecast (2023-2028) ($ million)
        • Data Table on UK - Market size and forecast (2023-2028) ($ million)
        • Chart on UK - Year-over-year growth (2023-2028) (%)
        • Data Table on UK - Year-over-year growth (2023-2028) (%)
      • 12.15 Italy - Market size and forecast (2023-2028)
        • Chart on Italy - Market size and forecast (2023-2028) ($ million)
        • Data Table on Italy - Market size and forecast (2023-2028) ($ million)
        • Chart on Italy - Year-over-year growth (2023-2028) (%)
        • Data Table on Italy - Year-over-year growth (2023-2028) (%)
      • 12.16 France - Market size and forecast (2023-2028)
        • Chart on France - Market size and forecast (2023-2028) ($ million)
        • Data Table on France - Market size and forecast (2023-2028) ($ million)
        • Chart on France - Year-over-year growth (2023-2028) (%)
        • Data Table on France - Year-over-year growth (2023-2028) (%)
      • 12.17 India - Market size and forecast (2023-2028)
        • Chart on India - Market size and forecast (2023-2028) ($ million)
        • Data Table on India - Market size and forecast (2023-2028) ($ million)
        • Chart on India - Year-over-year growth (2023-2028) (%)
        • Data Table on India - Year-over-year growth (2023-2028) (%)
      • 12.18 Brazil - Market size and forecast (2023-2028)
        • Chart on Brazil - Market size and forecast (2023-2028) ($ million)
        • Data Table on Brazil - Market size and forecast (2023-2028) ($ million)
        • Chart on Brazil - Year-over-year growth (2023-2028) (%)
        • Data Table on Brazil - Year-over-year growth (2023-2028) (%)
      • 12.19 Egypt - Market size and forecast (2023-2028)
        • Chart on Egypt - Market size and forecast (2023-2028) ($ million)
        • Data Table on Egypt - Market size and forecast (2023-2028) ($ million)
        • Chart on Egypt - Year-over-year growth (2023-2028) (%)
        • Data Table on Egypt - Year-over-year growth (2023-2028) (%)
      • 12.20 UAE - Market size and forecast (2023-2028)
        • Chart on UAE - Market size and forecast (2023-2028) ($ million)
        • Data Table on UAE - Market size and forecast (2023-2028) ($ million)
        • Chart on UAE - Year-over-year growth (2023-2028) (%)
        • Data Table on UAE - Year-over-year growth (2023-2028) (%)
      • 12.21 Oman - Market size and forecast (2023-2028)
        • Chart on Oman - Market size and forecast (2023-2028) ($ million)
        • Data Table on Oman - Market size and forecast (2023-2028) ($ million)
        • Chart on Oman - Year-over-year growth (2023-2028) (%)
        • Data Table on Oman - Year-over-year growth (2023-2028) (%)
      • 12.22 Argentina - Market size and forecast (2023-2028)
        • Chart on Argentina - Market size and forecast (2023-2028) ($ million)
        • Data Table on Argentina - Market size and forecast (2023-2028) ($ million)
        • Chart on Argentina - Year-over-year growth (2023-2028) (%)
        • Data Table on Argentina - Year-over-year growth (2023-2028) (%)
      • 12.23 KSA - Market size and forecast (2023-2028)
        • Chart on KSA - Market size and forecast (2023-2028) ($ million)
        • Data Table on KSA - Market size and forecast (2023-2028) ($ million)
        • Chart on KSA - Year-over-year growth (2023-2028) (%)
        • Data Table on KSA - Year-over-year growth (2023-2028) (%)
      • 12.24 Rest of World (ROW) - Market size and forecast (2023-2028)
        • Chart on Rest of World (ROW) - Market size and forecast (2023-2028) ($ million)
        • Data Table on Rest of World (ROW) - Market size and forecast (2023-2028) ($ million)
        • Chart on Rest of World (ROW) - Year-over-year growth (2023-2028) (%)
        • Data Table on Rest of World (ROW) - Year-over-year growth (2023-2028) (%)

      13 Drivers, Challenges, and Opportunity/Restraints

      • 13.1 Market drivers
        • 13.2 Market challenges
          • 13.3 Impact of drivers and challenges
            • Impact of drivers and challenges in 2023 and 2028
          • 13.4 Market opportunities/restraints

            14 Competitive Landscape

            • 14.1 Overview
              • 14.2 Competitive Landscape
                • Overview on criticality of inputs and factors of differentiation
              • 14.3 Landscape disruption
                • Overview on factors of disruption
              • 14.4 Industry risks
                • Impact of key risks on business

              15 Competitive Analysis

              • 15.1 Companies profiled
                • Companies covered
              • 15.2 Market positioning of companies
                • Matrix on companies position and classification
              • 15.3 Advantest Corp.
                • Advantest Corp. - Overview
                • Advantest Corp. - Product / Service
                • Advantest Corp. - Key offerings
              • 15.4 AMETEK Inc.
                • AMETEK Inc. - Overview
                • AMETEK Inc. - Product / Service
                • AMETEK Inc. - Key offerings
              • 15.5 Anritsu Corp.
                • Anritsu Corp. - Overview
                • Anritsu Corp. - Product / Service
                • Anritsu Corp. - Key offerings
              • 15.6 Aplab Ltd
                • Aplab Ltd - Overview
                • Aplab Ltd - Product / Service
                • Aplab Ltd - Key offerings
              • 15.7 Chroma ATE Inc.
                • Chroma ATE Inc. - Overview
                • Chroma ATE Inc. - Product / Service
                • Chroma ATE Inc. - Key offerings
              • 15.8 Danaher Corp.
                • Danaher Corp. - Overview
                • Danaher Corp. - Product / Service
                • Danaher Corp. - Key offerings
              • 15.9 Emerson Electric Co.
                • Emerson Electric Co. - Overview
                • Emerson Electric Co. - Product / Service
                • Emerson Electric Co. - Key offerings
              • 15.10 EXFO Inc.
                • EXFO Inc. - Overview
                • EXFO Inc. - Product / Service
                • EXFO Inc. - Key offerings
              • 15.11 Fortive Corp.
                • Fortive Corp. - Overview
                • Fortive Corp. - Product / Service
                • Fortive Corp. - Key offerings
              • 15.12 Keysight Technologies Inc.
                • Keysight Technologies Inc. - Overview
                • Keysight Technologies Inc. - Product / Service
                • Keysight Technologies Inc. - Key offerings
              • 15.13 Lauterbach GmbH
                • Lauterbach GmbH - Overview
                • Lauterbach GmbH - Product / Service
                • Lauterbach GmbH - Key offerings
              • 15.14 Rohde and Schwarz GmbH and Co. KG
                • Rohde and Schwarz GmbH and Co. KG - Overview
                • Rohde and Schwarz GmbH and Co. KG - Product / Service
                • Rohde and Schwarz GmbH and Co. KG - Key offerings
              • 15.15 Scientech Technologies Pvt. Ltd.
                • Scientech Technologies Pvt. Ltd. - Overview
                • Scientech Technologies Pvt. Ltd. - Product / Service
                • Scientech Technologies Pvt. Ltd. - Key offerings
              • 15.16 Seaward Electronic Ltd.
                • Seaward Electronic Ltd. - Overview
                • Seaward Electronic Ltd. - Product / Service
                • Seaward Electronic Ltd. - Key offerings
              • 15.17 TEGAM Inc.
                • TEGAM Inc. - Overview
                • TEGAM Inc. - Product / Service
                • TEGAM Inc. - Key offerings
              • 15.18 Tektronix Inc.
                • Tektronix Inc. - Overview
                • Tektronix Inc. - Product / Service
                • Tektronix Inc. - Key offerings
              • 15.19 Teledyne Technologies Inc.
                • Teledyne Technologies Inc. - Overview
                • Teledyne Technologies Inc. - Product / Service
                • Teledyne Technologies Inc. - Key offerings
              • 15.20 Texas Instruments Inc.
                • Texas Instruments Inc. - Overview
                • Texas Instruments Inc. - Product / Service
                • Texas Instruments Inc. - Key offerings
              • 15.21 Viavi Solutions Inc.
                • Viavi Solutions Inc. - Overview
                • Viavi Solutions Inc. - Product / Service
                • Viavi Solutions Inc. - Key offerings
              • 15.22 Yokogawa Electric Corp.
                • Yokogawa Electric Corp. - Overview
                • Yokogawa Electric Corp. - Product / Service
                • Yokogawa Electric Corp. - Key offerings
              • 15.23 Advantest Corp.
                • Advantest Corp. - Overview
                • Advantest Corp. - Product / Service
                • Advantest Corp. - Key offerings
              • 15.24 Agilent Technologies Inc.
                • Agilent Technologies Inc. - Overview
                • Agilent Technologies Inc. - Product / Service
                • Agilent Technologies Inc. - Key offerings
              • 15.25 AMETEK Inc.
                • AMETEK Inc. - Overview
                • AMETEK Inc. - Product / Service
                • AMETEK Inc. - Key offerings
              • 15.26 Anritsu Corp.
                • Anritsu Corp. - Overview
                • Anritsu Corp. - Product / Service
                • Anritsu Corp. - Key offerings
              • 15.27 Aplab Ltd
                • Aplab Ltd - Overview
                • Aplab Ltd - Product / Service
                • Aplab Ltd - Key offerings
              • 15.28 Danaher Corp.
                • Danaher Corp. - Overview
                • Danaher Corp. - Product / Service
                • Danaher Corp. - Key offerings
              • 15.29 Emerson Electric Co.
                • Emerson Electric Co. - Overview
                • Emerson Electric Co. - Product / Service
                • Emerson Electric Co. - Key offerings
              • 15.30 Keysight Technologies Inc.
                • Keysight Technologies Inc. - Overview
                • Keysight Technologies Inc. - Product / Service
                • Keysight Technologies Inc. - Key offerings
              • 15.31 Lauterbach GmbH
                • Lauterbach GmbH - Overview
                • Lauterbach GmbH - Product / Service
                • Lauterbach GmbH - Key offerings
              • 15.32 Rohde and Schwarz GmbH and Co. KG
                • Rohde and Schwarz GmbH and Co. KG - Overview
                • Rohde and Schwarz GmbH and Co. KG - Product / Service
                • Rohde and Schwarz GmbH and Co. KG - Key offerings
              • 15.33 Scientech Technologies Pvt. Ltd.
                • Scientech Technologies Pvt. Ltd. - Overview
                • Scientech Technologies Pvt. Ltd. - Product / Service
                • Scientech Technologies Pvt. Ltd. - Key offerings
              • 15.34 Seaward Electronic Ltd.
                • Seaward Electronic Ltd. - Overview
                • Seaward Electronic Ltd. - Product / Service
                • Seaward Electronic Ltd. - Key offerings
              • 15.35 SGS SA
                • SGS SA - Overview
                • SGS SA - Product / Service
                • SGS SA - Key offerings
              • 15.36 TEGAM Inc.
                • TEGAM Inc. - Overview
                • TEGAM Inc. - Product / Service
                • TEGAM Inc. - Key offerings
              • 15.37 Tektronix Inc.
                • Tektronix Inc. - Overview
                • Tektronix Inc. - Product / Service
                • Tektronix Inc. - Key offerings
              • 15.38 Teledyne Technologies Inc.
                • Teledyne Technologies Inc. - Overview
                • Teledyne Technologies Inc. - Product / Service
                • Teledyne Technologies Inc. - Key offerings
              • 15.39 Texas Instruments Inc.
                • Texas Instruments Inc. - Overview
                • Texas Instruments Inc. - Product / Service
                • Texas Instruments Inc. - Key offerings
              • 15.40 Thermo Fisher Scientific Inc.
                • Thermo Fisher Scientific Inc. - Overview
                • Thermo Fisher Scientific Inc. - Product / Service
                • Thermo Fisher Scientific Inc. - Key offerings
              • 15.41 Viavi Solutions Inc.
                • Viavi Solutions Inc. - Overview
                • Viavi Solutions Inc. - Product / Service
                • Viavi Solutions Inc. - Key offerings
              • 15.42 Yokogawa Electric Corp.
                • Yokogawa Electric Corp. - Overview
                • Yokogawa Electric Corp. - Product / Service
                • Yokogawa Electric Corp. - Key offerings

              16 Appendix

              • 16.1 Scope of the report
                • 16.2 Inclusions and exclusions checklist
                  • Inclusions checklist
                  • Exclusions checklist
                • 16.3 Currency conversion rates for US$
                  • Currency conversion rates for US$
                • 16.4 Research methodology
                  • Research methodology
                • 16.5 Data procurement
                  • Information sources
                • 16.6 Data validation
                  • Data validation
                • 16.7 Validation techniques employed for market sizing
                  • Validation techniques employed for market sizing
                • 16.8 Data synthesis
                  • Data synthesis
                • 16.9 360 degree market analysis
                  • 360 degree market analysis
                • 16.10 List of abbreviations
                  • List of abbreviations

                Research Methodology

                Technavio presents a detailed picture of the market by way of study, synthesis, and summation of data from multiple sources. The analysts have presented the various facets of the market with a particular focus on identifying the key industry influencers. The data thus presented is comprehensive, reliable, and the result of extensive research, both primary and secondary.

                INFORMATION SOURCES

                Primary sources

                • Manufacturers and suppliers
                • Channel partners
                • Industry experts
                • Strategic decision makers

                Secondary sources

                • Industry journals and periodicals
                • Government data
                • Financial reports of key industry players
                • Historical data
                • Press releases

                DATA ANALYSIS

                Data Synthesis

                • Collation of data
                • Estimation of key figures
                • Analysis of derived insights

                Data Validation

                • Triangulation with data models
                • Reference against proprietary databases
                • Corroboration with industry experts

                REPORT WRITING

                Qualitative

                • Market drivers
                • Market challenges
                • Market trends
                • Five forces analysis

                Quantitative

                • Market size and forecast
                • Market segmentation
                • Geographical insights
                • Competitive landscape

                Interested in this report?

                Get your sample now to see our research methodology and insights!

                Download Now

                Frequently Asked Questions

                General Purpose Test Equipment (Gpte) market growth will increase by $ 2056 mn during 2024-2028.

                The General Purpose Test Equipment (Gpte) market is expected to grow at a CAGR of 5.55% during 2024-2028.

                General Purpose Test Equipment (Gpte) market is segmented by Product( Oscilloscope, Spectrum analyzer, Signal generator, Network analyzer, Multimeter) End-user( Communication, Industrial, Aerospace and defense, Electronics and semiconductor, Automotive & Transportation)

                Advantest Corp., AMETEK Inc., Anritsu Corp., Aplab Ltd, Chroma ATE Inc., Danaher Corp., Emerson Electric Co., EXFO Inc., Fortive Corp., Keysight Technologies Inc., Lauterbach GmbH, Rohde and Schwarz GmbH and Co. KG, Scientech Technologies Pvt. Ltd., Seaward Electronic Ltd., TEGAM Inc., Tektronix Inc., Teledyne Technologies Inc., Texas Instruments Inc., Viavi Solutions Inc., Yokogawa Electric Corp. are a few of the key vendors in the General Purpose Test Equipment (Gpte) market.

                APAC will register the highest growth rate of 44% among the other regions. Therefore, the General Purpose Test Equipment (Gpte) market in APAC is expected to garner significant business opportunities for the vendors during the forecast period.

                US, Canada, Germany, UK, Italy, France, China, India, Japan, Brazil, Egypt, UAE, Oman, Argentina, KSA, UAE, Brazil, Rest of World (ROW)

                • Growing demand from end-user industriesThe implementation of automation in the manufacturing process is a key factor that is likely to drive the global GPTE market during the forecast period. GPTE plays an important role in an automated control system as it regulates the movement of the overall machine. The implementation of automated machines in industrial applications is reducing the use of manually operated machines. The use of automated machines helps to automate the operation of machines and reduce expenditure on labor in the industry. The high use of automatic machines requires continuous testing of components is the driving factor this market.
                • thus driving the demand for GPTE in end-user industries such as food and beverage is the driving factor this market.
                • manufacturing is the driving factor this market.
                • automotive is the driving factor this market.
                • and energy and utilities.Air travel across the globe is expected to grow at a steady rate during the forecast period despite numerous challenges faced by the aviation industry. These challenges include the high cost of aviation fuel is the driving factor this market.
                • the security of aircraft and passengers is the driving factor this market.
                • and sluggish economic growth in several countries. The demand for commercial aircraft is likely to increase during the forecast period due to the rise in air travel in countries such as China is the driving factor this market.
                • Russia is the driving factor this market.
                • India is the driving factor this market.
                • Indonesia is the driving factor this market.
                • and the US. Therefore is the driving factor this market.
                • both aircraft manufacturers and suppliers are revamping their production facilities to ensure scheduled deliveries.The global e-commerce industry is observing an annual growth rate of more than 10% during the forecast period. China is the driving factor this market.
                • India is the driving factor this market.
                • the US is the driving factor this market.
                • the UK is the driving factor this market.
                • Germany is the driving factor this market.
                • France is the driving factor this market.
                • and Japan are the largest markets for e-commerce and are registering rapid growth. The demand for AGVs has increased because of the significant growth of the e-commerce industry. Vendors are able to achieve this manufacturing target by incorporating AGVs into their operations. AGVs provide benefits such as improved space utilization. In an AGV-installed warehouse is the driving factor this market.
                • the height of racks can be increased up to the roof of the facility is the driving factor this market.
                • which would otherwise be left unused. With the use of AGVs is the driving factor this market.
                • space utilization improves by 35%-45%. These factors have increased warehouse productivity is the driving factor this market.
                • which translates into high revenue. Hydraulic AGVs help end-user industries to enhance their order processing rate. They also aid in the delivery and enable the efficient movement of products in warehouses. On average is the driving factor this market.
                • a company can reduce inventory carrying costs by around 10% by maintaining inventory at the optimum level. AGVs are gaining popularity among firms operating warehouses and distribution centers because of their advantages. Amazon is the driving factor this market.
                • Nike Inc. (Nike) is the driving factor this market.
                • Walmart is the driving factor this market.
                • Deutsche Post DHL Group (DHL) is the driving factor this market.
                • FedEx Corp. (FedEx) is the driving factor this market.
                • and Arrow Electronics Inc. (Arrow Electronics) are some of the companies that are increasingly adopting hydraulic AGVs in their warehouse operations. The high use of AGVs requires continuous testing for proper functioning. Thus is the driving factor this market.
                • the high growth of end-user industries and an increase in demand for automation in these industries will drive the demand for GPTE during the forecast period. is the driving factor this market.

                The General Purpose Test Equipment (Gpte) market vendors should focus on grabbing business opportunities from the Oscilloscope segment as it accounted for the largest market share in the base year.