Generative AI In Life Sciences Market Analysis, Size, and Forecast 2026-2030: North America (US, Canada, and Mexico), Europe (Germany, UK, and France), APAC (China, Japan, and India), Middle East and Africa (Israel, Saudi Arabia, and UAE), South America (Brazil and Argentina), and Rest of World (ROW)

Generative AI In Life Sciences Market Analysis, Size, and Forecast 2026-2030:
North America (US, Canada, and Mexico), Europe (Germany, UK, and France), APAC (China, Japan, and India), Middle East and Africa (Israel, Saudi Arabia, and UAE), South America (Brazil and Argentina), and Rest of World (ROW)

Published: May 2026 292 Pages SKU: IRTNTR80727

Market Overview at a Glance

$1.73 B
Market Opportunity
25.4%
CAGR 2025 - 2030
43.8%
North America Growth
$396.1 Mn
Drug discovery segment 2024

Generative AI In Life Sciences Market Size 2026-2030

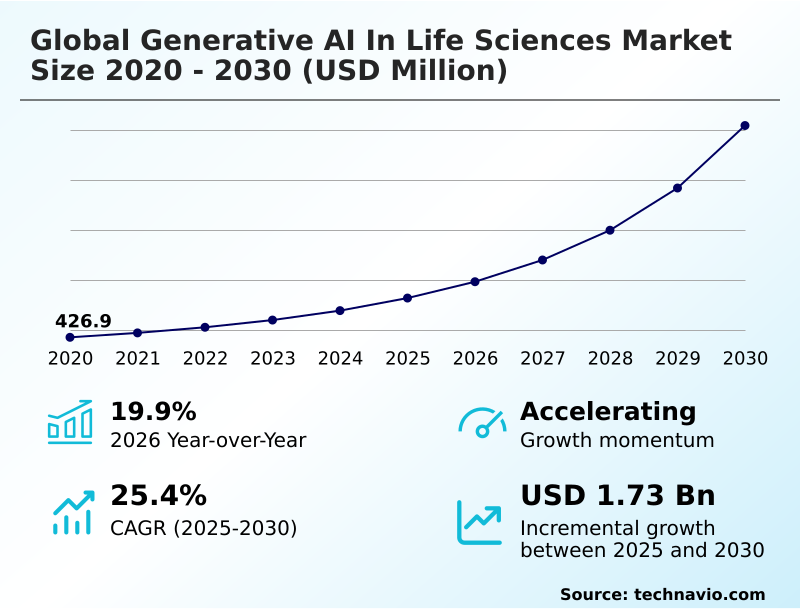
The generative ai in life sciences market size is valued to increase by USD 1.73 billion, at a CAGR of 25.4% from 2025 to 2030. Acceleration of De novo molecular design and therapeutic discovery will drive the generative ai in life sciences market.

Major Market Trends & Insights

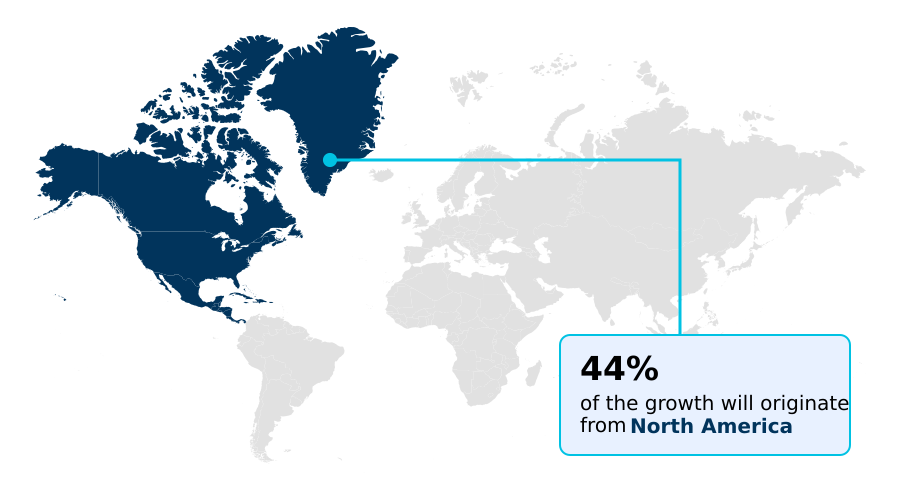
  • North America dominated the market and accounted for a 43.8% growth during the forecast period.
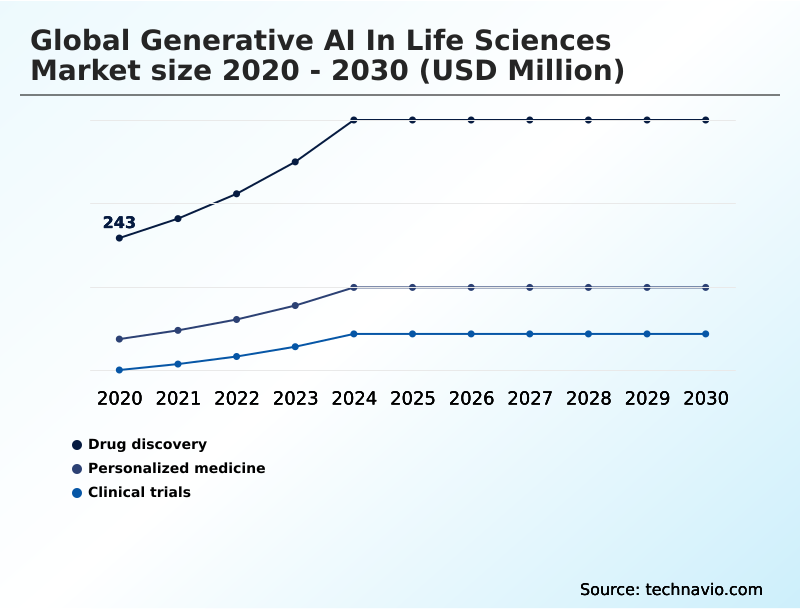
  • By Application - Drug discovery segment was valued at USD 396.1 million in 2024
  • By Technology - Novel molecule generation segment accounted for the largest market revenue share in 2024

Market Size & Forecast

  • Market Opportunities: USD 2.12 billion
  • Market Future Opportunities: USD 1.73 billion
  • CAGR from 2025 to 2030 : 25.4%

Market Summary

  • The generative AI in life sciences market is redefining therapeutic development by enabling the autonomous generation of novel biological and chemical data. This technology leverages biological foundation models and multi-omics data integration to accelerate preclinical development and enhance molecular modeling.
  • A key driver is the radical compression of discovery timelines through de novo molecular design, allowing for rapid therapeutic candidate discovery. However, the sector faces challenges related to the need for curated training data and ensuring model interpretability to avoid algorithmic hallucinations.
  • In a typical scenario, a pharmaceutical firm utilizes a generative platform with a synthetic control arm to simulate clinical trial outcomes, reducing patient recruitment costs and accelerating regulatory submissions. This is driven by autonomous agentic workflows and synthetic digital twins, which are becoming central to modern drug discovery and precision oncology.
  • The industry is moving towards a future where computational biology and generative chemistry shorten the path from lab to clinic, supported by robust machine learning operations and algorithmic guardrails to ensure safety and efficacy.

What will be the Size of the Generative AI In Life Sciences Market during the forecast period?

Get Key Insights on Market Forecast (PDF) Get Free Sample

How is the Generative AI In Life Sciences Market Segmented?

The generative ai in life sciences industry research report provides comprehensive data (region-wise segment analysis), with forecasts and estimates in "USD million" for the period 2026-2030, as well as historical data from 2020-2024 for the following segments.

  • Application
    • Drug discovery
    • Personalized medicine
    • Clinical trials
  • Technology
    • Novel molecule generation
    • Protein sequence design
    • Synthetic gene design
  • Deployment
    • Cloud-based
    • On-premises
    • Hybrid
  • Geography
    • North America
      • US
      • Canada
      • Mexico
    • Europe
      • Germany
      • UK
      • France
    • APAC
      • China
      • Japan
      • India
    • Middle East and Africa
      • Israel
      • Saudi Arabia
      • UAE
    • South America
      • Brazil
      • Argentina
    • Rest of World (ROW)

By Application Insights

The drug discovery segment is estimated to witness significant growth during the forecast period.

The drug discovery segment is undergoing a fundamental paradigm shift, moving from traditional trial-and-error to a structured, predictive design process. This evolution is centered on de novo molecular design and advanced computational chemistry.

Generative AI accelerates lead optimization and the entire hit-to-lead journey through sophisticated in silico modeling and predictive analytics. Instead of relying solely on high-throughput screening, these systems perform rapid compound screening for target identification, dramatically compressing discovery timelines.

One key performance indicator shows that this structure-based drug discovery approach has reduced the need for physical validation by over 90% in certain preclinical phases.

This efficiency is achieved through deep learning algorithms that guide therapeutic candidate discovery, ensuring a more focused and resource-effective pathway for novel treatments.

Get Free Sample

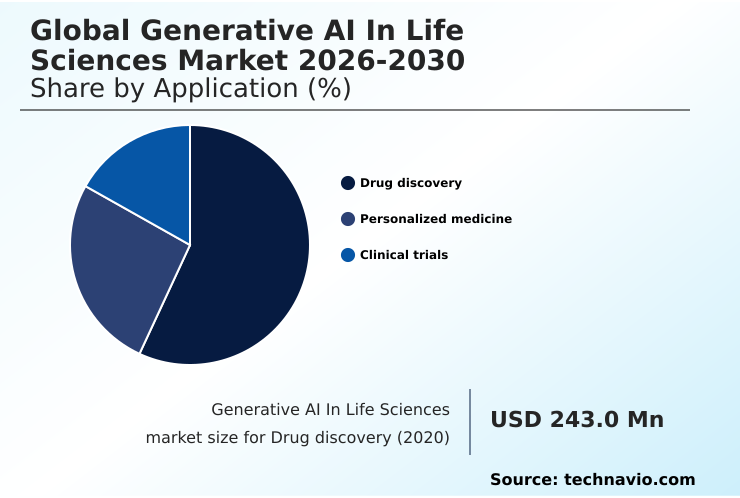
The Drug discovery segment was valued at USD 396.1 million in 2024 and showed a gradual increase during the forecast period.

Get Free Sample

Regional Analysis

North America is estimated to contribute 43.8% to the growth of the global market during the forecast period.Technavio’s analysts have elaborately explained the regional trends and drivers that shape the market during the forecast period.

See How Generative AI In Life Sciences Market Demand is Rising in North America Get Free Sample

The global generative AI in life sciences market exhibits distinct regional dynamics, with North America leading, accounting for 43.8% of incremental growth. This is fueled by a mature ecosystem for biomedical research and access to high-performance computing.

Europe, representing 24.5% of the opportunity, focuses on precision oncology and drug repurposing within a stringent regulatory environment that prizes real-world evidence and explainable AI.

The APAC region is the fastest-growing, driven by national initiatives supporting synthetic gene design and the modernization of healthcare. This region leverages diffusion models and generative adversarial networks to innovate.

Across all regions, the use of variational autoencoders in trial protocol optimization and the development of a data-liquid ecosystem for analyzing cell painting assays and biomedical ontologies are becoming critical for maintaining a competitive edge.

Market Dynamics

Our researchers analyzed the data with 2025 as the base year, along with the key drivers, trends, and challenges. A holistic analysis of drivers will help companies refine their marketing strategies to gain a competitive advantage.

  • The strategic implementation of generative AI in the life sciences sector is revolutionizing therapeutic development from inception to clinical application. A core application is the use of generative AI for protein structure prediction, which provides the foundational data necessary for more advanced tasks like generative AI for de novo drug design.
  • This capability directly supports generative AI for novel molecule generation, enabling researchers to explore chemical spaces that were previously inaccessible. The insights gained are then applied to generative AI for therapeutic antibody design and in drug repurposing strategies.
  • Further down the pipeline, generative AI in clinical trial optimization is transforming how studies are designed and executed, with generative AI for clinical trial data synthesis creating realistic patient cohorts. This also aids generative AI for biomarker identification and generative AI for multi-omics data analysis.
  • The technology's reach extends to generative AI for biomedical research, where it powers generative AI for automated lab experiments and generative AI in high-content imaging analysis. For instance, one platform demonstrated the ability to reduce lead optimization timelines by over 85%, condensing an 18-month process into less than 60 days.
  • This acceleration is also seen in generative AI in computational chemistry and generative AI for predictive toxicology modeling, improving safety profiles. Other key applications include generative AI for synthetic biology applications, generative AI for real-world evidence generation, and generative AI for pharmacovigilance automation, all managed through specialized generative AI platforms for life sciences.

What are the key market drivers leading to the rise in the adoption of Generative AI In Life Sciences Industry?

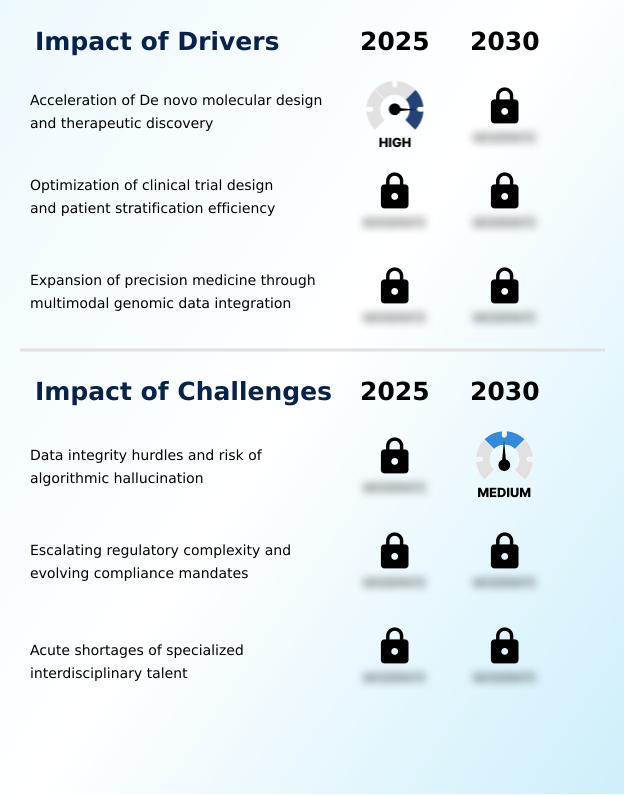
  • A key market driver is the acceleration of de novo molecular design and therapeutic discovery, enabled by generative AI.

  • Market growth is primarily driven by the capacity of generative AI to radically accelerate therapeutic discovery and enable a new tier of precision medicine.
  • The use of advanced multimodal architectures for genomic analysis and protein sequence design allows for a deeper understanding of disease mechanisms.
  • This is exemplified by the application of computational biology to perform molecular modeling and molecular dynamics simulation, which has been shown to increase the success rate of preclinical development candidates by over 25%.
  • These technologies facilitate automated hypothesis generation and the construction of detailed knowledge graphs from vast datasets.
  • As a result, AI-driven diagnostics and clinical decision support tools are becoming more sophisticated, leveraging insights from cell painting assays and biomedical ontologies to guide treatment strategies and streamline pharmacokinetics studies.

What are the market trends shaping the Generative AI In Life Sciences Industry?

  • A key trend is the industrialization of autonomous agentic research workflows. This marks a shift from passive assistive tools to systems capable of multi-step scientific task execution.

  • Key market trends are centered on the industrialization of autonomous agentic workflows and the adoption of synthetic digital twins for clinical development. This shift is powered by biological foundation models and large action models that facilitate automated hypothesis generation and complex scientific tasks.
  • Organizations are increasingly using synthetic control arms in trials, which has been shown to reduce recruitment needs by up to 40% in certain rare disease studies. This approach, supported by digital biomarkers and federated learning, enables more efficient patient stratification. Furthermore, the practice of digital twin creation allows for predictive modeling of patient outcomes.
  • The trend is toward integrated platforms where human-in-the-loop validation remains a critical checkpoint for ensuring the quality of generative biology outputs, especially in novel binder design and other high-stakes applications.

What challenges does the Generative AI In Life Sciences Industry face during its growth?

  • A primary challenge affecting industry growth involves data integrity hurdles and the inherent risk of algorithmic hallucination in high-stakes biological research.

  • A primary challenge restraining market growth is the need for high-quality, curated training data and the immense difficulty in performing multi-omics data integration at scale. While generative chemistry and protein structure prediction show great promise, their reliability is contingent on robust bio-data repositories and phenomic datasets, which are often siloed.
  • The risk of algorithmic hallucination necessitates strong algorithmic guardrails and high model interpretability, especially within regulated GxP workflows. This is compounded by data sovereignty concerns and the complexity of evolving regulatory compliance frameworks. Furthermore, a critical talent shortage persists, with industry reports indicating that 77% of life sciences firms struggle to hire professionals skilled in both AI and biology.
  • This scarcity impedes the effective use of digital pathology and other clinical data platforms, slowing the transition to a fully functional data-liquid ecosystem.

Exclusive Technavio Analysis on Customer Landscape

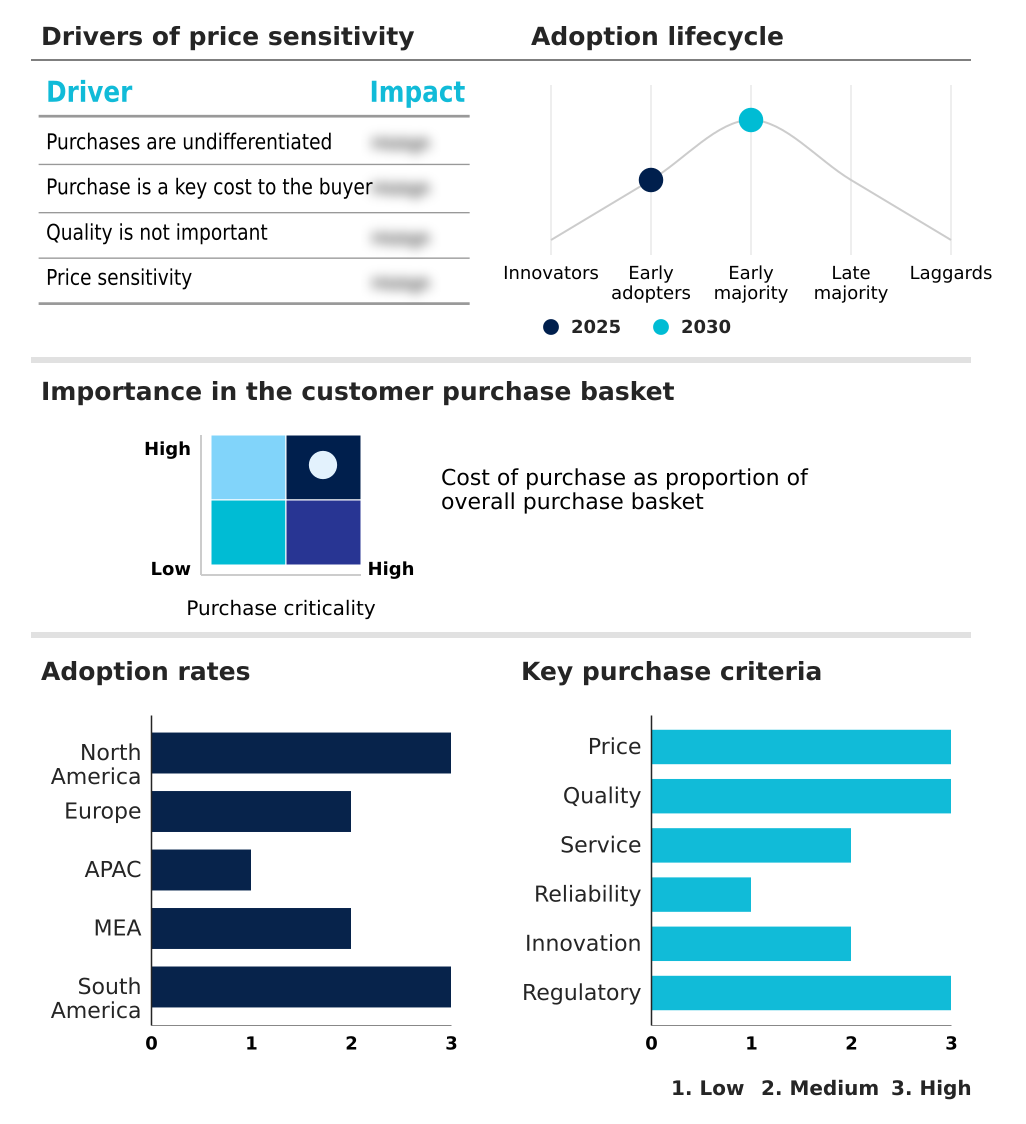
The generative ai in life sciences market forecasting report includes the adoption lifecycle of the market, covering from the innovator’s stage to the laggard’s stage. It focuses on adoption rates in different regions based on penetration. Furthermore, the generative ai in life sciences market report also includes key purchase criteria and drivers of price sensitivity to help companies evaluate and develop their market growth analysis strategies.

Customer Landscape of Generative AI In Life Sciences Industry

Competitive Landscape

Companies are implementing various strategies, such as strategic alliances, generative ai in life sciences market forecast, partnerships, mergers and acquisitions, geographical expansion, and product/service launches, to enhance their presence in the industry.

Atomwise Inc. - Delivering AI-powered platforms that accelerate structure-based drug discovery by designing and screening novel molecules using advanced deep learning algorithms.

The industry research and growth report includes detailed analyses of the competitive landscape of the market and information about key companies, including:

  • Atomwise Inc.
  • BenchSci Analytics Inc.
  • Deep Genomics Inc.
  • Evogene Ltd.
  • Iktos SA
  • Indegene Ltd
  • Insilico Medicine
  • insitro
  • IQVIA Holdings Inc.
  • Isomorphic Labs
  • NVIDIA Corp.
  • Owkin Inc.
  • PathAI Inc.
  • Recursion Pharmaceuticals Inc.
  • Schrodinger Inc.
  • Tempus AI Inc.
  • Valo Health
  • Veeva Systems Inc.
  • Verge Analytics Inc.

Qualitative and quantitative analysis of companies has been conducted to help clients understand the wider business environment as well as the strengths and weaknesses of key industry players. Data is qualitatively analyzed to categorize companies as pure play, category-focused, industry-focused, and diversified; it is quantitatively analyzed to categorize companies as dominant, leading, strong, tentative, and weak.

Recent Development and News in Generative ai in life sciences market

  • In June, 2025, Pfizer expanded its strategic research collaboration with XtalPi to develop an advanced cloud-based molecular modeling platform designed to enhance predictive tools and throughput for small-molecule drug discovery.
  • In November, 2025, Teva launched its Rise platform, a global open innovation initiative created to accelerate smart manufacturing solutions by leveraging a unified hybrid architecture to address production and supply chain challenges.
  • In January, 2026, Anthropic introduced Claude for Healthcare, a specialized platform equipped with HIPAA-ready infrastructure and models specifically optimized for complex healthcare tasks, including the analysis of medical and genomic datasets.
  • In March, 2026, Insilico Medicine announced a significant global research and development collaboration with Eli Lilly, utilizing its proprietary generative AI platform to expedite the discovery of therapeutic candidates across multiple disease areas.

Dive into Technavio’s robust research methodology, blending expert interviews, extensive data synthesis, and validated models for unparalleled Generative AI In Life Sciences Market insights. See full methodology.

Market Scope
Page number 292
Base year 2025
Historic period 2020-2024
Forecast period 2026-2030
Growth momentum & CAGR Accelerate at a CAGR of 25.4%
Market growth 2026-2030 USD 1725.2 million
Market structure Fragmented
YoY growth 2025-2026(%) 19.9%
Key countries US, Canada, Mexico, Germany, UK, France, Italy, The Netherlands, Spain, China, Japan, India, South Korea, Australia, Indonesia, Israel, Saudi Arabia, UAE, South Africa, Turkey, Brazil, Argentina and Chile
Competitive landscape Leading Companies, Market Positioning of Companies, Competitive Strategies, and Industry Risks

Request Free Sample

Research Analyst Overview

  • The generative AI in life sciences market is transitioning from theoretical modeling to industrial-scale application, fundamentally altering preclinical development. The focus is now on production-grade generative biology platforms capable of end-to-end therapeutic discovery, from target identification to binder design. Boardroom decisions increasingly involve balancing the high capital expenditure for in-house high-performance computing against the adoption of cloud-based molecular modeling.
  • This is driven by data showing sixty-two percent of life sciences organizations prioritize generative AI for drug discovery. The technology enables advanced patient stratification, pharmacokinetics prediction, and streamlined hit-to-lead processes. The success of these systems relies on sophisticated machine learning operations and federated learning to leverage distributed bio-data repositories without compromising data security.
  • As autonomous agentic workflows become standard, the ability to conduct molecular dynamics simulation and rapid lead optimization will define competitive positioning in the industry.

What are the Key Data Covered in this Generative AI In Life Sciences Market Research and Growth Report?

  • What is the expected growth of the Generative AI In Life Sciences Market between 2026 and 2030?

    • USD 1.73 billion, at a CAGR of 25.4%

  • What segmentation does the market report cover?

    • The report is segmented by Application (Drug discovery, Personalized medicine, and Clinical trials), Technology (Novel molecule generation, Protein sequence design, and Synthetic gene design), Deployment (Cloud-based, On-premises, and Hybrid) and Geography (North America, Europe, APAC, Middle East and Africa, South America)

  • Which regions are analyzed in the report?

    • North America, Europe, APAC, Middle East and Africa and South America

  • What are the key growth drivers and market challenges?

    • Acceleration of De novo molecular design and therapeutic discovery, Data integrity hurdles and risk of algorithmic hallucination

  • Who are the major players in the Generative AI In Life Sciences Market?

    • Atomwise Inc., BenchSci Analytics Inc., Deep Genomics Inc., Evogene Ltd., Iktos SA, Indegene Ltd, Insilico Medicine, insitro, IQVIA Holdings Inc., Isomorphic Labs, NVIDIA Corp., Owkin Inc., PathAI Inc., Recursion Pharmaceuticals Inc., Schrodinger Inc., Tempus AI Inc., Valo Health, Veeva Systems Inc. and Verge Analytics Inc.

Market Research Insights

  • The generative AI in life sciences market dynamics are shaped by a push for efficiency, where sixty-two percent of firms cite drug discovery as the primary use case, and a significant talent gap, with seventy-seven percent of employers struggling to find skilled professionals. This environment drives the adoption of multimodal architectures and biological foundation models to automate complex tasks.
  • Success depends on leveraging large action models for automated hypothesis generation and knowledge graph construction to navigate complex data. Clinical decision support systems are being enhanced by AI-driven diagnostics, while the need for human-in-the-loop validation remains critical for regulatory acceptance and ensuring the reliability of digital biomarkers. The market's evolution is a balance between technological ambition and practical implementation challenges.

We can help! Our analysts can customize this generative ai in life sciences market research report to meet your requirements.

Get in touch

1. Executive Summary

1.1 Market overview

Executive Summary - Chart on Market Overview
Executive Summary - Data Table on Market Overview
Executive Summary - Chart on Global Market Characteristics
Executive Summary - Chart on Market by Geography
Executive Summary - Chart on Market Segmentation by Application
Executive Summary - Chart on Market Segmentation by Technology
Executive Summary - Chart on Market Segmentation by Deployment
Executive Summary - Chart on Incremental Growth
Executive Summary - Data Table on Incremental Growth
Executive Summary - Chart on Company Market Positioning

2. Technavio Analysis

2.1 Analysis of price sensitivity, lifecycle, customer purchase basket, adoption rates, and purchase criteria

2.2 Criticality of inputs and Factors of differentiation

Chart on Overview on criticality of inputs and factors of differentiation

2.3 Factors of disruption

Chart on Overview on factors of disruption

2.4 Impact of drivers and challenges

Chart on Impact of drivers and challenges in 2025 and 2030

3. Market Landscape

3.1 Market ecosystem

Chart on Parent Market
Data Table on - Parent Market

3.2 Market characteristics

Chart on Market characteristics analysis

3.3 Value chain analysis

Chart on Value chain analysis

4. Market Sizing

4.1 Market definition

Data Table on Offerings of companies included in the market definition

4.2 Market segment analysis

Market segments

4.3 Market size 2025

4.4 Market outlook: Forecast for 2025-2030

Chart on Global - Market size and forecast 2025-2030 ($ million)
Data Table on Global - Market size and forecast 2025-2030 ($ million)
Chart on Global Market: Year-over-year growth 2025-2030 (%)
Data Table on Global Market: Year-over-year growth 2025-2030 (%)

5. Historic Market Size

5.1 Global Generative AI In Life Sciences Market 2020 - 2024

Historic Market Size - Data Table on Global Generative AI In Life Sciences Market 2020 - 2024 ($ million)

5.2 Application segment analysis 2020 - 2024

Historic Market Size - Application Segment 2020 - 2024 ($ million)

5.3 Technology segment analysis 2020 - 2024

Historic Market Size - Technology Segment 2020 - 2024 ($ million)

5.4 Deployment segment analysis 2020 - 2024

Historic Market Size - Deployment Segment 2020 - 2024 ($ million)

5.5 Geography segment analysis 2020 - 2024

Historic Market Size - Geography Segment 2020 - 2024 ($ million)

5.6 Country segment analysis 2020 - 2024

Historic Market Size - Country Segment 2020 - 2024 ($ million)

6. Qualitative Analysis

6.1 Impact of geopolitical conflict for global generative AI in life sciences market

7. Five Forces Analysis

7.1 Five forces summary

Five forces analysis - Comparison between 2025 and 2030

7.2 Bargaining power of buyers

Bargaining power of buyers - Impact of key factors 2025 and 2030

7.3 Bargaining power of suppliers

Bargaining power of suppliers - Impact of key factors in 2025 and 2030

7.4 Threat of new entrants

Threat of new entrants - Impact of key factors in 2025 and 2030

7.5 Threat of substitutes

Threat of substitutes - Impact of key factors in 2025 and 2030

7.6 Threat of rivalry

Threat of rivalry - Impact of key factors in 2025 and 2030

7.7 Market condition

Chart on Market condition - Five forces 2025 and 2030

8. Market Segmentation by Application

8.1 Market segments

Chart on Application - Market share 2025-2030 (%)
Data Table on Application - Market share 2025-2030 (%)

8.2 Comparison by Application

Chart on Comparison by Application
Data Table on Comparison by Application

8.3 Drug discovery - Market size and forecast 2025-2030

Chart on Drug discovery - Market size and forecast 2025-2030 ($ million)
Data Table on Drug discovery - Market size and forecast 2025-2030 ($ million)
Chart on Drug discovery - Year-over-year growth 2025-2030 (%)
Data Table on Drug discovery - Year-over-year growth 2025-2030 (%)

8.4 Personalized medicine - Market size and forecast 2025-2030

Chart on Personalized medicine - Market size and forecast 2025-2030 ($ million)
Data Table on Personalized medicine - Market size and forecast 2025-2030 ($ million)
Chart on Personalized medicine - Year-over-year growth 2025-2030 (%)
Data Table on Personalized medicine - Year-over-year growth 2025-2030 (%)

8.5 Clinical trials - Market size and forecast 2025-2030

Chart on Clinical trials - Market size and forecast 2025-2030 ($ million)
Data Table on Clinical trials - Market size and forecast 2025-2030 ($ million)
Chart on Clinical trials - Year-over-year growth 2025-2030 (%)
Data Table on Clinical trials - Year-over-year growth 2025-2030 (%)

8.6 Market opportunity by Application

Market opportunity by Application ($ million)
Data Table on Market opportunity by Application ($ million)

9. Market Segmentation by Technology

9.1 Market segments

Chart on Technology - Market share 2025-2030 (%)
Data Table on Technology - Market share 2025-2030 (%)

9.2 Comparison by Technology

Chart on Comparison by Technology
Data Table on Comparison by Technology

9.3 Novel molecule generation - Market size and forecast 2025-2030

Chart on Novel molecule generation - Market size and forecast 2025-2030 ($ million)
Data Table on Novel molecule generation - Market size and forecast 2025-2030 ($ million)
Chart on Novel molecule generation - Year-over-year growth 2025-2030 (%)
Data Table on Novel molecule generation - Year-over-year growth 2025-2030 (%)

9.4 Protein sequence design - Market size and forecast 2025-2030

Chart on Protein sequence design - Market size and forecast 2025-2030 ($ million)
Data Table on Protein sequence design - Market size and forecast 2025-2030 ($ million)
Chart on Protein sequence design - Year-over-year growth 2025-2030 (%)
Data Table on Protein sequence design - Year-over-year growth 2025-2030 (%)

9.5 Synthetic gene design - Market size and forecast 2025-2030

Chart on Synthetic gene design - Market size and forecast 2025-2030 ($ million)
Data Table on Synthetic gene design - Market size and forecast 2025-2030 ($ million)
Chart on Synthetic gene design - Year-over-year growth 2025-2030 (%)
Data Table on Synthetic gene design - Year-over-year growth 2025-2030 (%)

9.6 Market opportunity by Technology

Market opportunity by Technology ($ million)
Data Table on Market opportunity by Technology ($ million)

10. Market Segmentation by Deployment

10.1 Market segments

Chart on Deployment - Market share 2025-2030 (%)
Data Table on Deployment - Market share 2025-2030 (%)

10.2 Comparison by Deployment

Chart on Comparison by Deployment
Data Table on Comparison by Deployment

10.3 Cloud-based - Market size and forecast 2025-2030

Chart on Cloud-based - Market size and forecast 2025-2030 ($ million)
Data Table on Cloud-based - Market size and forecast 2025-2030 ($ million)
Chart on Cloud-based - Year-over-year growth 2025-2030 (%)
Data Table on Cloud-based - Year-over-year growth 2025-2030 (%)

10.4 On-premises - Market size and forecast 2025-2030

Chart on On-premises - Market size and forecast 2025-2030 ($ million)
Data Table on On-premises - Market size and forecast 2025-2030 ($ million)
Chart on On-premises - Year-over-year growth 2025-2030 (%)
Data Table on On-premises - Year-over-year growth 2025-2030 (%)

10.5 Hybrid - Market size and forecast 2025-2030

Chart on Hybrid - Market size and forecast 2025-2030 ($ million)
Data Table on Hybrid - Market size and forecast 2025-2030 ($ million)
Chart on Hybrid - Year-over-year growth 2025-2030 (%)
Data Table on Hybrid - Year-over-year growth 2025-2030 (%)

10.6 Market opportunity by Deployment

Market opportunity by Deployment ($ million)
Data Table on Market opportunity by Deployment ($ million)

11. Customer Landscape

11.1 Customer landscape overview

Analysis of price sensitivity, lifecycle, customer purchase basket, adoption rates, and purchase criteria

12. Geographic Landscape

12.1 Geographic segmentation

Chart on Market share by geography 2025-2030 (%)
Data Table on Market share by geography 2025-2030 (%)

12.2 Geographic comparison

Chart on Geographic comparison
Data Table on Geographic comparison

12.3 North America - Market size and forecast 2025-2030

Chart on North America - Market size and forecast 2025-2030 ($ million)
Data Table on North America - Market size and forecast 2025-2030 ($ million)
Chart on North America - Year-over-year growth 2025-2030 (%)
Data Table on North America - Year-over-year growth 2025-2030 (%)
Chart on Regional Comparison - North America
Data Table on Regional Comparison - North America

12.3.1 US - Market size and forecast 2025-2030

Chart on US - Market size and forecast 2025-2030 ($ million)
Data Table on US - Market size and forecast 2025-2030 ($ million)
Chart on US - Year-over-year growth 2025-2030 (%)
Data Table on US - Year-over-year growth 2025-2030 (%)

12.3.2 Canada - Market size and forecast 2025-2030

Chart on Canada - Market size and forecast 2025-2030 ($ million)
Data Table on Canada - Market size and forecast 2025-2030 ($ million)
Chart on Canada - Year-over-year growth 2025-2030 (%)
Data Table on Canada - Year-over-year growth 2025-2030 (%)

12.3.3 Mexico - Market size and forecast 2025-2030

Chart on Mexico - Market size and forecast 2025-2030 ($ million)
Data Table on Mexico - Market size and forecast 2025-2030 ($ million)
Chart on Mexico - Year-over-year growth 2025-2030 (%)
Data Table on Mexico - Year-over-year growth 2025-2030 (%)

12.4 Europe - Market size and forecast 2025-2030

Chart on Europe - Market size and forecast 2025-2030 ($ million)
Data Table on Europe - Market size and forecast 2025-2030 ($ million)
Chart on Europe - Year-over-year growth 2025-2030 (%)
Data Table on Europe - Year-over-year growth 2025-2030 (%)
Chart on Regional Comparison - Europe
Data Table on Regional Comparison - Europe

12.4.1 Germany - Market size and forecast 2025-2030

Chart on Germany - Market size and forecast 2025-2030 ($ million)
Data Table on Germany - Market size and forecast 2025-2030 ($ million)
Chart on Germany - Year-over-year growth 2025-2030 (%)
Data Table on Germany - Year-over-year growth 2025-2030 (%)

12.4.2 UK - Market size and forecast 2025-2030

Chart on UK - Market size and forecast 2025-2030 ($ million)
Data Table on UK - Market size and forecast 2025-2030 ($ million)
Chart on UK - Year-over-year growth 2025-2030 (%)
Data Table on UK - Year-over-year growth 2025-2030 (%)

12.4.3 France - Market size and forecast 2025-2030

Chart on France - Market size and forecast 2025-2030 ($ million)
Data Table on France - Market size and forecast 2025-2030 ($ million)
Chart on France - Year-over-year growth 2025-2030 (%)
Data Table on France - Year-over-year growth 2025-2030 (%)

12.4.4 Italy - Market size and forecast 2025-2030

Chart on Italy - Market size and forecast 2025-2030 ($ million)
Data Table on Italy - Market size and forecast 2025-2030 ($ million)
Chart on Italy - Year-over-year growth 2025-2030 (%)
Data Table on Italy - Year-over-year growth 2025-2030 (%)

12.4.5 The Netherlands - Market size and forecast 2025-2030

Chart on The Netherlands - Market size and forecast 2025-2030 ($ million)
Data Table on The Netherlands - Market size and forecast 2025-2030 ($ million)
Chart on The Netherlands - Year-over-year growth 2025-2030 (%)
Data Table on The Netherlands - Year-over-year growth 2025-2030 (%)

12.4.6 Spain - Market size and forecast 2025-2030

Chart on Spain - Market size and forecast 2025-2030 ($ million)
Data Table on Spain - Market size and forecast 2025-2030 ($ million)
Chart on Spain - Year-over-year growth 2025-2030 (%)
Data Table on Spain - Year-over-year growth 2025-2030 (%)

12.5 APAC - Market size and forecast 2025-2030

Chart on APAC - Market size and forecast 2025-2030 ($ million)
Data Table on APAC - Market size and forecast 2025-2030 ($ million)
Chart on APAC - Year-over-year growth 2025-2030 (%)
Data Table on APAC - Year-over-year growth 2025-2030 (%)
Chart on Regional Comparison - APAC
Data Table on Regional Comparison - APAC

12.5.1 China - Market size and forecast 2025-2030

Chart on China - Market size and forecast 2025-2030 ($ million)
Data Table on China - Market size and forecast 2025-2030 ($ million)
Chart on China - Year-over-year growth 2025-2030 (%)
Data Table on China - Year-over-year growth 2025-2030 (%)

12.5.2 Japan - Market size and forecast 2025-2030

Chart on Japan - Market size and forecast 2025-2030 ($ million)
Data Table on Japan - Market size and forecast 2025-2030 ($ million)
Chart on Japan - Year-over-year growth 2025-2030 (%)
Data Table on Japan - Year-over-year growth 2025-2030 (%)

12.5.3 India - Market size and forecast 2025-2030

Chart on India - Market size and forecast 2025-2030 ($ million)
Data Table on India - Market size and forecast 2025-2030 ($ million)
Chart on India - Year-over-year growth 2025-2030 (%)
Data Table on India - Year-over-year growth 2025-2030 (%)

12.5.4 South Korea - Market size and forecast 2025-2030

Chart on South Korea - Market size and forecast 2025-2030 ($ million)
Data Table on South Korea - Market size and forecast 2025-2030 ($ million)
Chart on South Korea - Year-over-year growth 2025-2030 (%)
Data Table on South Korea - Year-over-year growth 2025-2030 (%)

12.5.5 Australia - Market size and forecast 2025-2030

Chart on Australia - Market size and forecast 2025-2030 ($ million)
Data Table on Australia - Market size and forecast 2025-2030 ($ million)
Chart on Australia - Year-over-year growth 2025-2030 (%)
Data Table on Australia - Year-over-year growth 2025-2030 (%)

12.5.6 Indonesia - Market size and forecast 2025-2030

Chart on Indonesia - Market size and forecast 2025-2030 ($ million)
Data Table on Indonesia - Market size and forecast 2025-2030 ($ million)
Chart on Indonesia - Year-over-year growth 2025-2030 (%)
Data Table on Indonesia - Year-over-year growth 2025-2030 (%)

12.6 Middle East and Africa - Market size and forecast 2025-2030

Chart on Middle East and Africa - Market size and forecast 2025-2030 ($ million)
Data Table on Middle East and Africa - Market size and forecast 2025-2030 ($ million)
Chart on Middle East and Africa - Year-over-year growth 2025-2030 (%)
Data Table on Middle East and Africa - Year-over-year growth 2025-2030 (%)
Chart on Regional Comparison - Middle East and Africa
Data Table on Regional Comparison - Middle East and Africa

12.6.1 Israel - Market size and forecast 2025-2030

Chart on Israel - Market size and forecast 2025-2030 ($ million)
Data Table on Israel - Market size and forecast 2025-2030 ($ million)
Chart on Israel - Year-over-year growth 2025-2030 (%)
Data Table on Israel - Year-over-year growth 2025-2030 (%)

12.6.2 Saudi Arabia - Market size and forecast 2025-2030

Chart on Saudi Arabia - Market size and forecast 2025-2030 ($ million)
Data Table on Saudi Arabia - Market size and forecast 2025-2030 ($ million)
Chart on Saudi Arabia - Year-over-year growth 2025-2030 (%)
Data Table on Saudi Arabia - Year-over-year growth 2025-2030 (%)

12.6.3 UAE - Market size and forecast 2025-2030

Chart on UAE - Market size and forecast 2025-2030 ($ million)
Data Table on UAE - Market size and forecast 2025-2030 ($ million)
Chart on UAE - Year-over-year growth 2025-2030 (%)
Data Table on UAE - Year-over-year growth 2025-2030 (%)

12.6.4 South Africa - Market size and forecast 2025-2030

Chart on South Africa - Market size and forecast 2025-2030 ($ million)
Data Table on South Africa - Market size and forecast 2025-2030 ($ million)
Chart on South Africa - Year-over-year growth 2025-2030 (%)
Data Table on South Africa - Year-over-year growth 2025-2030 (%)

12.6.5 Turkey - Market size and forecast 2025-2030

Chart on Turkey - Market size and forecast 2025-2030 ($ million)
Data Table on Turkey - Market size and forecast 2025-2030 ($ million)
Chart on Turkey - Year-over-year growth 2025-2030 (%)
Data Table on Turkey - Year-over-year growth 2025-2030 (%)

12.7 South America - Market size and forecast 2025-2030

Chart on South America - Market size and forecast 2025-2030 ($ million)
Data Table on South America - Market size and forecast 2025-2030 ($ million)
Chart on South America - Year-over-year growth 2025-2030 (%)
Data Table on South America - Year-over-year growth 2025-2030 (%)
Chart on Regional Comparison - South America
Data Table on Regional Comparison - South America

12.7.1 Brazil - Market size and forecast 2025-2030

Chart on Brazil - Market size and forecast 2025-2030 ($ million)
Data Table on Brazil - Market size and forecast 2025-2030 ($ million)
Chart on Brazil - Year-over-year growth 2025-2030 (%)
Data Table on Brazil - Year-over-year growth 2025-2030 (%)

12.7.2 Argentina - Market size and forecast 2025-2030

Chart on Argentina - Market size and forecast 2025-2030 ($ million)
Data Table on Argentina - Market size and forecast 2025-2030 ($ million)
Chart on Argentina - Year-over-year growth 2025-2030 (%)
Data Table on Argentina - Year-over-year growth 2025-2030 (%)

12.7.3 Chile - Market size and forecast 2025-2030

Chart on Chile - Market size and forecast 2025-2030 ($ million)
Data Table on Chile - Market size and forecast 2025-2030 ($ million)
Chart on Chile - Year-over-year growth 2025-2030 (%)
Data Table on Chile - Year-over-year growth 2025-2030 (%)

12.8 Market opportunity by geography

Market opportunity by geography ($ million)
Data Tables on Market opportunity by geography ($ million)

13. Drivers, Challenges, and Opportunity

13.1 Market drivers

Acceleration of De novo molecular design and therapeutic discovery
Optimization of clinical trial design and patient stratification efficiency
Expansion of precision medicine through multimodal genomic data integration

13.2 Market challenges

Data integrity hurdles and risk of algorithmic hallucination
Escalating regulatory complexity and evolving compliance mandates
Acute shortages of specialized interdisciplinary talent

13.3 Impact of drivers and challenges

Impact of drivers and challenges in 2025 and 2030

13.4 Market opportunities

Industrialization of autonomous agentic research workflows
Adoption of synthetic digital twins in clinical development
Integration of multimodal knowledge to target discovery platforms

14. Competitive Landscape

14.1 Overview

14.2

Overview on criticality of inputs and factors of differentiation

14.3 Landscape disruption

Overview on factors of disruption

14.4 Industry risks

Impact of key risks on business

15. Competitive Analysis

15.1 Companies profiled

Companies covered

15.2 Company ranking index

15.3 Market positioning of companies

Matrix on companies position and classification

15.4 Atomwise Inc.

Atomwise Inc. - Overview
Atomwise Inc. - Product / Service
Atomwise Inc. - Key offerings
SWOT

15.5 BenchSci Analytics Inc.

BenchSci Analytics Inc. - Overview
BenchSci Analytics Inc. - Product / Service
BenchSci Analytics Inc. - Key offerings
SWOT

15.6 Deep Genomics Inc.

Deep Genomics Inc. - Overview
Deep Genomics Inc. - Product / Service
Deep Genomics Inc. - Key offerings
SWOT

15.7 Iktos SA

Iktos SA - Overview
Iktos SA - Product / Service
Iktos SA - Key news
Iktos SA - Key offerings
SWOT

15.8 Insilico Medicine

Insilico Medicine - Overview
Insilico Medicine - Product / Service
Insilico Medicine - Key offerings
SWOT

15.9 IQVIA Holdings Inc.

IQVIA Holdings Inc. - Overview
IQVIA Holdings Inc. - Business segments
IQVIA Holdings Inc. - Key offerings
IQVIA Holdings Inc. - Segment focus
SWOT

15.10 Isomorphic Labs

Isomorphic Labs - Overview
Isomorphic Labs - Product / Service
Isomorphic Labs - Key offerings
SWOT

15.11 NVIDIA Corp.

NVIDIA Corp. - Overview
NVIDIA Corp. - Business segments
NVIDIA Corp. - Key news
NVIDIA Corp. - Key offerings
NVIDIA Corp. - Segment focus
SWOT

15.12 Owkin Inc.

Owkin Inc. - Overview
Owkin Inc. - Product / Service
Owkin Inc. - Key offerings
SWOT

15.13 Recursion Pharmaceuticals Inc.

Recursion Pharmaceuticals Inc. - Overview
Recursion Pharmaceuticals Inc. - Product / Service
Recursion Pharmaceuticals Inc. - Key offerings
SWOT

15.14 Schrodinger Inc.

Schrodinger Inc. - Overview
Schrodinger Inc. - Business segments
Schrodinger Inc. - Key news
Schrodinger Inc. - Key offerings
Schrodinger Inc. - Segment focus
SWOT

15.15 Tempus AI Inc.

Tempus AI Inc. - Overview
Tempus AI Inc. - Product / Service
Tempus AI Inc. - Key offerings
SWOT

15.16 Valo Health

Valo Health - Overview
Valo Health - Product / Service
Valo Health - Key offerings
SWOT

15.17 Veeva Systems Inc.

Veeva Systems Inc. - Overview
Veeva Systems Inc. - Business segments
Veeva Systems Inc. - Key offerings
Veeva Systems Inc. - Segment focus
SWOT

15.18 Verge Analytics Inc.

Verge Analytics Inc. - Overview
Verge Analytics Inc. - Product / Service
Verge Analytics Inc. - Key offerings
SWOT

16. Appendix

16.1 Scope of the report

Market definition
Objectives
Notes and caveats

16.2 Inclusions and exclusions checklist

Inclusions checklist
Exclusions checklist

16.3 Currency conversion rates for US$

16.4 Research methodology

16.5 Data procurement

Information sources

16.6 Data validation

16.7 Validation techniques employed for market sizing

16.8 Data synthesis

16.9 360 degree market analysis

16.10 List of abbreviations

Research Methodology

Technavio presents a detailed picture of the market by way of study, synthesis, and summation of data from multiple sources. The analysts have presented the various facets of the market with a particular focus on identifying the key industry influencers. The data thus presented is comprehensive, reliable, and the result of extensive research, both primary and secondary.

INFORMATION SOURCES

Primary sources

  • Manufacturers and suppliers
  • Channel partners
  • Industry experts
  • Strategic decision makers

Secondary sources

  • Industry journals and periodicals
  • Government data
  • Financial reports of key industry players
  • Historical data
  • Press releases

DATA ANALYSIS

Data Synthesis

  • Collation of data
  • Estimation of key figures
  • Analysis of derived insights

Data Validation

  • Triangulation with data models
  • Reference against proprietary databases
  • Corroboration with industry experts

REPORT WRITING

Qualitative

  • Market drivers
  • Market challenges
  • Market trends
  • Five forces analysis

Quantitative

  • Market size and forecast
  • Market segmentation
  • Geographical insights
  • Competitive landscape

Interested in this report?

Get your sample now to see our research methodology and insights!

Download Now

Frequently Asked Questions

Generative AI In Life Sciences market growth will increase by USD 1725.2 million during 2026-2030.

The Generative AI In Life Sciences market is expected to grow at a CAGR of 25.4% during 2026-2030.

Generative AI In Life Sciences market is segmented by Application (Drug discovery, Personalized medicine, Clinical trials) Technology (Novel molecule generation, Protein sequence design, Synthetic gene design) Deployment (Cloud-based, On-premises, Hybrid)

Atomwise Inc., BenchSci Analytics Inc., Deep Genomics Inc., Evogene Ltd., Iktos SA, Indegene Ltd, Insilico Medicine, insitro, IQVIA Holdings Inc., Isomorphic Labs, NVIDIA Corp., Owkin Inc., PathAI Inc., Recursion Pharmaceuticals Inc., Schrodinger Inc., Tempus AI Inc., Valo Health, Veeva Systems Inc., Verge Analytics Inc. are a few of the key vendors in the Generative AI In Life Sciences market.

North America will register the highest growth rate of 43.8% among the other regions. Therefore, the Generative AI In Life Sciences market in North America is expected to garner significant business opportunities for the vendors during the forecast period.

US, Canada, Mexico, Germany, UK, France, Italy, The Netherlands, Spain, China, Japan, India, South Korea, Australia, Indonesia, Israel, Saudi Arabia, UAE, South Africa, Turkey, Brazil, Argentina, Chile

  • Acceleration of De novo molecular design and therapeutic discovery is the driving factor this market.

The Generative AI In Life Sciences market vendors should focus on grabbing business opportunities from the Application segment as it accounted for the largest market share in the base year.
RIA - Research AI Assistant
Ask RIA