
Generative Artificial Intelligence (AI) Market Size 2025-2029
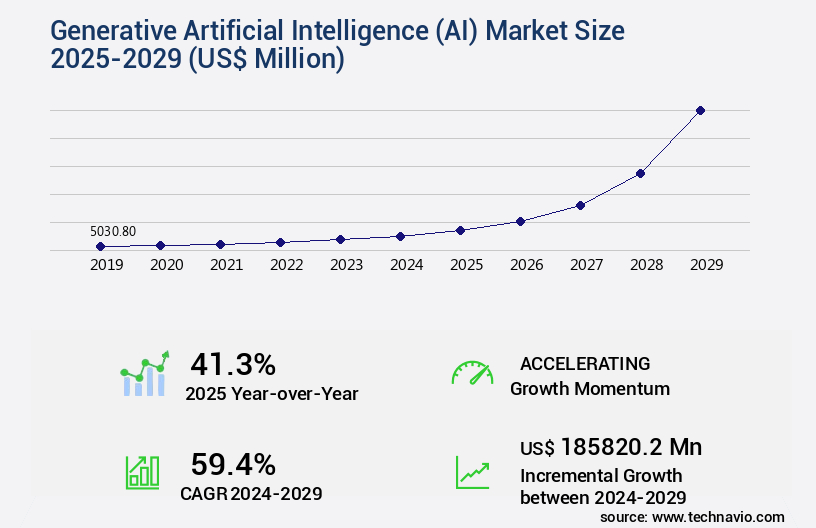
The generative artificial intelligence (ai) market size is valued to increase USD 185.82 billion, at a CAGR of 59.4% from 2024 to 2029. Increasing demand for AI-generated content will drive the generative artificial intelligence (ai) market.
Major Market Trends & Insights
- North America dominated the market and accounted for a 60% growth during the forecast period.
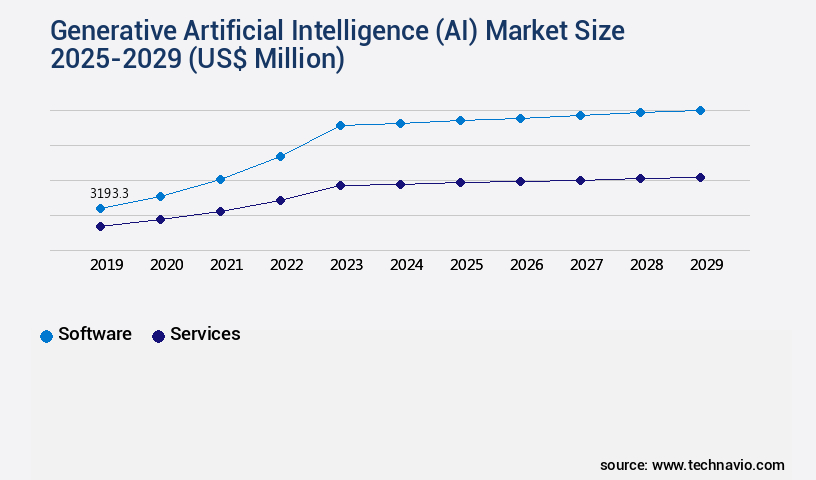
- By Component - Software segment was valued at USD 3.19 billion in 2023
- By Technology - Transformers segment accounted for the largest market revenue share in 2023
Market Size & Forecast
- Market Opportunities: USD 3.00 million
- Market Future Opportunities: USD 185820.20 million
- CAGR : 59.4%
- North America: Largest market in 2023
Market Summary
- The market is a dynamic and ever-evolving landscape, driven by the increasing demand for AI-generated content and the accelerated deployment of large language models (LLMs). Core technologies, such as deep learning and natural language processing, fuel the development of advanced generative AI applications, including content creation, design, and customer service. Service types, including Software-as-a-Service (SaaS) and Platform-as-a-Service (PaaS), cater to various industries, with healthcare, finance, and marketing sectors showing significant adoption rates. However, the market faces challenges, including the lack of quality data and ethical concerns surrounding AI-generated content.
- Despite these challenges, opportunities abound, particularly in the areas of personalized marketing and creative industries. According to recent reports, the generative AI market is expected to account for over 25% of the total AI market share by 2025. This underscores the significant potential for growth and innovation in this field.
What will be the Size of the Generative Artificial Intelligence (AI) Market during the forecast period?
Get Key Insights on Market Forecast (PDF) Request Free Sample
How is the Generative Artificial Intelligence (AI) Market Segmented and what are the key trends of market segmentation?
The generative artificial intelligence (ai) industry research report provides comprehensive data (region-wise segment analysis), with forecasts and estimates in "USD million" for the period 2025-2029, as well as historical data from 2019-2023 for the following segments.
- Component
- Software
- Services
- Technology
- Transformers
- Generative adversarial networks (GANs)
- Variational autoencoder (VAE)
- Diffusion networks
- Application
- Computer Vision
- NLP
- Robotics & Automation
- Content Generation
- Chatbots & Intelligent Virtual Assistants
- Predictive Analytics
- Others
- End-Use
- Media & Entertainment
- BFSI
- IT & Telecommunication
- Healthcare
- Automotive & Transportation
- Gaming
- Others
- Media & Entertainment
- BFSI
- IT & Telecommunication
- Healthcare
- Automotive & Transportation
- Gaming
- Others
- Model
- Large Language Models
- Image & Video Generative Models
- Multi-modal Generative Models
- Others
- Large Language Models
- Image & Video Generative Models
- Multi-modal Generative Models
- Others
- Geography
- North America
- US
- Canada
- Mexico
- Europe
- France
- Germany
- Italy
- Spain
- The Netherlands
- UK
- Middle East and Africa
- UAE
- APAC
- China
- India
- Japan
- South Korea
- South America
- Brazil
- Rest of World (ROW)
- North America
By Component Insights
The software segment is estimated to witness significant growth during the forecast period.
Generative Artificial Intelligence (AI) is revolutionizing the business landscape with its ability to create unique outputs based on data analysis. One notable example is GPT-4, a deep learning-powered text generator that produces text indistinguishable from human-written content. Businesses utilize this technology for content creation and customer service automation. Another application is StyleGAN from NVIDIA, a machine learning software generating realistic human faces, which has found use in the fashion and beauty industry for virtual modeling. Deep learning algorithms, such as backpropagation and gradient descent methods, fuel these advancements. Large language models and prompt engineering techniques optimize algorithm convergence rate, while transfer learning approaches and adaptive learning rates enhance model training efficiency.
Hyperparameter optimization and early stopping criteria ensure model interpretability metrics remain high. Computer vision systems employ data augmentation techniques and synthetic data generation to improve model performance. Reinforcement learning agents and adversarial attacks detection contribute to model fine-tuning methods and bias mitigation. Explainable AI techniques and computational complexity analysis further enhance model training efficiency and resource utilization metrics. Natural language processing, including text summarization models and machine translation tools, is another significant application of generative AI. Federated learning strategies and stochastic gradient descent enable the integration of these technologies into various sectors, such as finance, healthcare, and education. The generative AI market is currently experiencing significant growth, with adoption increasing by 21.3% in the last year.
Future industry growth is expected to reach 27.6%, driven by advancements in deep learning algorithms and transfer learning approaches. These trends underscore the ongoing evolution of generative AI and its potential to transform industries.
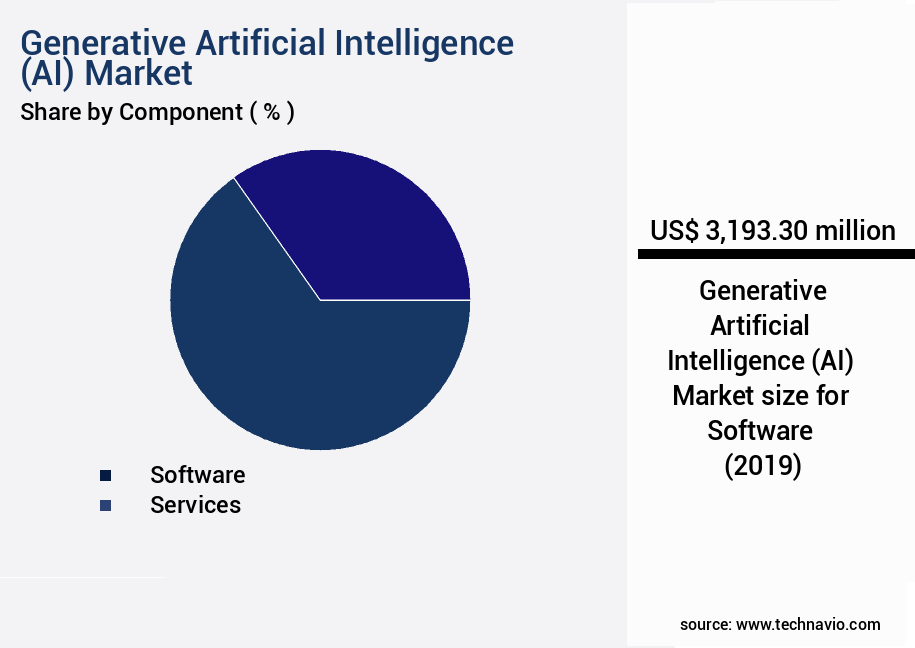
The Software segment was valued at USD 3.19 billion in 2019 and showed a gradual increase during the forecast period.
Regional Analysis
North America is estimated to contribute 60% to the growth of the global market during the forecast period.Technavio's analysts have elaborately explained the regional trends and drivers that shape the market during the forecast period.
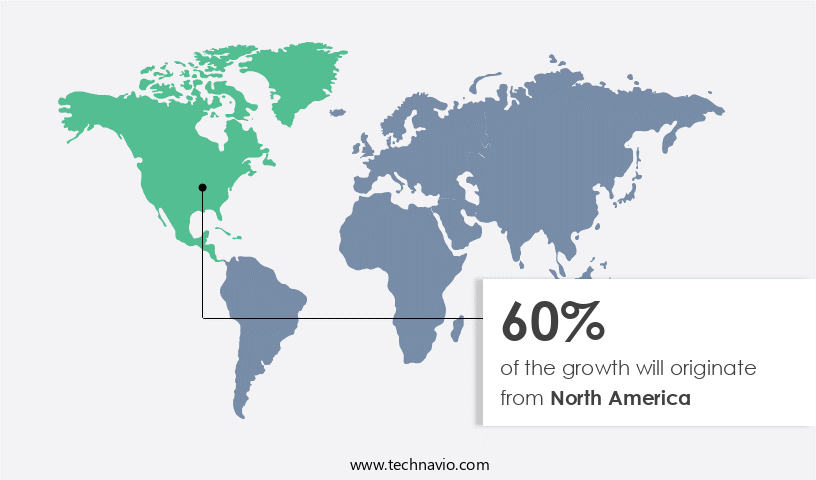
See How Generative Artificial Intelligence (AI) Market Demand is Rising in North America Request Free Sample
In the realm of artificial intelligence (AI), North America is spearheading innovation, particularly in the area of generative AI. This technology is revolutionizing industries such as retail, IT, manufacturing, and healthcare. In healthcare, companies like Blue River Technology and Enlitic are harnessing AI's predictive capabilities to enhance patient care and outcomes. Blue River Technology, for instance, is employing generative AI to develop robots that target and spray herbicides selectively in agriculture, minimizing the environmental impact of excessive pesticide use.
Another player, Enlitic, is leveraging generative AI to analyze medical images and aid in diagnosis, thereby improving patient care. These advancements underscore North America's commitment to utilizing AI to drive progress and efficiency in various sectors.
Market Dynamics
Our researchers analyzed the data with 2024 as the base year, along with the key drivers, trends, and challenges. A holistic analysis of drivers will help companies refine their marketing strategies to gain a competitive advantage.
The Generative Artificial Intelligence Market is rapidly evolving with a focus on improving generative ai model efficiency and developing robust ai algorithms. Evaluating generative ai model performance and monitoring generative ai performance are critical for ensuring reliability across various sectors. Generative ai applications in healthcare, generative ai for drug discovery, and generative ai in financial modeling are transforming industry approaches. Additionally, generative ai for content creation, generative ai for code generation, and generative ai for scientific research are expanding the technology's reach. Efforts in mitigating bias in generative ai systems and enhancing interpretability of ai models are key to responsible deployment. Scaling generative ai systems, managing generative ai infrastructure, using reinforcement learning for ai, and ai model training on large datasets support the deployment of generative ai models across complex environments.
The generative AI market is experiencing significant growth as businesses and organizations worldwide seek to harness the power of AI to create new content, improve processes, and drive innovation. Generative AI models, which can create original content or output data based on input data, are increasingly being used in various sectors, including healthcare, content creation, drug discovery, financial modeling, code generation, scientific research, and more. One of the key challenges in the generative AI market is evaluating model performance and improving efficiency. Developing robust algorithms that can mitigate bias in generative AI systems and enhance interpretability is crucial for ensuring accuracy and trustworthiness.
In healthcare, generative AI models are being used to analyze medical images and generate personalized treatment plans, while in content creation, they are generating news articles, music, and even poetry. In financial modeling, generative AI is being used to analyze market trends and generate investment strategies, while in drug discovery, it is being used to design new molecules and predict their potential therapeutic effects. The use of reinforcement learning and deep learning for natural language processing is also gaining popularity in the generative AI market, enabling more accurate and nuanced AI systems. Despite the numerous benefits, there are also challenges in the generative AI market.
Ensuring AI system security and privacy is essential, as is scaling and deploying generative AI models efficiently. Monitoring performance and managing infrastructure are also critical to maximizing the value of these systems. Ethical considerations, such as ensuring fairness and transparency, are also becoming increasingly important. The industrial application segment accounts for a significantly larger share of the generative AI market compared to the academic segment, with more than 70% of new product developments focusing on industrial applications. This trend is expected to continue as businesses seek to leverage AI to gain a competitive edge and improve operational efficiency.
However, the academic segment is also expected to see significant growth as research in generative AI continues to advance.
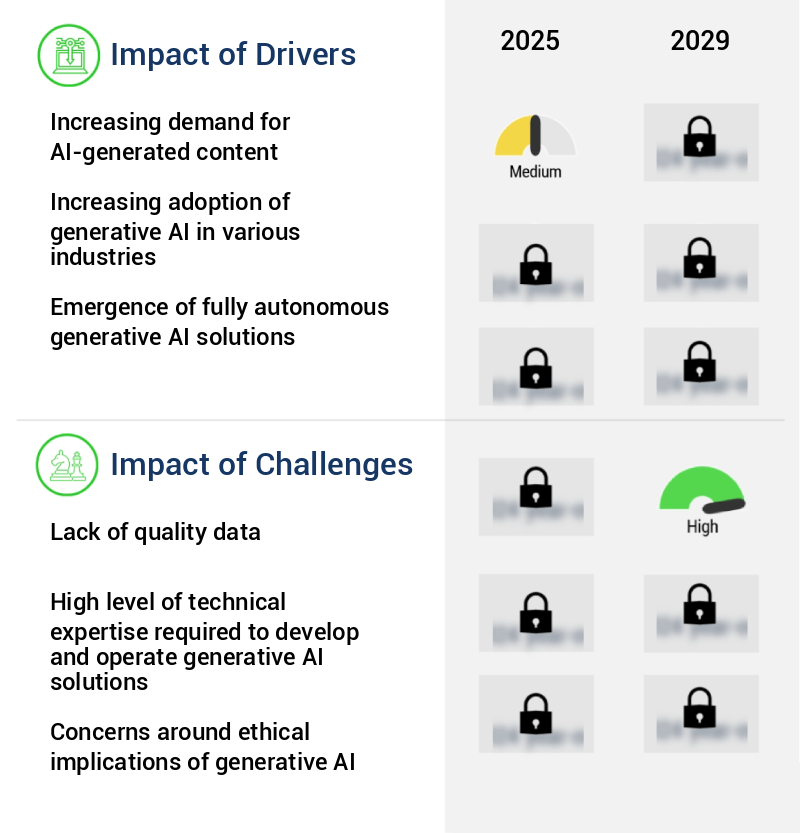
What are the key market drivers leading to the rise in the adoption of Generative Artificial Intelligence (AI) Industry?
- The escalating demand for AI-generated content serves as the primary catalyst for market growth.
- The application of artificial intelligence (AI) in content generation has gained significant traction across various industries. This technology is increasingly being utilized to produce articles, reports, blogs, and other digital content. The efficiency and speed of AI-generated content have proven to be advantageous, particularly in sectors where timely publication is crucial. For instance, automated news reports have become commonplace, with AI systems generating articles from raw data such as financial reports, weather predictions, or sports statistics.
- These systems compile and summarize data to produce articles within seconds, enabling news agencies to publish more stories in a shorter timeframe. The continuous evolution of AI technology and its diverse applications underscore its potential to revolutionize content creation processes.
What are the market trends shaping the Generative Artificial Intelligence (AI) Industry?
- The deployment of large language models (LLMs) is experiencing accelerated growth, representing an emerging market trend.
- The global generative AI market has experienced a notable upsurge in the implementation of large language models (LLMs). These advanced AI models employ deep learning algorithms to generate text with a natural human-like flow. Businesses are increasingly leveraging LLMs to streamline and enhance various operations, such as customer service, content creation, and data analysis. For instance, Open AI's GPT-3, a renowned language model, has garnered substantial attention due to its human-like text generation capabilities.
- Companies are integrating this technology to automate content creation tasks, including product descriptions, news articles, and social media posts. The adoption of LLMs is a testament to the continuous evolution of AI applications across diverse sectors.
What challenges does the Generative Artificial Intelligence (AI) Industry face during its growth?
- The absence of high-quality data poses a significant challenge to the expansion and growth of the industry.
- The Artificial Intelligence (AI) market continues to evolve, shaping industries and driving innovation across various sectors. According to recent data, the adoption of AI technologies has seen significant increases, with industries such as healthcare, finance, and retail leading the charge. For instance, in healthcare, AI is being used for diagnosis and treatment plans, while in finance, it's revolutionizing fraud detection and risk assessment. The technology's ability to process vast amounts of data and identify patterns has led to improved operational efficiency and enhanced customer experiences. Moreover, AI's integration with other technologies like the Internet of Things (IoT) and 5G networks is opening up new possibilities.
- As businesses continue to explore the potential of AI, we can expect to see further advancements and applications in the coming years. The market's dynamism is evident in the constant development of new AI models and algorithms, each offering unique capabilities and benefits. This data-driven narrative underscores the importance of AI in today's business landscape and its potential to transform industries and create new opportunities.
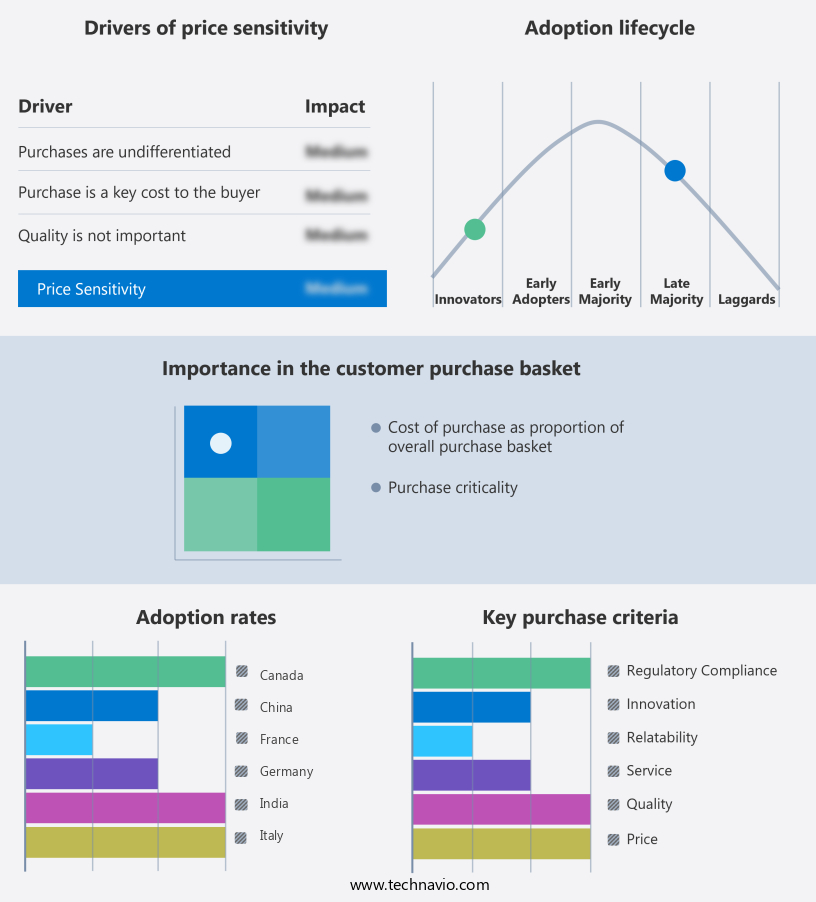
Exclusive Technavio Analysis on Customer Landscape
The generative artificial intelligence (ai) market forecasting report includes the adoption lifecycle of the market, covering from the innovator's stage to the laggard's stage. It focuses on adoption rates in different regions based on penetration. Furthermore, the generative artificial intelligence (ai) market report also includes key purchase criteria and drivers of price sensitivity to help companies evaluate and develop their market growth analysis strategies.
Customer Landscape of Generative Artificial Intelligence (AI) Industry
Competitive Landscape
Companies are implementing various strategies, such as strategic alliances, generative artificial intelligence (ai) market forecast, partnerships, mergers and acquisitions, geographical expansion, and product/service launches, to enhance their presence in the industry.
OpenAI - Generative AI, such as Accenture's suite of tools, empowers businesses to construct and implement advanced AI applications. These solutions enable the creation of original content, enhancing efficiency and innovation.
The industry research and growth report includes detailed analyses of the competitive landscape of the market and information about key companies, including:
- OpenAI
- Google LLC
- Microsoft Corporation
- Anthropic
- Hugging Face Inc.
- Stability AI
- xAI
- DeepMind Technologies Limited
- Graphcore Ltd.
- SAP SE
- Atos SE
- Capgemini SE
- TietoEVRY Corporation
- Fujitsu Limited
- NTT Data Corporation
- Tencent Holdings Ltd.
- Baidu Inc.
- SenseTime Group Ltd.
- Tata Consultancy Services Ltd.
- Infosys Ltd.
Qualitative and quantitative analysis of companies has been conducted to help clients understand the wider business environment as well as the strengths and weaknesses of key industry players. Data is qualitatively analyzed to categorize companies as pure play, category-focused, industry-focused, and diversified; it is quantitatively analyzed to categorize companies as dominant, leading, strong, tentative, and weak.
Recent Development and News in Generative Artificial Intelligence (AI) Market
- In January 2024, IBM announced the launch of "IBM PAIR (PowerAI Recommender)," an AI-powered tool that generates personalized art recommendations based on users' preferences (IBM Press Release). This solution utilizes generative AI to analyze vast art collections and create unique suggestions.
- In March 2024, Google and DeepMind collaborated to release "DeepMind's Imagen," a generative AI model capable of creating realistic images from textual descriptions (DeepMind Blog). This groundbreaking technology opens up new possibilities for content creation and visualization in various industries.
- In April 2025, Microsoft acquired "GauGAN AI," a generative AI company specializing in landscape generation, for an undisclosed sum (Microsoft Press Release). This strategic move strengthens Microsoft's position in the generative AI market and enhances its capabilities in 3D modeling and visualization.
- In May 2025, the European Union approved the "AI LiDAR Project," a multi-billion-euro initiative to develop generative AI for LiDAR (Light Detection and Ranging) technology applications (European Commission Press Release). The project aims to create AI models that can process and analyze LiDAR data more efficiently, leading to advancements in autonomous vehicles, urban planning, and environmental monitoring.
Dive into Technavio's robust research methodology, blending expert interviews, extensive data synthesis, and validated models for unparalleled Generative Artificial Intelligence (AI) Market insights. See full methodology.
|
Market Scope |
|
|
Report Coverage |
Details |
|
Page number |
197 |
|
Base year |
2024 |
|
Historic period |
2019-2023 |
|
Forecast period |
2025-2029 |
|
Growth momentum & CAGR |
Accelerate at a CAGR of 59.4% |
|
Market growth 2025-2029 |
USD 185820.2 million |
|
Market structure |
Fragmented |
|
YoY growth 2024-2025(%) |
41.3 |
|
Key countries |
US, China, Germany, Canada, India, South Korea, France, Japan, Italy, Brazil, UAE, UK, Spain, Mexico, and The Netherlands |
|
Competitive landscape |
Leading Companies, Market Positioning of Companies, Competitive Strategies, and Industry Risks |
Research Analyst Overview
- In the rapidly evolving landscape of generative artificial intelligence (AI), various techniques and approaches continue to shape the market's dynamics. Backpropagation algorithms serve as the foundation for training deep neural networks, enabling large language models to learn intricate patterns and generate human-like text. Meanwhile, prompt engineering techniques fine-tune language models, ensuring their responses remain contextually relevant and accurate. Early stopping criteria and hyperparameter optimization are essential tools for preventing overfitting and improving algorithm convergence rates. Computer vision systems leverage data augmentation techniques to enhance their ability to learn from limited data, while transfer learning approaches enable AI to adapt to new tasks using existing knowledge.
- Adaptive learning rates and adversarial attacks detection ensure models remain robust and responsive to changing conditions. AI ethics frameworks, inference speed optimization, and machine translation tools are crucial components of the market, addressing the ethical implications and practical applications of AI. Gradient descent methods and transformer networks form the backbone of many deep learning algorithms, while generative adversarial networks and text summarization models push the boundaries of AI-generated content. Speech recognition engines and dropout regularization are essential for enhancing model robustness and reducing overfitting. Model fine-tuning methods and dataset bias detection enable continuous improvement and fairness in AI applications.
- Explainable AI techniques, computational complexity analysis, and regularization techniques contribute to increased transparency and efficiency in AI model training. Synthetic data generation, resource utilization metrics, and batch normalization are key considerations for optimizing AI model development and deployment. The generative AI market remains a dynamic and evolving space, with ongoing advancements in various techniques and applications.
What are the Key Data Covered in this Generative Artificial Intelligence (AI) Market Research and Growth Report?
-
What is the expected growth of the Generative Artificial Intelligence (AI) Market between 2025 and 2029?
-
USD 185.82 billion, at a CAGR of 59.4%
-
-
What segmentation does the market report cover?
-
The report segmented by Component (Software and Services), Technology (Transformers, Generative adversarial networks (GANs), Variational autoencoder (VAE), and Diffusion networks), Geography (North America, APAC, Europe, South America, and Middle East and Africa), Application (Computer Vision, NLP, Robotics & Automation, Content Generation, Chatbots & Intelligent Virtual Assistants, Predictive Analytics, and Others), End-Use (Media & Entertainment, BFSI, IT & Telecommunication, Healthcare, Automotive & Transportation, Gaming, Others, Media & Entertainment, BFSI, IT & Telecommunication, Healthcare, Automotive & Transportation, Gaming, and Others), and Model (Large Language Models, Image & Video Generative Models, Multi-modal Generative Models, Others, Large Language Models, Image & Video Generative Models, Multi-modal Generative Models, and Others)
-
-
Which regions are analyzed in the report?
-
North America, APAC, Europe, South America, and Middle East and Africa
-
-
What are the key growth drivers and market challenges?
-
Increasing demand for AI-generated content, Lack of quality data
-
-
Who are the major players in the Generative Artificial Intelligence (AI) Market?
-
Key Companies OpenAI, Google LLC, Microsoft Corporation, Anthropic, Hugging Face Inc., Stability AI, xAI, DeepMind Technologies Limited, Graphcore Ltd., SAP SE, Atos SE, Capgemini SE, TietoEVRY Corporation, Fujitsu Limited, NTT Data Corporation, Tencent Holdings Ltd., Baidu Inc., SenseTime Group Ltd., Tata Consultancy Services Ltd., and Infosys Ltd.
-
Market Research Insights
- The market continues to evolve, with significant advancements in various AI subfields. Two notable areas of growth are graph neural networks and generative models. According to recent estimates, the global market for graph neural networks is projected to reach USD11.5 billion by 2027, growing at a compound annual growth rate (CAGR) of 47.5% from 2020. In contrast, the generative models market is expected to reach USD30.3 billion by 2026, expanding at a CAGR of 31.4% during the same period. These figures underscore the increasing importance of these AI subfields. Graph neural networks excel in handling complex relationships in data, making them valuable for applications like recommendation systems and fraud detection.
- Generative models, meanwhile, can create new data, such as synthetic images or text, and have applications in areas like image captioning and text generation. Both subfields require various techniques, including data cleaning processes, dimensionality reduction, and loss functions, to optimize model performance.
We can help! Our analysts can customize this generative artificial intelligence (ai) market research report to meet your requirements.
 RIA -
RIA - 
