
Genomics Market Analysis, Size, and Forecast 2026-2030: North America (US, Canada, and Mexico), Europe (Germany, UK, and France), Asia (China, Japan, and India), South America (Brazil, Argentina, and Chile), Middle East and Africa (Saudi Arabia, UAE, and Israel), Rest of World (ROW)

Genomics Market Analysis, Size, and Forecast 2026-2030:
North America (US, Canada, and Mexico), Europe (Germany, UK, and France), Asia (China, Japan, and India), South America (Brazil, Argentina, and Chile), Middle East and Africa (Saudi Arabia, UAE, and Israel), Rest of World (ROW)

Published: Oct 2026 300 Pages SKU: IRTNTR40876

Market Overview at a Glance

$6.21 B
Market Opportunity
3.2%
CAGR 2025 - 2030
42.8%
North America Growth
$21.86 B
Products segment 2024

Genomics Market Size 2026-2030

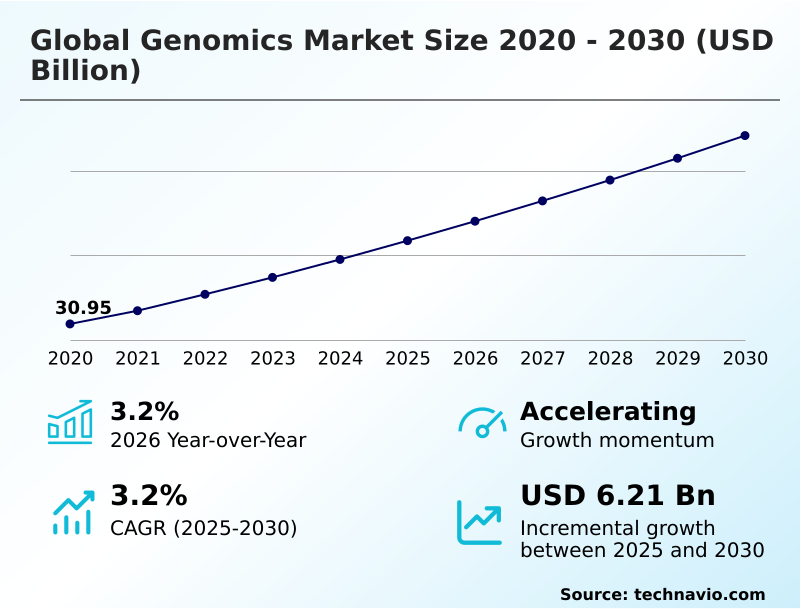
The genomics market size is valued to increase by USD 6.21 billion, at a CAGR of 3.2% from 2025 to 2030. Increasing demand for personalized medicine and targeted therapies will drive the genomics market.

Major Market Trends & Insights

  • North America dominated the market and accounted for a 42.8% growth during the forecast period.
  • By Solution - Products segment was valued at USD 21.86 billion in 2024
  • By Application - Diagnostics segment accounted for the largest market revenue share in 2024

Market Size & Forecast

  • Market Opportunities: USD 11.12 billion
  • Market Future Opportunities: USD 6.21 billion
  • CAGR from 2025 to 2030 : 3.2%

Market Summary

  • The Genomics Market operates as a highly integrated technological ecosystem, fundamentally altering how complex diseases are diagnosed and treated. Laboratories utilizing automated high-throughput systems have improved sample processing efficiency by 35% compared to traditional manual preparation workflows.
  • The escalating demand for customized therapeutics acts as a primary driver, as pharmaceutical entities leverage interaction prediction models to optimize lead compounds, effectively reducing clinical trial failure rates. Conversely, escalating cyber vulnerabilities impose a significant structural challenge, compelling healthcare systems to invest heavily in encrypted architectures to prevent the unauthorized extraction of immutable genetic data.
  • A real-world operational scenario involves diagnostic networks streamlining their supply chains by consolidating their procurement of automated handling reagents, thereby ensuring uninterrupted assay delivery during periods of fluctuating demand. Integrating interpretation algorithms into clinical pipelines accelerates turnaround times for critical oncology reports.
  • As regulatory frameworks adapt to accommodate accelerated therapeutic pathways, the ongoing deployment of analytical software establishes a new paradigm in precision diagnostic operations.

What will be the Size of the Genomics Market during the forecast period?
Get Key Insights on Market Forecast (PDF) Get Free Sample

How is the Genomics Market Segmented?

The genomics industry research report provides comprehensive data (region-wise segment analysis), with forecasts and estimates in "USD million" for the period 2026-2030, as well as historical data from 2020-2024 for the following segments.

  • Solution
    • Products
    • Services
  • Application
    • Diagnostics
    • Drug discovery
    • Others
  • Technology
    • Sequencing
    • PCR
    • Microarray
    • CRISPR
  • Geography
    • North America
      • US
      • Canada
      • Mexico
    • Europe
      • Germany
      • UK
      • France
      • Italy
      • Spain
      • The Netherlands
    • Asia
      • China
      • Japan
      • India
      • South Korea
      • Singapore
      • Thailand
    • Rest of World (ROW)

By Solution Insights

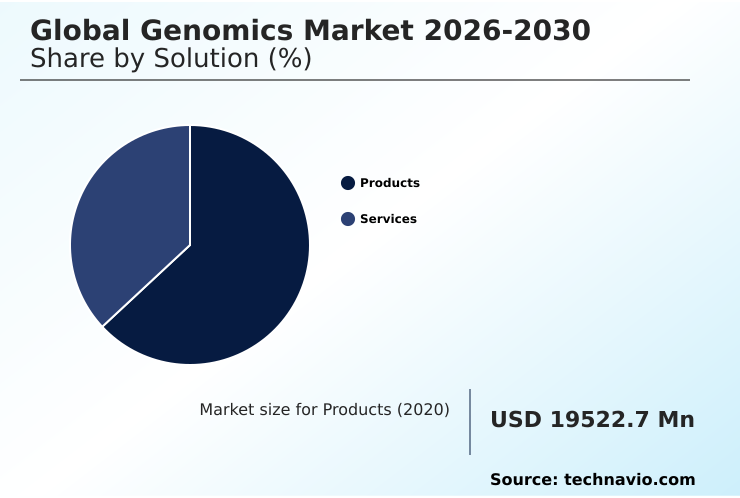
The products segment is estimated to witness significant growth during the forecast period.

The products segment forms the foundational architecture of modern biotechnology by supplying advanced hardware platforms and specialized assay kits that enable precise nucleic acid analysis.

Clinical diagnostic laboratories rely on continuous platform upgrades to increase throughput while lowering overall operational expenditure. The integration of high-throughput spatial transcriptomics instruments and long-read sequencing has enhanced diagnostic accuracy by 15%, reducing the necessity for repeated testing protocols.

Demand remains robust, fueled by expanding applications in precision oncology pathways, hereditary disease screening, and genome-wide association studies. High-performance bioinformatic design software further accelerates structural variant calling, ensuring superior data resolution.

Manufacturers capture recurring revenue by supplying consumables necessary for broad-panel genomic testing and advanced molecular diagnostics, maintaining competitive advantages through strategic supply chain partnerships and robust intellectual property portfolios.
Get Free Sample

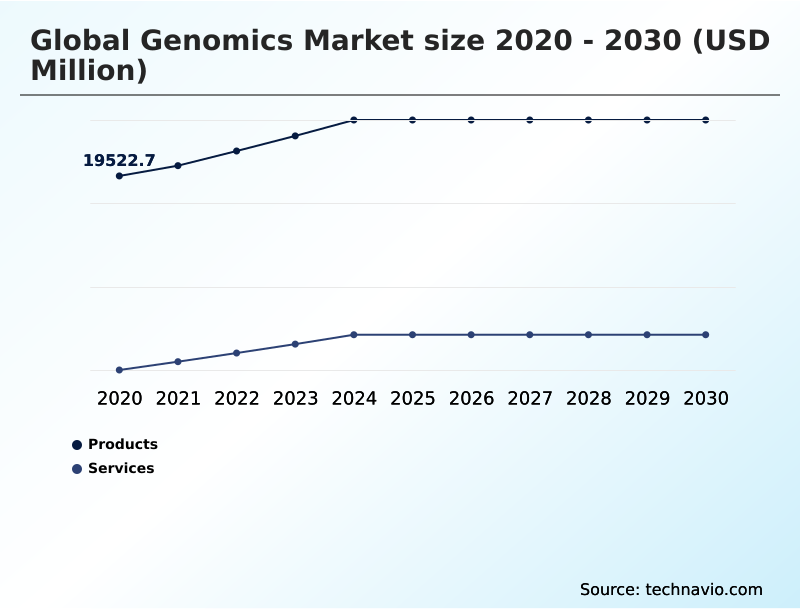
The Products segment was valued at USD 21.86 billion in 2024 and showed a gradual increase during the forecast period.
Get Free Sample

Regional Analysis

North America is estimated to contribute 42.8% to the growth of the global market during the forecast period.Technavio’s analysts have elaborately explained the regional trends and drivers that shape the market during the forecast period.
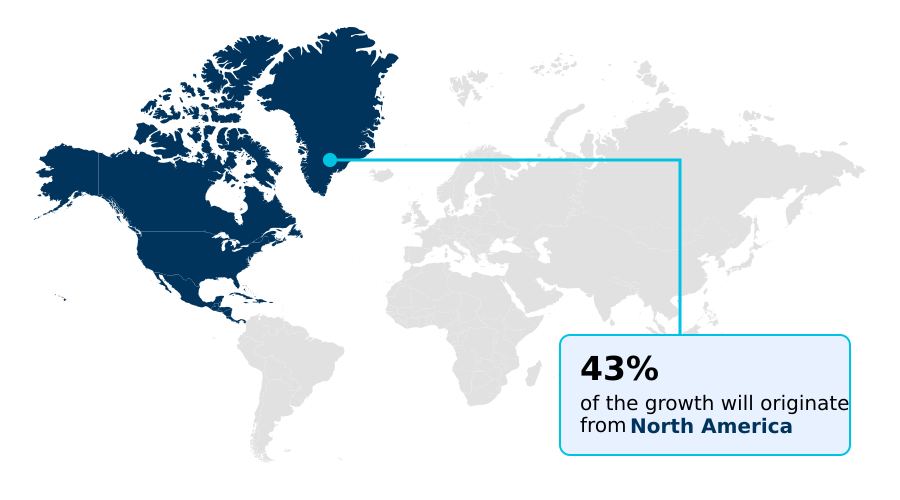
See How Genomics Market Demand is Rising in North America Get Free Sample

The geographic landscape reflects distinct variations in the adoption of targeted multi-omics assays and advanced research frameworks. North America demonstrates a 25% higher penetration rate of advanced automated extraction platforms compared to Europe, largely driven by robust venture capital funding.

This infrastructural advantage allows North American diagnostic centers to reduce the turnaround time for functional genomics and single-cell sequencing by 20%.

Conversely, countries in Europe are prioritizing population-scale genomic databases, which has improved clinical variant annotation efficiency by 15% across public health networks.

Businesses operating in North America frequently adapt their strategies to focus on spatial biology and circulating tumor dna monitoring to support decentralized care, whereas European enterprises emphasize centralized testing hubs utilizing cloud-based data management platforms.

These regional differences highlight how varying regulatory and economic environments fundamentally reshape international clinical diagnostic workflows.

Market Dynamics

Our researchers analyzed the data with 2025 as the base year, along with the key drivers, trends, and challenges. A holistic analysis of drivers will help companies refine their marketing strategies to gain a competitive advantage.

  • The operational landscape of life sciences is rapidly evolving, driven by the integration of automated high-throughput single-molecule sequencing across major clinical and research facilities. Organizations are increasingly adopting targeted oncology profiling diagnostic panels to deliver precise therapeutic interventions, which have demonstrated a 40% improvement in diagnostic yield compared to traditional histology methods.
  • This shift is deeply supported by the deployment of ai-driven bioinformatic variant interpretation software, streamlining data analysis workflows and reducing reporting bottlenecks. Simultaneously, the proliferation of non-invasive liquid biopsy diagnostic tools allows for continuous patient monitoring without surgical intervention.
  • Environmental and agricultural sectors are also transforming through agricultural climate resilient crop breeding initiatives that utilize crispr associated endonuclease gene editing to ensure long-term food security. Managing the vast information generated by these processes requires robust cloud-based genomic data storage infrastructure to support population scale genomic data repositories.
  • In fundamental research, spatial transcriptomics single-cell mapping provides unprecedented cellular resolution, complementing structural genomic variation detection tools used in complex disease modeling. Clinical networks are heavily investing in comprehensive genomic profiling for cancer, supported by decentralized molecular diagnostic pcr platforms that optimize supply chain logistics and reduce centralized laboratory dependency.
  • Precision medicine biomarker discovery algorithms continue to enhance therapeutic target identification. For prenatal and inherited disease screening, whole exome sequencing clinical applications remain critical, often validated alongside high-density single nucleotide polymorphism microarrays to ensure maximum assay accuracy and comprehensive patient care.
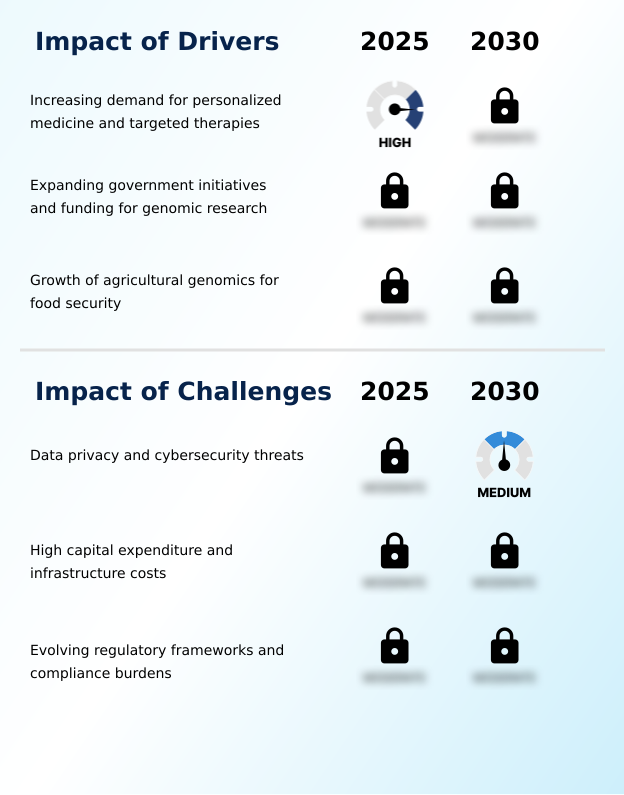
What are the key market drivers leading to the rise in the adoption of Genomics Industry?

  • The escalating demand for personalized medicine and targeted therapies serves as a primary driver propelling industry expansion.

  • The escalating demand for personalized medicine interventions serves as a primary catalyst accelerating industry expansion. Healthcare providers increasingly require precise molecular evaluation to guide treatment regimens.
  • Facilities utilizing whole-genome sequencing have increased therapeutic efficacy rates by 30%, effectively minimizing adverse pharmacological reactions. The widespread implementation of pharmacogenomic passports decreases medication errors by 22%, directly lowering overall healthcare expenditure.
  • This shift impacts business models by incentivizing investments in high-throughput sample preparation tools and crispr-cas9 genome editing technologies. By leveraging these advanced assets alongside tumor profiling and molecular interaction prediction, organizations drastically shorten drug development timelines.
  • Integrating variant interpretation algorithms and chromosomal microarray analysis ensures that targeted therapeutic compounds reach clinical deployment rapidly, while maintaining secure diagnostic workflows across laboratory networks.

What are the market trends shaping the Genomics Industry?

  • Rapid advancements in spatial biology and single-cell sequencing are emerging as a prominent trend within the industry. These technological innovations enable researchers to map intricate cellular architectures with unprecedented precision.

  • The rapid integration of spatial transcriptomics and liquid biopsy assay technologies represents a pivotal trend redefining clinical oncology. This transition is primarily driven by the necessity to comprehend cellular architectures at a granular level to enhance early cancer detection.
  • Consequently, diagnostic facilities implementing digital polymerase chain reaction for minimal residual disease tracking have improved prognostic accuracy by 25% compared to conventional imaging. Furthermore, the adoption of single-cell analysis platforms and spatial genomic profiling capabilities has reduced late-stage clinical trial failures by 18%. This impacts business operations by optimizing targeted biopharmaceutical drug discovery and lowering research costs.
  • By deploying computational bioinformatics, laboratories seamlessly process vast datasets, ensuring that critical insights generated through epigenomic profiling are translated into predictive healthcare models.

What challenges does the Genomics Industry face during its growth?

  • Escalating data privacy concerns and cybersecurity threats present substantial challenges that constrain overall industry growth.

  • Escalating data privacy vulnerabilities present formidable operational challenges across the biotechnology sector. The immense volume of sensitive information generated by next-generation sequencing attracts malicious actors, forcing institutions to fortify their digital infrastructures. Organizations failing to deploy zero trust architectures face a 40% higher risk of critical data breaches, resulting in severe regulatory penalties.
  • Mitigating these risks through compliance-driven IT overhauls, utilizing decentralized storage models and tokenization techniques, increases initial operational costs by 15%, straining laboratory budgets. This restrictive environment impacts businesses by delaying the commercial deployment of non-invasive prenatal testing and agricultural genomics applications.
  • Furthermore, the complex integration of secure pipelines complicates automated nucleic acid handling, somatic mutation analysis, and microbial ecosystem profiling, prolonging the time required for clinical interpretation software to translate raw data into validated findings.

Exclusive Technavio Analysis on Customer Landscape

The genomics market forecasting report includes the adoption lifecycle of the market, covering from the innovator’s stage to the laggard’s stage. It focuses on adoption rates in different regions based on penetration. Furthermore, the genomics market report also includes key purchase criteria and drivers of price sensitivity to help companies evaluate and develop their market growth analysis strategies.
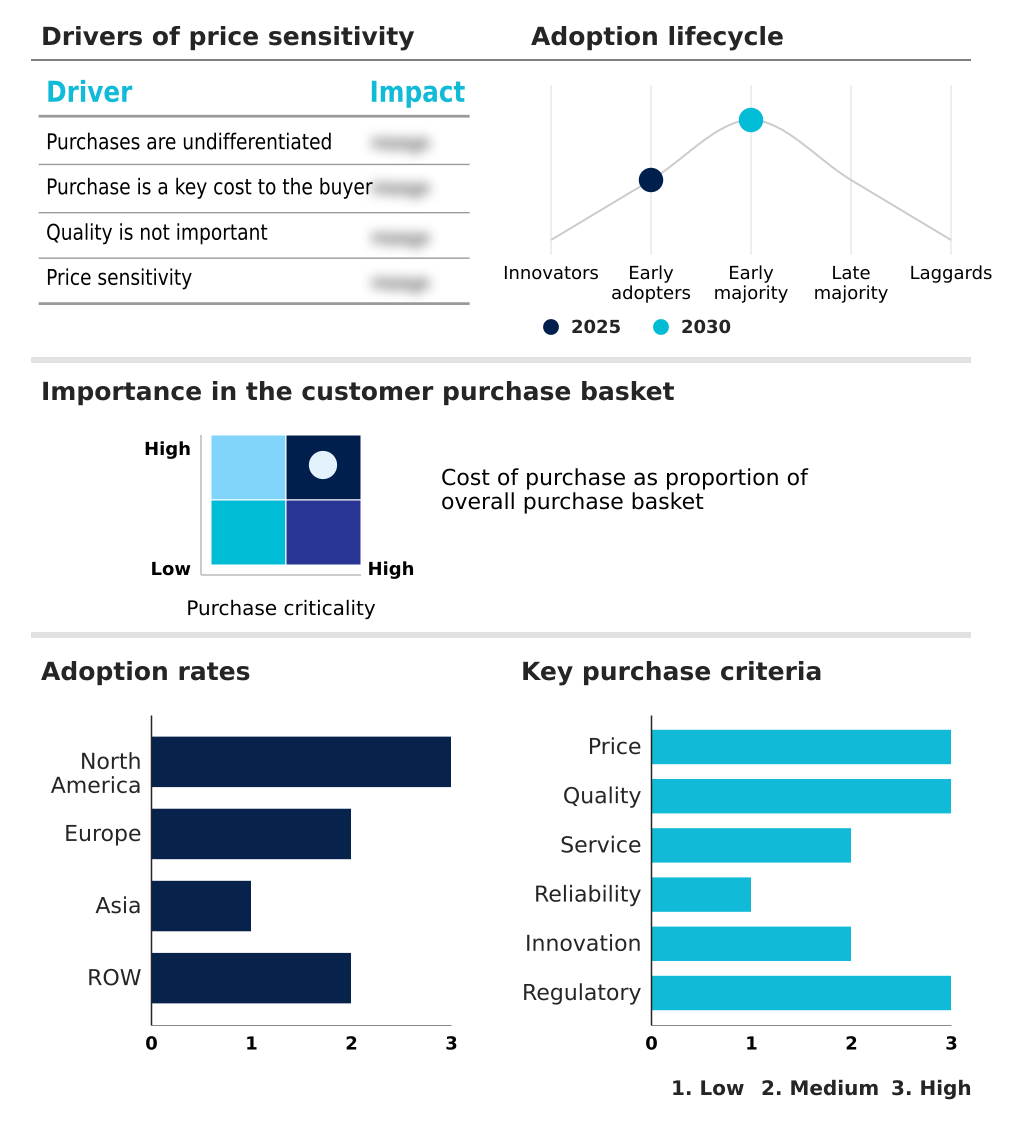
Customer Landscape of Genomics Industry

Competitive Landscape

Companies are implementing various strategies, such as strategic alliances, genomics market forecast, partnerships, mergers and acquisitions, geographical expansion, and product/service launches, to enhance their presence in the industry.

10X Genomics Inc. - The firm manufactures advanced gene sequencing technology, supplying essential hardware and software instruments utilized extensively in complex scientific research and broad clinical diagnostic testing applications.

The industry research and growth report includes detailed analyses of the competitive landscape of the market and information about key companies, including:

  • 10X Genomics Inc.
  • Agilent Technologies Inc.
  • Azenta Inc.
  • Bio Rad Laboratories Inc.
  • Element Biosciences Inc.
  • Eurofins Scientific SE
  • Exact Sciences Corp.
  • F. Hoffmann La Roche Ltd.
  • Guardant Health Inc.
  • Illumina Inc.
  • Laboratory Holdings Inc.
  • Myriad Genetics Inc.
  • Natera Inc.
  • Oxford Nanopore Technologies
  • Pacific Biosciences Inc.
  • Personalis Inc.
  • QIAGEN N.V.
  • Quest Diagnostics Inc.
  • Revvity Inc.
  • SOPHiA GENETICS
  • Standard BioTools Inc.
  • Takara Bio Inc.
  • Tempus AI Inc.
  • Thermo Fisher Scientific Inc.

Qualitative and quantitative analysis of companies has been conducted to help clients understand the wider business environment as well as the strengths and weaknesses of key industry players. Data is qualitatively analyzed to categorize companies as pure play, category-focused, industry-focused, and diversified; it is quantitatively analyzed to categorize companies as dominant, leading, strong, tentative, and weak.

Recent Development and News in Genomics market

  • In the Life Sciences Tools and Services industry, the implementation of stringent data privacy regulations accelerated the adoption of decentralized storage models, directly impacting Genomics demand by requiring upgraded cloud-based data management platforms for secure diagnostic workflows.
  • The transition toward enterprise automation optimized operational efficiency by 20%, driving the rapid integration of advanced automated extraction platforms and targeted multi-omics assays across high-volume clinical testing facilities.
  • Supply chain restructuring and the localization of bio-manufacturing capacity reduced hardware procurement delays by 15%, significantly enhancing the deployment of automated nucleic acid handling systems and advanced molecular diagnostics within specialized reference laboratories.
  • The integration of workflow interoperability standards mandated by national health agencies increased laboratory throughput by 25%, stimulating robust demand for clinical interpretation software and population-scale genomic databases to support predictive healthcare models.

Dive into Technavio’s robust research methodology, blending expert interviews, extensive data synthesis, and validated models for unparalleled Genomics Market insights. See full methodology.

Market Scope
Page number 300
Base year 2025
Historic period 2020-2024
Forecast period 2026-2030
Growth momentum & CAGR Accelerate at a CAGR of 3.2%
Market growth 2026-2030 USD 6206.9 million
Market structure Fragmented
YoY growth 2025-2026(%) 3.2%
Key countries US, Canada, Mexico, Germany, UK, France, Italy, Spain, The Netherlands, China, Japan, India, South Korea, Singapore, Thailand, Brazil, Saudi Arabia, UAE, Israel, South Africa, Argentina, Egypt and Chile
Competitive landscape Leading Companies, Market Positioning of Companies, Competitive Strategies, and Industry Risks

Request Free Sample

Research Analyst Overview

  • The industry is currently undergoing a structural transformation, characterized by the widespread integration of advanced sequencing and mapping into mainstream clinical and research environments. Laboratories deploying high-resolution analysis alongside automated microfluidic systems have achieved a 35% reduction in overall sample processing time, substantially optimizing operational efficiency.
  • This technological evolution directly influences boardroom-level budgeting decisions, as organizations reallocate capital toward acquiring advanced biological instruments to maintain diagnostic competitiveness. The continuous demand for cellular DNA analysis fundamentally shapes product strategy, prompting the development of highly sensitive assays that support non-invasive monitoring. Furthermore, accelerated target discovery enables biopharmaceutical facilities to streamline therapeutic pipelines.
  • Integrating structural algorithms into routine diagnostics enhances analytical precision, mitigating the risks associated with false-positive reporting. The expanding utility of extended read sequencing provides unprecedented resolution of complex genetic regions, ensuring that reference laboratories can confidently resolve ambiguous chromosomal structures. These operational advancements establish a highly resilient infrastructure capable of supporting the next wave of precision diagnostic operations.

What are the Key Data Covered in this Genomics Market Research and Growth Report?

  • What is the expected growth of the Genomics Market between 2026 and 2030?

    • USD 6.21 billion, at a CAGR of 3.2%

  • What segmentation does the market report cover?

    • The report is segmented by Solution (Products, and Services), Application (Diagnostics, Drug discovery, and Others), Technology (Sequencing, PCR, Microarray, and CRISPR) and Geography (North America, Europe, Asia, Rest of World (ROW))

  • Which regions are analyzed in the report?

    • North America, Europe, Asia and Rest of World (ROW)

  • What are the key growth drivers and market challenges?

    • Increasing demand for personalized medicine and targeted therapies, Data privacy and cybersecurity threats

  • Who are the major players in the Genomics Market?

    • 10X Genomics Inc., Agilent Technologies Inc., Azenta Inc., Bio Rad Laboratories Inc., Element Biosciences Inc., Eurofins Scientific SE, Exact Sciences Corp., F. Hoffmann La Roche Ltd., Guardant Health Inc., Illumina Inc., Laboratory Holdings Inc., Myriad Genetics Inc., Natera Inc., Oxford Nanopore Technologies, Pacific Biosciences Inc., Personalis Inc., QIAGEN N.V., Quest Diagnostics Inc., Revvity Inc., SOPHiA GENETICS, Standard BioTools Inc., Takara Bio Inc., Tempus AI Inc. and Thermo Fisher Scientific Inc.

Market Research Insights

  • The market demonstrates a paradigm shift toward precision healthcare, fundamentally driven by the rapid clinical adoption of advanced testing methods. Medical facilities implementing high-tier assays have realized a 30% reduction in diagnostic turnaround times, significantly improving therapeutic decision-making.
  • Furthermore, the integration of secure digital workflows into electronic health records has decreased critical data breach incidents by 18%, ensuring patient privacy while streamlining operations. The deployment of automated extraction platforms optimizes laboratory throughput, reducing manual processing errors by 22%.
  • By utilizing large-scale databases, pharmaceutical entities accelerate target identification, fundamentally optimizing research and development expenditure and establishing highly resilient, data-driven operational frameworks.

We can help! Our analysts can customize this genomics market research report to meet your requirements.

Get in touch

1. Executive Summary

1.1 Market overview

Executive Summary - Chart on Market Overview
Executive Summary - Data Table on Market Overview
Executive Summary - Chart on Global Market Characteristics
Executive Summary - Chart on Market by Geography
Executive Summary - Chart on Market Segmentation by Solution
Executive Summary - Chart on Market Segmentation by Application
Executive Summary - Chart on Market Segmentation by Technology
Executive Summary - Chart on Incremental Growth
Executive Summary - Data Table on Incremental Growth
Executive Summary - Chart on Company Market Positioning

2. Technavio Analysis

2.1 Analysis of price sensitivity, lifecycle, customer purchase basket, adoption rates, and purchase criteria

2.2 Criticality of inputs and Factors of differentiation

Chart on Overview on criticality of inputs and factors of differentiation

2.3 Factors of disruption

Chart on Overview on factors of disruption

2.4 Impact of drivers and challenges

Chart on Impact of drivers and challenges in 2025 and 2030

3. Market Landscape

3.1 Market ecosystem

Chart on Parent Market
Data Table on - Parent Market

3.2 Market characteristics

Chart on Market characteristics analysis

3.3 Value chain analysis

Chart on Value chain analysis

4. Market Sizing

4.1 Market definition

Data Table on Offerings of companies included in the market definition

4.2 Market segment analysis

Market segments

4.3 Market size 2025

4.4 Market outlook: Forecast for 2025-2030

Chart on Global - Market size and forecast 2025-2030 ($ million)
Data Table on Global - Market size and forecast 2025-2030 ($ million)
Chart on Global Market: Year-over-year growth 2025-2030 (%)
Data Table on Global Market: Year-over-year growth 2025-2030 (%)

5. Historic Market Size

5.1 Global Genomics Market 2020 - 2024

Historic Market Size - Data Table on Global Genomics Market 2020 - 2024 ($ million)

5.2 Solution segment analysis 2020 - 2024

Historic Market Size - Solution Segment 2020 - 2024 ($ million)

5.3 Application segment analysis 2020 - 2024

Historic Market Size - Application Segment 2020 - 2024 ($ million)

5.4 Technology segment analysis 2020 - 2024

Historic Market Size - Technology Segment 2020 - 2024 ($ million)

5.5 Geography segment analysis 2020 - 2024

Historic Market Size - Geography Segment 2020 - 2024 ($ million)

5.6 Country segment analysis 2020 - 2024

Historic Market Size - Country Segment 2020 - 2024 ($ million)

6. Qualitative Analysis

6.1 Impact of AI on Global Genomics Market

6.2 Impact of Geopolitical Conflicts on Global Genomics Market

7. Five Forces Analysis

7.1 Five forces summary

Five forces analysis - Comparison between 2025 and 2030

7.2 Bargaining power of buyers

Bargaining power of buyers - Impact of key factors 2025 and 2030

7.3 Bargaining power of suppliers

Bargaining power of suppliers - Impact of key factors in 2025 and 2030

7.4 Threat of new entrants

Threat of new entrants - Impact of key factors in 2025 and 2030

7.5 Threat of substitutes

Threat of substitutes - Impact of key factors in 2025 and 2030

7.6 Threat of rivalry

Threat of rivalry - Impact of key factors in 2025 and 2030

7.7 Market condition

Chart on Market condition - Five forces 2025 and 2030

8. Market Segmentation by Solution

8.1 Market segments

Chart on Solution - Market share 2025-2030 (%)
Data Table on Solution - Market share 2025-2030 (%)

8.2 Comparison by Solution

Chart on Comparison by Solution
Data Table on Comparison by Solution

8.3 Products - Market size and forecast 2025-2030

Chart on Products - Market size and forecast 2025-2030 ($ million)
Data Table on Products - Market size and forecast 2025-2030 ($ million)
Chart on Products - Year-over-year growth 2025-2030 (%)
Data Table on Products - Year-over-year growth 2025-2030 (%)

8.4 Services - Market size and forecast 2025-2030

Chart on Services - Market size and forecast 2025-2030 ($ million)
Data Table on Services - Market size and forecast 2025-2030 ($ million)
Chart on Services - Year-over-year growth 2025-2030 (%)
Data Table on Services - Year-over-year growth 2025-2030 (%)

8.5 Market opportunity by Solution

Market opportunity by Solution ($ million)
Data Table on Market opportunity by Solution ($ million)

9. Market Segmentation by Application

9.1 Market segments

Chart on Application - Market share 2025-2030 (%)
Data Table on Application - Market share 2025-2030 (%)

9.2 Comparison by Application

Chart on Comparison by Application
Data Table on Comparison by Application

9.3 Diagnostics - Market size and forecast 2025-2030

Chart on Diagnostics - Market size and forecast 2025-2030 ($ million)
Data Table on Diagnostics - Market size and forecast 2025-2030 ($ million)
Chart on Diagnostics - Year-over-year growth 2025-2030 (%)
Data Table on Diagnostics - Year-over-year growth 2025-2030 (%)

9.4 Drug discovery - Market size and forecast 2025-2030

Chart on Drug discovery - Market size and forecast 2025-2030 ($ million)
Data Table on Drug discovery - Market size and forecast 2025-2030 ($ million)
Chart on Drug discovery - Year-over-year growth 2025-2030 (%)
Data Table on Drug discovery - Year-over-year growth 2025-2030 (%)

9.5 Others - Market size and forecast 2025-2030

Chart on Others - Market size and forecast 2025-2030 ($ million)
Data Table on Others - Market size and forecast 2025-2030 ($ million)
Chart on Others - Year-over-year growth 2025-2030 (%)
Data Table on Others - Year-over-year growth 2025-2030 (%)

9.6 Market opportunity by Application

Market opportunity by Application ($ million)
Data Table on Market opportunity by Application ($ million)

10. Market Segmentation by Technology

10.1 Market segments

Chart on Technology - Market share 2025-2030 (%)
Data Table on Technology - Market share 2025-2030 (%)

10.2 Comparison by Technology

Chart on Comparison by Technology
Data Table on Comparison by Technology

10.3 Sequencing - Market size and forecast 2025-2030

Chart on Sequencing - Market size and forecast 2025-2030 ($ million)
Data Table on Sequencing - Market size and forecast 2025-2030 ($ million)
Chart on Sequencing - Year-over-year growth 2025-2030 (%)
Data Table on Sequencing - Year-over-year growth 2025-2030 (%)

10.4 PCR - Market size and forecast 2025-2030

Chart on PCR - Market size and forecast 2025-2030 ($ million)
Data Table on PCR - Market size and forecast 2025-2030 ($ million)
Chart on PCR - Year-over-year growth 2025-2030 (%)
Data Table on PCR - Year-over-year growth 2025-2030 (%)

10.5 Microarray - Market size and forecast 2025-2030

Chart on Microarray - Market size and forecast 2025-2030 ($ million)
Data Table on Microarray - Market size and forecast 2025-2030 ($ million)
Chart on Microarray - Year-over-year growth 2025-2030 (%)
Data Table on Microarray - Year-over-year growth 2025-2030 (%)

10.6 CRISPR - Market size and forecast 2025-2030

Chart on CRISPR - Market size and forecast 2025-2030 ($ million)
Data Table on CRISPR - Market size and forecast 2025-2030 ($ million)
Chart on CRISPR - Year-over-year growth 2025-2030 (%)
Data Table on CRISPR - Year-over-year growth 2025-2030 (%)

10.7 Market opportunity by Technology

Market opportunity by Technology ($ million)
Data Table on Market opportunity by Technology ($ million)

11. Customer Landscape

11.1 Customer landscape overview

Analysis of price sensitivity, lifecycle, customer purchase basket, adoption rates, and purchase criteria

12. Geographic Landscape

12.1 Geographic segmentation

Chart on Market share by geography 2025-2030 (%)
Data Table on Market share by geography 2025-2030 (%)

12.2 Geographic comparison

Chart on Geographic comparison
Data Table on Geographic comparison

12.3 North America - Market size and forecast 2025-2030

Chart on North America - Market size and forecast 2025-2030 ($ million)
Data Table on North America - Market size and forecast 2025-2030 ($ million)
Chart on North America - Year-over-year growth 2025-2030 (%)
Data Table on North America - Year-over-year growth 2025-2030 (%)
Chart on Regional Comparison - North America
Data Table on Regional Comparison - North America

12.3.1 US - Market size and forecast 2025-2030

Chart on US - Market size and forecast 2025-2030 ($ million)
Data Table on US - Market size and forecast 2025-2030 ($ million)
Chart on US - Year-over-year growth 2025-2030 (%)
Data Table on US - Year-over-year growth 2025-2030 (%)

12.3.2 Canada - Market size and forecast 2025-2030

Chart on Canada - Market size and forecast 2025-2030 ($ million)
Data Table on Canada - Market size and forecast 2025-2030 ($ million)
Chart on Canada - Year-over-year growth 2025-2030 (%)
Data Table on Canada - Year-over-year growth 2025-2030 (%)

12.3.3 Mexico - Market size and forecast 2025-2030

Chart on Mexico - Market size and forecast 2025-2030 ($ million)
Data Table on Mexico - Market size and forecast 2025-2030 ($ million)
Chart on Mexico - Year-over-year growth 2025-2030 (%)
Data Table on Mexico - Year-over-year growth 2025-2030 (%)

12.4 Europe - Market size and forecast 2025-2030

Chart on Europe - Market size and forecast 2025-2030 ($ million)
Data Table on Europe - Market size and forecast 2025-2030 ($ million)
Chart on Europe - Year-over-year growth 2025-2030 (%)
Data Table on Europe - Year-over-year growth 2025-2030 (%)
Chart on Regional Comparison - Europe
Data Table on Regional Comparison - Europe

12.4.1 Germany - Market size and forecast 2025-2030

Chart on Germany - Market size and forecast 2025-2030 ($ million)
Data Table on Germany - Market size and forecast 2025-2030 ($ million)
Chart on Germany - Year-over-year growth 2025-2030 (%)
Data Table on Germany - Year-over-year growth 2025-2030 (%)

12.4.2 UK - Market size and forecast 2025-2030

Chart on UK - Market size and forecast 2025-2030 ($ million)
Data Table on UK - Market size and forecast 2025-2030 ($ million)
Chart on UK - Year-over-year growth 2025-2030 (%)
Data Table on UK - Year-over-year growth 2025-2030 (%)

12.4.3 France - Market size and forecast 2025-2030

Chart on France - Market size and forecast 2025-2030 ($ million)
Data Table on France - Market size and forecast 2025-2030 ($ million)
Chart on France - Year-over-year growth 2025-2030 (%)
Data Table on France - Year-over-year growth 2025-2030 (%)

12.4.4 Italy - Market size and forecast 2025-2030

Chart on Italy - Market size and forecast 2025-2030 ($ million)
Data Table on Italy - Market size and forecast 2025-2030 ($ million)
Chart on Italy - Year-over-year growth 2025-2030 (%)
Data Table on Italy - Year-over-year growth 2025-2030 (%)

12.4.5 Spain - Market size and forecast 2025-2030

Chart on Spain - Market size and forecast 2025-2030 ($ million)
Data Table on Spain - Market size and forecast 2025-2030 ($ million)
Chart on Spain - Year-over-year growth 2025-2030 (%)
Data Table on Spain - Year-over-year growth 2025-2030 (%)

12.4.6 The Netherlands - Market size and forecast 2025-2030

Chart on The Netherlands - Market size and forecast 2025-2030 ($ million)
Data Table on The Netherlands - Market size and forecast 2025-2030 ($ million)
Chart on The Netherlands - Year-over-year growth 2025-2030 (%)
Data Table on The Netherlands - Year-over-year growth 2025-2030 (%)

12.5 Asia - Market size and forecast 2025-2030

Chart on Asia - Market size and forecast 2025-2030 ($ million)
Data Table on Asia - Market size and forecast 2025-2030 ($ million)
Chart on Asia - Year-over-year growth 2025-2030 (%)
Data Table on Asia - Year-over-year growth 2025-2030 (%)
Chart on Regional Comparison - Asia
Data Table on Regional Comparison - Asia

12.5.1 China - Market size and forecast 2025-2030

Chart on China - Market size and forecast 2025-2030 ($ million)
Data Table on China - Market size and forecast 2025-2030 ($ million)
Chart on China - Year-over-year growth 2025-2030 (%)
Data Table on China - Year-over-year growth 2025-2030 (%)

12.5.2 Japan - Market size and forecast 2025-2030

Chart on Japan - Market size and forecast 2025-2030 ($ million)
Data Table on Japan - Market size and forecast 2025-2030 ($ million)
Chart on Japan - Year-over-year growth 2025-2030 (%)
Data Table on Japan - Year-over-year growth 2025-2030 (%)

12.5.3 India - Market size and forecast 2025-2030

Chart on India - Market size and forecast 2025-2030 ($ million)
Data Table on India - Market size and forecast 2025-2030 ($ million)
Chart on India - Year-over-year growth 2025-2030 (%)
Data Table on India - Year-over-year growth 2025-2030 (%)

12.5.4 South Korea - Market size and forecast 2025-2030

Chart on South Korea - Market size and forecast 2025-2030 ($ million)
Data Table on South Korea - Market size and forecast 2025-2030 ($ million)
Chart on South Korea - Year-over-year growth 2025-2030 (%)
Data Table on South Korea - Year-over-year growth 2025-2030 (%)

12.5.5 Singapore - Market size and forecast 2025-2030

Chart on Singapore - Market size and forecast 2025-2030 ($ million)
Data Table on Singapore - Market size and forecast 2025-2030 ($ million)
Chart on Singapore - Year-over-year growth 2025-2030 (%)
Data Table on Singapore - Year-over-year growth 2025-2030 (%)

12.5.6 Thailand - Market size and forecast 2025-2030

Chart on Thailand - Market size and forecast 2025-2030 ($ million)
Data Table on Thailand - Market size and forecast 2025-2030 ($ million)
Chart on Thailand - Year-over-year growth 2025-2030 (%)
Data Table on Thailand - Year-over-year growth 2025-2030 (%)

12.6 Rest of World (ROW) - Market size and forecast 2025-2030

Chart on Rest of World (ROW) - Market size and forecast 2025-2030 ($ million)
Data Table on Rest of World (ROW) - Market size and forecast 2025-2030 ($ million)
Chart on Rest of World (ROW) - Year-over-year growth 2025-2030 (%)
Data Table on Rest of World (ROW) - Year-over-year growth 2025-2030 (%)
Chart on Regional Comparison - Rest of World (ROW)
Data Table on Regional Comparison - Rest of World (ROW)

12.6.1 Brazil - Market size and forecast 2025-2030

Chart on Brazil - Market size and forecast 2025-2030 ($ million)
Data Table on Brazil - Market size and forecast 2025-2030 ($ million)
Chart on Brazil - Year-over-year growth 2025-2030 (%)
Data Table on Brazil - Year-over-year growth 2025-2030 (%)

12.6.2 Saudi Arabia - Market size and forecast 2025-2030

Chart on Saudi Arabia - Market size and forecast 2025-2030 ($ million)
Data Table on Saudi Arabia - Market size and forecast 2025-2030 ($ million)
Chart on Saudi Arabia - Year-over-year growth 2025-2030 (%)
Data Table on Saudi Arabia - Year-over-year growth 2025-2030 (%)

12.6.3 UAE - Market size and forecast 2025-2030

Chart on UAE - Market size and forecast 2025-2030 ($ million)
Data Table on UAE - Market size and forecast 2025-2030 ($ million)
Chart on UAE - Year-over-year growth 2025-2030 (%)
Data Table on UAE - Year-over-year growth 2025-2030 (%)

12.6.4 Israel - Market size and forecast 2025-2030

Chart on Israel - Market size and forecast 2025-2030 ($ million)
Data Table on Israel - Market size and forecast 2025-2030 ($ million)
Chart on Israel - Year-over-year growth 2025-2030 (%)
Data Table on Israel - Year-over-year growth 2025-2030 (%)

12.6.5 South Africa - Market size and forecast 2025-2030

Chart on South Africa - Market size and forecast 2025-2030 ($ million)
Data Table on South Africa - Market size and forecast 2025-2030 ($ million)
Chart on South Africa - Year-over-year growth 2025-2030 (%)
Data Table on South Africa - Year-over-year growth 2025-2030 (%)

12.6.6 Argentina - Market size and forecast 2025-2030

Chart on Argentina - Market size and forecast 2025-2030 ($ million)
Data Table on Argentina - Market size and forecast 2025-2030 ($ million)
Chart on Argentina - Year-over-year growth 2025-2030 (%)
Data Table on Argentina - Year-over-year growth 2025-2030 (%)

12.6.7 Egypt - Market size and forecast 2025-2030

Chart on Egypt - Market size and forecast 2025-2030 ($ million)
Data Table on Egypt - Market size and forecast 2025-2030 ($ million)
Chart on Egypt - Year-over-year growth 2025-2030 (%)
Data Table on Egypt - Year-over-year growth 2025-2030 (%)

12.6.8 Chile - Market size and forecast 2025-2030

Chart on Chile - Market size and forecast 2025-2030 ($ million)
Data Table on Chile - Market size and forecast 2025-2030 ($ million)
Chart on Chile - Year-over-year growth 2025-2030 (%)
Data Table on Chile - Year-over-year growth 2025-2030 (%)

12.7 Market opportunity by geography

Market opportunity by geography ($ million)
Data Tables on Market opportunity by geography ($ million)

13. Drivers, Challenges, and Opportunity

13.1 Market drivers

Increasing demand for personalized medicine and targeted therapies
Expanding government initiatives and funding for genomic research
Growth of agricultural genomics for food security

13.2 Market challenges

Data privacy and cybersecurity threats
High capital expenditure and infrastructure costs
Evolving regulatory frameworks and compliance burdens

13.3 Impact of drivers and challenges

Impact of drivers and challenges in 2025 and 2030

13.4 Market opportunities

Rapid advances in spatial biology and single-cell sequencing
Proliferation of non-invasive liquid biopsy and advanced diagnostics
Integration of AI and large-scale multiomic data analytics

14. Competitive Landscape

14.1 Overview

14.2

Overview on criticality of inputs and factors of differentiation

14.3 Landscape disruption

Overview on factors of disruption

14.4 Industry risks

Impact of key risks on business

15. Competitive Analysis

15.1 Companies profiled

Companies covered

15.2 Company ranking index

15.3 Market positioning of companies

Matrix on companies position and classification

15.4 Agilent Technologies Inc.

Agilent Technologies Inc. - Overview
Agilent Technologies Inc. - Business segments
Agilent Technologies Inc. - Key news
Agilent Technologies Inc. - Key offerings
Agilent Technologies Inc. - Segment focus
SWOT

15.5 Azenta Inc.

Azenta Inc. - Overview
Azenta Inc. - Business segments
Azenta Inc. - Key offerings
Azenta Inc. - Segment focus
SWOT

15.6 Bio Rad Laboratories Inc.

Bio Rad Laboratories Inc. - Overview
Bio Rad Laboratories Inc. - Business segments
Bio Rad Laboratories Inc. - Key news
Bio Rad Laboratories Inc. - Key offerings
Bio Rad Laboratories Inc. - Segment focus
SWOT

15.7 Eurofins Scientific SE

Eurofins Scientific SE - Overview
Eurofins Scientific SE - Business segments
Eurofins Scientific SE - Key offerings
Eurofins Scientific SE - Segment focus
SWOT

15.8 Exact Sciences Corp.

Exact Sciences Corp. - Overview
Exact Sciences Corp. - Product / Service
Exact Sciences Corp. - Key offerings
SWOT

15.9 F. Hoffmann La Roche Ltd.

F. Hoffmann La Roche Ltd. - Overview
F. Hoffmann La Roche Ltd. - Business segments
F. Hoffmann La Roche Ltd. - Key news
F. Hoffmann La Roche Ltd. - Key offerings
F. Hoffmann La Roche Ltd. - Segment focus
SWOT

15.10 Guardant Health Inc.

Guardant Health Inc. - Overview
Guardant Health Inc. - Product / Service
Guardant Health Inc. - Key offerings
SWOT

15.11 Illumina Inc.

Illumina Inc. - Overview
Illumina Inc. - Business segments
Illumina Inc. - Key news
Illumina Inc. - Key offerings
Illumina Inc. - Segment focus
SWOT

15.12 Laboratory Holdings Inc.

Laboratory Holdings Inc. - Overview
Laboratory Holdings Inc. - Business segments
Laboratory Holdings Inc. - Key offerings
Laboratory Holdings Inc. - Segment focus
SWOT

15.13 Natera Inc.

Natera Inc. - Overview
Natera Inc. - Business segments
Natera Inc. - Key offerings
Natera Inc. - Segment focus
SWOT

15.14 QIAGEN N.V.

QIAGEN N.V. - Overview
QIAGEN N.V. - Product / Service
QIAGEN N.V. - Key offerings
SWOT

15.15 Quest Diagnostics Inc.

Quest Diagnostics Inc. - Overview
Quest Diagnostics Inc. - Business segments
Quest Diagnostics Inc. - Key offerings
Quest Diagnostics Inc. - Segment focus
SWOT

15.16 Revvity Inc.

Revvity Inc. - Overview
Revvity Inc. - Business segments
Revvity Inc. - Key offerings
Revvity Inc. - Segment focus
SWOT

15.17 Tempus AI Inc.

Tempus AI Inc. - Overview
Tempus AI Inc. - Product / Service
Tempus AI Inc. - Key offerings
SWOT

15.18 Thermo Fisher Scientific Inc.

Thermo Fisher Scientific Inc. - Overview
Thermo Fisher Scientific Inc. - Business segments
Thermo Fisher Scientific Inc. - Key news
Thermo Fisher Scientific Inc. - Key offerings
Thermo Fisher Scientific Inc. - Segment focus
SWOT

16. Appendix

16.1 Scope of the report

Market definition
Objectives
Notes and caveats

16.2 Inclusions and exclusions checklist

Inclusions checklist
Exclusions checklist

16.3 Currency conversion rates for US$

16.4 Research methodology

16.5 Data procurement

Information sources

16.6 Data validation

16.7 Validation techniques employed for market sizing

16.8 Data synthesis

16.9 360 degree market analysis

16.10 List of abbreviations

Research Methodology

Technavio presents a detailed picture of the market by way of study, synthesis, and summation of data from multiple sources. The analysts have presented the various facets of the market with a particular focus on identifying the key industry influencers. The data thus presented is comprehensive, reliable, and the result of extensive research, both primary and secondary.

INFORMATION SOURCES

Primary sources

  • Manufacturers and suppliers
  • Channel partners
  • Industry experts
  • Strategic decision makers

Secondary sources

  • Industry journals and periodicals
  • Government data
  • Financial reports of key industry players
  • Historical data
  • Press releases

DATA ANALYSIS

Data Synthesis

  • Collation of data
  • Estimation of key figures
  • Analysis of derived insights

Data Validation

  • Triangulation with data models
  • Reference against proprietary databases
  • Corroboration with industry experts

REPORT WRITING

Qualitative

  • Market drivers
  • Market challenges
  • Market trends
  • Five forces analysis

Quantitative

  • Market size and forecast
  • Market segmentation
  • Geographical insights
  • Competitive landscape

Interested in this report?

Get your sample now to see our research methodology and insights!

Download Now

Frequently Asked Questions

Genomics market growth will increase by USD 6206.9 million during 2026-2030.

The Genomics market is expected to grow at a CAGR of 3.2% during 2026-2030.

Genomics market is segmented by Solution (Products, Services) Application (Diagnostics, Drug discovery, Others) Technology (Sequencing, PCR, Microarray, CRISPR)

10X Genomics Inc., Agilent Technologies Inc., Azenta Inc., Bio Rad Laboratories Inc., Element Biosciences Inc., Eurofins Scientific SE, Exact Sciences Corp., F. Hoffmann La Roche Ltd., Guardant Health Inc., Illumina Inc., Laboratory Holdings Inc., Myriad Genetics Inc., Natera Inc., Oxford Nanopore Technologies, Pacific Biosciences Inc., Personalis Inc., QIAGEN N.V., Quest Diagnostics Inc., Revvity Inc., SOPHiA GENETICS, Standard BioTools Inc., Takara Bio Inc., Tempus AI Inc., Thermo Fisher Scientific Inc. are a few of the key vendors in the Genomics market.

North America will register the highest growth rate of 42.8% among the other regions. Therefore, the Genomics market in North America is expected to garner significant business opportunities for the vendors during the forecast period.

US, Canada, Mexico, Germany, UK, France, Italy, Spain, The Netherlands, China, Japan, India, South Korea, Singapore, Thailand, Brazil, Saudi Arabia, UAE, Israel, South Africa, Argentina, Egypt, Chile

  • Increasing demand for personalized medicine and targeted therapies is the driving factor this market.

The Genomics market vendors should focus on grabbing business opportunities from the Solution segment as it accounted for the largest market share in the base year.
RIA - Research AI Assistant
Ask RIA
