
Geriatric Medicines Market Size 2025-2029
The geriatric medicines market size is forecast to increase by USD 57.3 billion at a CAGR of 7.5% between 2024 and 2029.
- The market is experiencing significant growth due to the increasing geriatric population and the rise In therapeutic approaches for age-related diseases. The aging population is a major driver for this market as the elderly population is more susceptible to various health conditions and requires frequent medical intervention. Geriatric medicines include various therapeutic conditions, such as analgesics for pain management, antihypertensives for blood pressure control, statins for cholesterol reduction, antidiabetics for blood sugar management, proton pump inhibitors for gastrointestinal disorders, and anticoagulants for blood thinning. Additionally, the development of new therapeutic approaches and the reduction of side effects associated with geriatric medicines are also contributing to market growth. However, challenges such as the high cost of research and development, stringent regulatory requirements, and the complexity of geriatric diseases pose significant hurdles for market growth. Despite these challenges, the market is expected to continue its growth trajectory due to the increasing demand for effective treatments for age-related diseases.
What will be the Size of the Geriatric Medicines Market During the Forecast Period?

- The market encompasses a diverse range of diagnoses, treatments, and preventive measures designed for the geriatric population, who are disproportionately affected by chronic disorders such as cardiovascular diseases, rheumatoid arthritis, neurological disorders, cancer, high cholesterol levels, and low immunity levels. This therapeutic category is experiencing significant growth due to the aging global population and the increasing prevalence of complex health conditions. Rapid recovery and effective management of these disorders are crucial to ensure the geriatric population maintains optimal health and independence.
- Patented drugs and generic alternatives coexist in this market, with ongoing debates surrounding the balance between innovation and affordability. The geriatric population's polypharmacy and susceptibility to adverse side-effects necessitate a focus on developing safe and effective medicines. Medical tourism and cross-border trade also influence the market dynamics, as some patients seek more affordable options for geriatric medicines.
How is this Geriatric Medicines Industry segmented and which is the largest segment?
The geriatric medicines industry research report provides comprehensive data (region-wise segment analysis), with forecasts and estimates in "USD billion" for the period 2025-2029, as well as historical data from 2019-2023 for the following segments.
- Distribution Channel
- Hospital pharmacies
- Retail pharmacies
- Online pharmacies
- Type
- Analgesics
- Antidiabetics
- Antihypertensives
- Statins
- Others
- Therapeutic Area
- Cardiovascular
- Neurology
- Respiratory
- Others
- Form Factor
- Tablets
- Capsules
- Liquids
- Injectables
- Geography
- North America
- Canada
- US
- Europe
- Germany
- UK
- France
- Italy
- Spain
- Asia
- China
- India
- Rest of World (ROW)
- North America
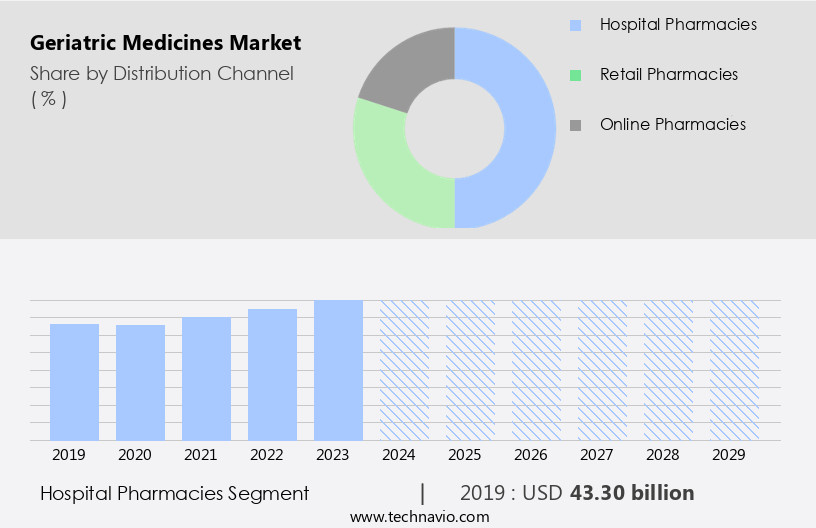
By Distribution Channel Insights
- The hospital pharmacies segment is estimated to witness significant growth during the forecast period.
Hospital pharmacies represent the largest distribution channel for geriatric medicines due to the increasing number of hospitalizations for chronic disorders among the geriatric population. These diseases include cardiovascular disorders such as hypertension and coronary heart disease, neurological disorders like Alzheimer's disease (AD), rheumatoid arthritis, and cancer. Geriatric medicines, including antihypertensives, antidiabetics, statins, antipsychotics, antidepressants, and anticoagulants, are extensively used in hospitals to diagnose, treat, and prevent these conditions. The high prevalence of chronic diseases among the elderly population necessitates the use of these medications, making hospital pharmacies a significant market for geriatric medicines. Additionally, the presence of medical infrastructure, such as hospital pharmacies, ensures rapid recovery and proper care for geriatric patients.
Get a glance at the Geriatric Medicines Industry report of share of various segments Request Free Sample
The hospital pharmacies segment was valued at USD 43.30 billion in 2019 and showed a gradual increase during the forecast period.
Regional Analysis
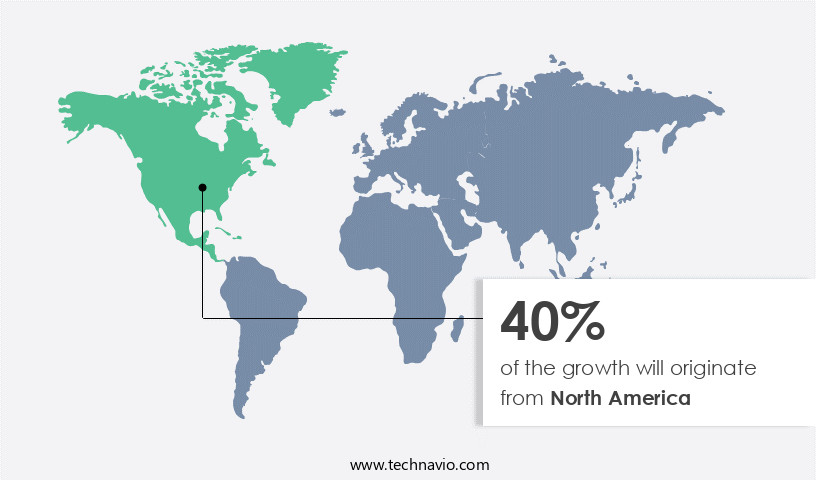
- North America is estimated to contribute 40% to the growth of the global market during the forecast period.
Technavio’s analysts have elaborately explained the regional trends and drivers that shape the market during the forecast period.
For more insights on the market share of various regions, Request Free Sample
The market in North America is expected to dominate the global landscape due to factors including early adoption of analgesics, high awareness for timely treatment, and strong healthcare infrastructure. The region's market growth is further driven by favorable reimbursement policies, increasing FDA drug approvals, and substantial healthcare expenditure. In 2023, U.S. National healthcare spending increased by 7.5% to USD4 trillion. Chronic disorders, such as cardiovascular disorders, rheumatoid arthritis, neurological disorders, cancer, high cholesterol levels, and low immunity levels, are prevalent among the geriatric population. These diseases require continuous medication management. Geriatric medicines include therapeutic categories like antihypertensives, statins, antidiabetics, proton pump inhibitors, anticoagulants, antipsychotics, and antidepressants.
Market Dynamics
Our researchers analyzed the data with 2024 as the base year, along with the key drivers, trends, and challenges. A holistic analysis of drivers will help companies refine their marketing strategies to gain a competitive advantage.
What are the key market drivers leading to the rise In the adoption of Geriatric Medicines Industry?
Growing geriatric population is the key driver of the market.
- The global geriatric population, currently numbering around 850 million individuals aged 65 and above, is projected to grow significantly, potentially reaching 1.6 billion by 2050. This demographic shift is driven by the increasing prevalence of chronic disorders, such as cardiovascular disorders, rheumatoid arthritis, neurological disorders, cancer, high cholesterol levels, and low immunity levels, which are more common in older adults. These diseases often require specialized diagnosis, treatment, and prevention strategies. Geriatric medicine plays a crucial role in addressing the unique healthcare needs of this population. This therapeutic category encompasses a range of conditions, including diseases related to the cardiovascular, arthritis, neurological, osteoporosis, respiratory, and other systems.
- Common therapeutic conditions include hypertension, diabetes, obesity, Alzheimer's disease, and various types of cancer. The complexity of managing these conditions In the geriatric population is compounded by polypharmacy, which increases the risk of adverse side-effects, drug-induced disorders, and adverse drug reactions. Drug interactions and cognitive impairment are also common concerns. Medical infrastructure, including hospital pharmacies, home care, emergency care, and personal care plans, plays a critical role in ensuring the effective and safe delivery of geriatric medicines. The use of patented drugs and generic drugs is prevalent in geriatric medicine. Medical tourism is also an emerging trend, with some patients seeking specialized care in countries with advanced medical infrastructure and lower costs.
What are the market trends shaping the Geriatric Medicines Industry?
Rise in therapeutic approaches is the upcoming market trend.
- The market is witnessing significant growth due to the increasing prevalence of chronic disorders among the geriatric population. These disorders include cardiovascular disorders, such as high cholesterol levels, rheumatoid arthritis, neurological disorders, including Alzheimer's disease (AD), and cancer. Geriatric medicine focuses on the diagnosis, treatment, and prevention of diseases and underlying conditions specific to older adults. Geriatric care involves a multidisciplinary approach, with healthcare professionals such as geriatricians, physicians, pharmacists, nurses, and caregivers collaborating to provide personalized care plans. This approach ensures the effective management of complex medical conditions and potential adverse side-effects of polypharmacy. Innovations in geriatric care are essential for addressing the unique healthcare needs of the geriatric population.
- Strategies include personalized care plans, the integration of age-friendly technologies like wearable health monitors and telehealth platforms, and expanded home-based care services. These advancements aim to improve the quality of life for older adults, reduce hospitalization, and prevent drug-induced disorders and adverse drug reactions. Therapeutic categories for geriatric medicines include analgesics, antihypertensives, statins, antidiabetics, proton pump inhibitors, anticoagulants, antipsychotics, and antidepressants. Patented drugs and generic drugs are both utilized in geriatric medicine to address various therapeutic conditions. Medical infrastructure plays a crucial role In the delivery of geriatric care, with hospital pharmacies and emergency care services essential for managing acute conditions.
What challenges does the Geriatric Medicines Industry face during its growth?
Side effects associated with geriatric medicines is a key challenge affecting the industry growth.
- Geriatric medicines play a crucial role In the diagnosis, treatment, and prevention of diseases for the geriatric population, who are more susceptible to chronic disorders such as cardiovascular disorders, rheumatoid arthritis, neurological disorders, cancer, high cholesterol levels, and low immunity levels. However, the use of these medicines comes with potential risks, including increased sensitivity to medications, higher risks of dizziness and falls, and potential drug accumulation due to slower metabolism and excretion. Severe side effects, such as orthostatic hypotension, heart failure, and delirium, can discourage long-term use and lead to hospitalization. Careful monitoring and personalized medication management are essential for elderly patients to mitigate these risks.
- The market faces challenges due to the potential for drug-induced disorders, adverse drug reactions, and drug interactions. Common therapeutic categories include analgesics, antihypertensives, statins, antidiabetics, proton pump inhibitors, anticoagulants, antipsychotics, and antidepressants for conditions like cardiovascular diseases, arthritis, neurological disorders, osteoporosis, and respiratory diseases. The market includes patented drugs and generic drugs, with hospital pharmacies playing a significant role In their distribution. Medical infrastructure and caregivers are essential in managing the complex needs of elderly patients, and home care and emergency care services are increasingly important. Medical tourism also influences the market dynamics, offering cost-effective alternatives for patients.
Exclusive Customer Landscape
The geriatric medicines market forecasting report includes the adoption lifecycle of the market, covering from the innovator’s stage to the laggard’s stage. It focuses on adoption rates in different regions based on penetration. Furthermore, the geriatric medicines market report also includes key purchase criteria and drivers of price sensitivity to help companies evaluate and develop their market growth analysis strategies.

Customer Landscape
Key Companies & Market Insights
Companies are implementing various strategies, such as strategic alliances, geriatric medicines market forecast, partnerships, mergers and acquisitions, geographical expansion, and product/service launches, to enhance their presence In the industry.
Abbott Laboratories - The company offers geriatric medicines such as Quetiapine.
The industry research and growth report includes detailed analyses of the competitive landscape of the market and information about key companies, including:
- AbbVie Inc.
- AstraZeneca Plc
- Aurobindo Pharma Ltd.
- Boehringer Ingelheim International GmbH
- Bristol Myers Squibb Co.
- Cipla Inc.
- Dr Reddys Laboratories Ltd.
- Eli Lilly and Co.
- Endo International Plc
- GlaxoSmithKline Plc
- Lupin Ltd.
- Merck and Co. Inc.
- Novartis AG
- Otsuka Holdings Co. Ltd.
- Pfizer Inc.
- Sanofi SA
- Sun Pharmaceutical Industries Ltd.
- Teva Pharmaceutical Industries Ltd.
- Viatris Inc.
Qualitative and quantitative analysis of companies has been conducted to help clients understand the wider business environment as well as the strengths and weaknesses of key industry players. Data is qualitatively analyzed to categorize companies as pure play, category-focused, industry-focused, and diversified; it is quantitatively analyzed to categorize companies as dominant, leading, strong, tentative, and weak.
Research Analyst Overview
Geriatric medicine encompasses the diagnosis, treatment, and prevention of various diseases and chronic disorders prevalent among the aging population. This therapeutic category includes a wide range of conditions, from cardiovascular disorders and rheumatoid arthritis to neurological disorders, cancer, and high cholesterol levels. The geriatric population, characterized by low immunity levels and polypharmacy, is particularly susceptible to adverse side-effects, drug-induced disorders, and adverse drug reactions. The rapid recovery and effective management of geriatric patients require a comprehensive approach that goes beyond the mere administration of medications. A personalized care plan incorporating physical assessment, cognitive assessment, and psycho-social assessment is essential for optimal patient outcomes.
In addition, this plan may include home care, emergency care, and hospitalization, depending on the therapeutic condition. Medical infrastructure plays a crucial role In the successful treatment of geriatric patients. Hospital pharmacies, in particular, are indispensable in managing complex medication regimens, minimizing drug interactions, and ensuring the safe and effective use of patented and generic drugs. The therapeutic category of geriatric medicine includes various therapeutic conditions, such as analgesics for pain management, antihypertensives for cardiovascular disorders, statins for high cholesterol levels, antidiabetics for diabetes, and proton pump inhibitors for gastrointestinal disorders. Anticoagulants, antipsychotics, antidepressants, and drugs for neurological, cardiovascular, arthritis, neurological, osteoporosis, respiratory, and other diseases are also part of this category.
Moreover, the prevalence of chronic diseases, such as obesity, diabetes, and Alzheimer's disease (AD), is on the rise among the aging population. Caregivers play a vital role in managing these conditions and ensuring the well-being of geriatric patients. The increasing number of baby boomers entering the geriatric age group further underscores the importance of addressing the unique healthcare needs of this population. The challenges associated with geriatric medicine are numerous, including the complexity of underlying diseases, the potential for serious illnesses, and the risk of drug-induced disorders. However, advances in medical research and technology offer promising solutions, such as targeted therapies, personalized medicine, and telehealth services.
Therefore, geriatric medicine is a vital therapeutic category that addresses the unique healthcare needs of the aging population. Effective diagnosis, treatment, and prevention of various diseases and chronic disorders require a comprehensive, personalized approach that goes beyond the mere administration of medications. A strong medical infrastructure, including hospital pharmacies, and the involvement of caregivers are essential components of successful patient care. The challenges of geriatric medicine are significant, but the potential for innovation and advancement is immense.
|
Market Scope |
|
|
Report Coverage |
Details |
|
Page number |
231 |
|
Base year |
2024 |
|
Historic period |
2019-2023 |
|
Forecast period |
2025-2029 |
|
Growth momentum & CAGR |
Accelerate at a CAGR of 7.5% |
|
Market growth 2025-2029 |
USD 57.3 billion |
|
Market structure |
Fragmented |
|
YoY growth 2024-2025(%) |
7.4 |
|
Key countries |
US, Canada, Germany, China, India, UK, Brazil, France, Italy, and Spain |
|
Competitive landscape |
Leading Companies, market growth and forecasting, Market Positioning of Companies, Competitive Strategies, and Industry Risks |
What are the Key Data Covered in this Geriatric Medicines Market Research and Growth Report?
- CAGR of the Geriatric Medicines industry during the forecast period
- Detailed information on factors that will drive the growth and forecasting between 2025 and 2029
- Precise estimation of the size of the market and its contribution of the industry in focus to the parent market
- Accurate predictions about upcoming growth and trends and changes in consumer behaviour
- Growth of the market across North America, Europe, Asia, and Rest of World (ROW)
- Thorough analysis of the market’s competitive landscape and detailed information about companies
- Comprehensive analysis of factors that will challenge the geriatric medicines market growth of industry companies
We can help! Our analysts can customize this geriatric medicines market research report to meet your requirements.