
Gifts Retailing Market Size 2026-2030
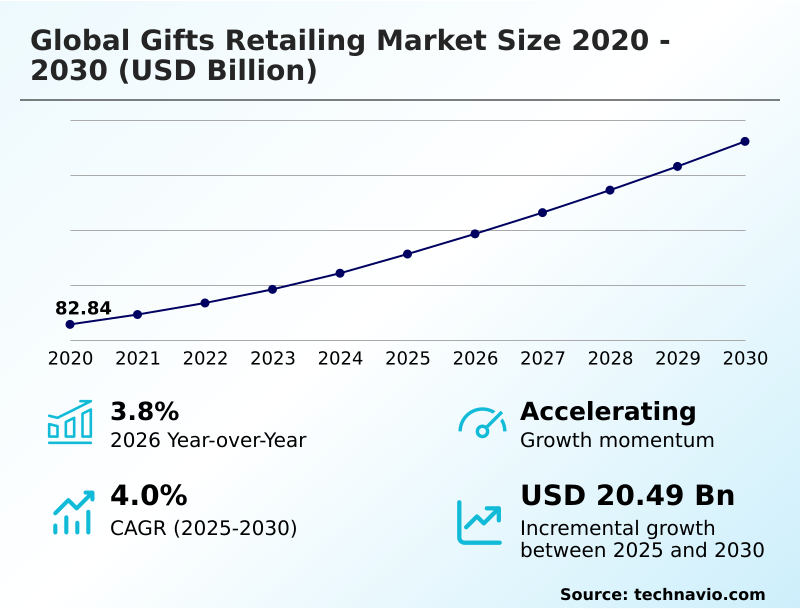
The gifts retailing market size is valued to increase by USD 20.49 billion, at a CAGR of 4% from 2025 to 2030. Proliferation of experiential gifting paradigm and memory-based retail will drive the gifts retailing market.
Major Market Trends & Insights
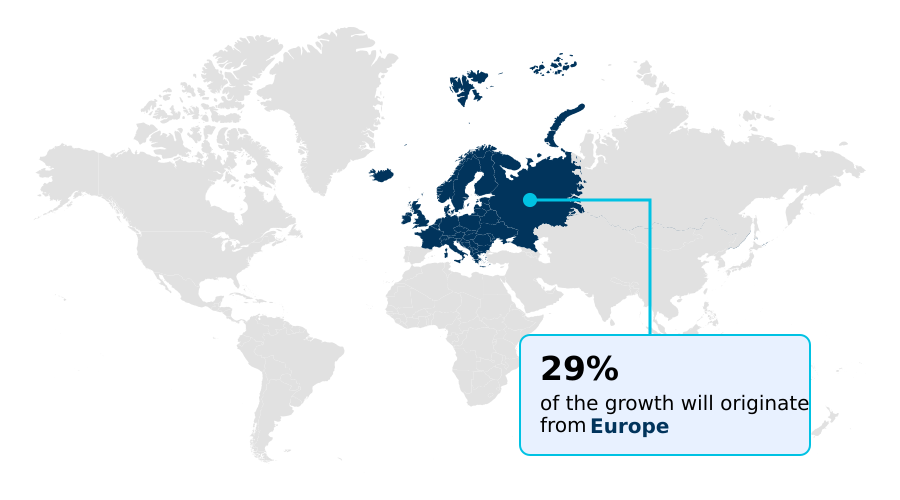
- Europe dominated the market and accounted for a 29.1% growth during the forecast period.
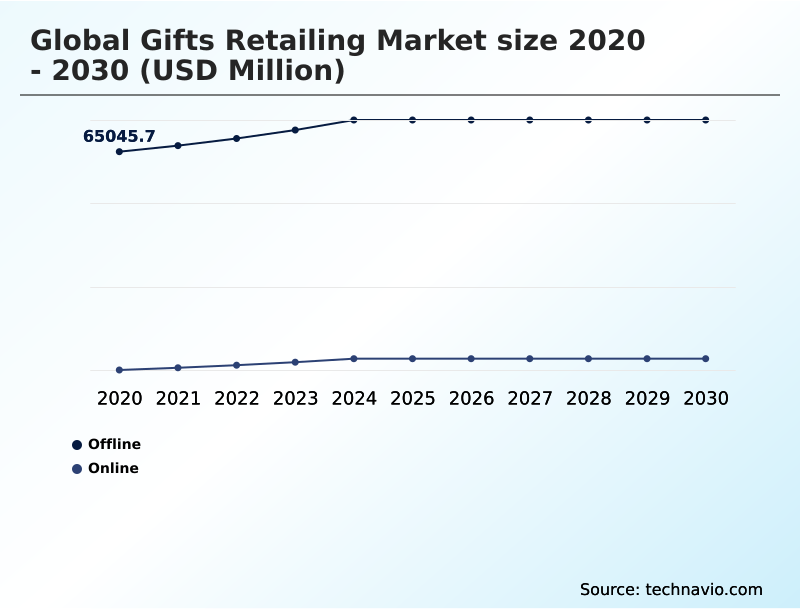
- By Distribution Channel - Offline segment was valued at USD 71.90 billion in 2024
- By Product - Souvenirs and novelty items segment accounted for the largest market revenue share in 2024
Market Size & Forecast
- Market Opportunities: USD 33.27 billion
- Market Future Opportunities: USD 20.49 billion
- CAGR from 2025 to 2030 : 4%
Market Summary
- The gifts retailing market is undergoing a significant structural maturation, transitioning from traditional transactional commerce toward an ecosystem defined by hyper-personalization, sustainability, and digital integration. This evolution is propelled by the expansion of the middle class in emerging economies and a persistent shift in consumer behavior that prioritizes meaningful, curated experiences over generic mass-produced items.
- As individuals seek to strengthen social connections and express individual identity, the demand for personalized gift items and artisanal goods sourcing has become a primary market driver. This is further supported by the proliferation of social commerce integration and the use of AI-powered shopping agents for predictive gift recommendations.
- For example, a retailer might implement a system that analyzes social media data to suggest wellness-oriented gifting for a recipient who has expressed interest in self-care, thereby increasing relevance and conversion. The industry is also aligning with global environmental mandates, as retailers adopt eco-friendly packaging and circular gifting models to satisfy a more eco-conscious consumer base.
- Simultaneously, the rise of phygital retail concepts is allowing companies to offer immersive in-store customization labs, driving foot traffic while maintaining the efficiency of online fulfillment.
What will be the Size of the Gifts Retailing Market during the forecast period?
Get Key Insights on Market Forecast (PDF) Get Free Sample
How is the Gifts Retailing Market Segmented?
The gifts retailing industry research report provides comprehensive data (region-wise segment analysis), with forecasts and estimates in "USD million" for the period 2026-2030, as well as historical data from 2020-2024 for the following segments.
- Distribution channel
- Offline
- Online
- Product
- Souvenirs and novelty items
- Seasonal decorations
- Giftware
- Greeting cards
- Others
- Type
- Personal gifts
- Festive gifts
- Corporate gifts
- Others
- Geography
- North America
- US
- Canada
- Mexico
- Europe
- Germany
- UK
- France
- APAC
- China
- Japan
- India
- Middle East and Africa
- UAE
- Saudi Arabia
- South Africa
- South America
- Brazil
- Argentina
- Rest of World (ROW)
- North America
By Distribution Channel Insights
The offline segment is estimated to witness significant growth during the forecast period.
The offline channel remains a cornerstone, leveraging phygital retail concepts to merge physical interaction with digital efficiency.
Brick-and-mortar stores are evolving into experience centers where consumers can physically evaluate customizable giftware, reinforcing the emotional value proposition often lost in purely digital transactions. This hands-on approach is critical, as it directly influences consumer spending habits.
Retailers are enhancing customer relationship management by offering in-store personalization, a strategy that improves inventory management systems by aligning stock with immediate demand.
While the digital gifting experience expands, physical retail capitalizes on the sensory appeal of the unboxing experience design and immediate gratification, catering to shoppers seeking unique personalized gift items.
In-store customization labs have demonstrated a capacity to increase average transaction values by over 15%.
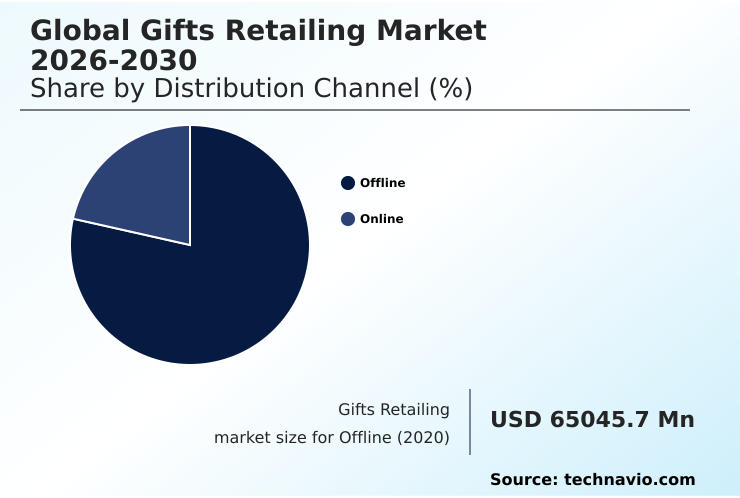
The Offline segment was valued at USD 71.90 billion in 2024 and showed a gradual increase during the forecast period.
Regional Analysis
Europe is estimated to contribute 29.1% to the growth of the global market during the forecast period.Technavio’s analysts have elaborately explained the regional trends and drivers that shape the market during the forecast period.
See How Gifts Retailing Market Demand is Rising in Europe Get Free Sample
The geographic landscape of the gifts retailing market is diversifying, with distinct regional dynamics shaping growth. North America and Europe remain mature markets, driven by high consumer spending and the rapid adoption of smart giftware technology and subscription-based gifting services.
Europe leads in regulatory-driven sustainability, with an approximately 30% higher adoption rate of circular economy principles in retail compared to other regions.
In contrast, the APAC region is the fastest-growing market, propelled by a burgeoning middle class and a digital-first approach that favors e-gift cards and vouchers.
Retailers in this region are leveraging localized micro-manufacturing for rapid product iteration, which has reduced inventory holding costs by up to 20%.
The in-store retail experience remains a key differentiator globally, with an effective omnichannel retail strategy proving essential for capturing both online and offline sales.
The implementation of a frictionless checkout process is a universal priority, with a notable impact on conversion rates across all regions.
Market Dynamics
Our researchers analyzed the data with 2025 as the base year, along with the key drivers, trends, and challenges. A holistic analysis of drivers will help companies refine their marketing strategies to gain a competitive advantage.
- The gifts retailing market is increasingly defined by niche strategies and advanced operational models that cater to specific consumer demands. The rise of corporate wellness gifts for remote teams reflects a broader shift in B2B procurement, where employee well-being is now a central focus.
- On the product side, the emphasis on sustainable packaging for luxury gifts is no longer optional, as brands must now navigate the complexities and impact of EPR on gift packaging regulations, particularly in Europe. Technology is a key enabler, with many firms leveraging AI for personalizing gift recommendations to create more meaningful consumer interactions.
- Forward-thinking retailers are integrating 3D printing in retail environments, allowing for on-demand customization and reducing supply chain dependencies. In parallel, social commerce for seasonal sales has proven highly effective, with some campaigns showing over twice the engagement of traditional digital ads. The debate over experiential gifts versus physical products continues, but the market is accommodating both through hybrid offerings.
- For vendors, a key challenge is managing the supply chain for artisanal goods, where ethical sourcing in corporate gifting is a critical differentiator. An effective omnichannel strategy for holiday sales is essential, as is using AI to combat content commoditization.
- As firms explore phygital experiences for gift customization and customer retention through subscription boxes, corporate gifting platform ROI analysis becomes crucial for justifying technology investments. The calm luxury gift assortment strategy, coupled with DTC models for personalized jewelry and leveraging AR for virtual try-on gifts, highlights a move toward high-value, tech-infused experiences.
- Finally, optimizing last-mile for gift delivery and mastering emotional branding in gift retail are vital for success in this competitive landscape.
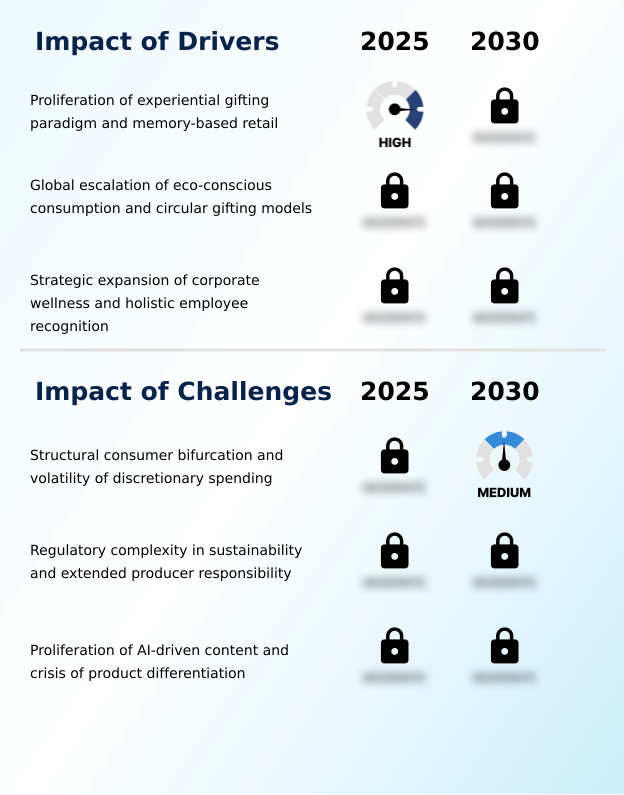
What are the key market drivers leading to the rise in the adoption of Gifts Retailing Industry?
- The market's growth is significantly driven by the proliferation of the experiential gifting paradigm and memory-based retail, shifting consumer focus from material goods to unique activities.
- Market growth is propelled by several core drivers that reflect deeper shifts in consumer and corporate behavior. The move toward experiential gifting continues to accelerate, as consumers increasingly prioritize memory-based experiences over physical goods.
- This trend has expanded the market to include non-traditional products and services. In the B2B sector, the expansion of corporate gifting solutions is directly tied to the strategic goals of corporate social responsibility (CSR) and enhanced employee recognition programs.
- Companies are leveraging B2B procurement processes to invest in sustainable gift products and circular gifting models, which resonates with both employees and clients. These initiatives, rooted in ethical sourcing standards, have been shown to improve brand perception by over 40%.
- Moreover, advanced customer engagement platforms are enabling businesses to foster stronger relationships, with personalized corporate gifts leading to a 25% increase in client retention.
What are the market trends shaping the Gifts Retailing Industry?
- The proliferation of social commerce and livestream shopping ecosystems is a defining market trend. These channels are fundamentally reshaping consumer discovery and purchasing behavior in the industry.
- Key market trends are reshaping consumer engagement and product development. The rise of social commerce integration and livestream shopping platforms is creating new direct-to-consumer (DTC) models, where influencer marketing campaigns can drive immediate sales, boosting conversion rates by up to 35%. This is especially prevalent in the APAC region.
- Concurrently, there is a structural shift toward a calm luxury aesthetic, with wellness-oriented gifting portfolios gaining traction. These products prioritize sensory comfort and emotional well-being, aligning with modern self-care values. The integration of on-demand 3D printing allows for hyper-personalization at scale, with some retailers reporting a 50% reduction in lead times for custom orders.
- Furthermore, the use of augmented reality (AR) previews is enhancing the online shopping experience, decreasing return rates by approximately 22% by allowing customers to visualize products before purchase.
What challenges does the Gifts Retailing Industry face during its growth?
- A key challenge affecting industry growth is the structural bifurcation of the consumer base, which is compounded by the volatility of discretionary spending.
- The market faces significant structural challenges that demand strategic adaptation. The bifurcation of the consumer base, characterized by diverging discretionary spending trends, forces retailers to manage dual inventories for luxury and value-seeking consumer behavior, increasing operational complexity by an estimated 18%.
- Concurrently, escalating regulatory pressures, such as extended producer responsibility (EPR) mandates for eco-friendly packaging, are adding new cost layers; compliance can increase packaging expenses by up to 25% in some European markets. The proliferation of AI-powered shopping agents, while offering hyper-personalized recommendations, also threatens to erode brand loyalty metrics by commoditizing products.
- This dynamic necessitates greater investment in supply chain transparency and unique value propositions to maintain customer allegiance. Finally, last-mile delivery optimization remains a persistent hurdle, with rising consumer expectations for speed and sustainability.
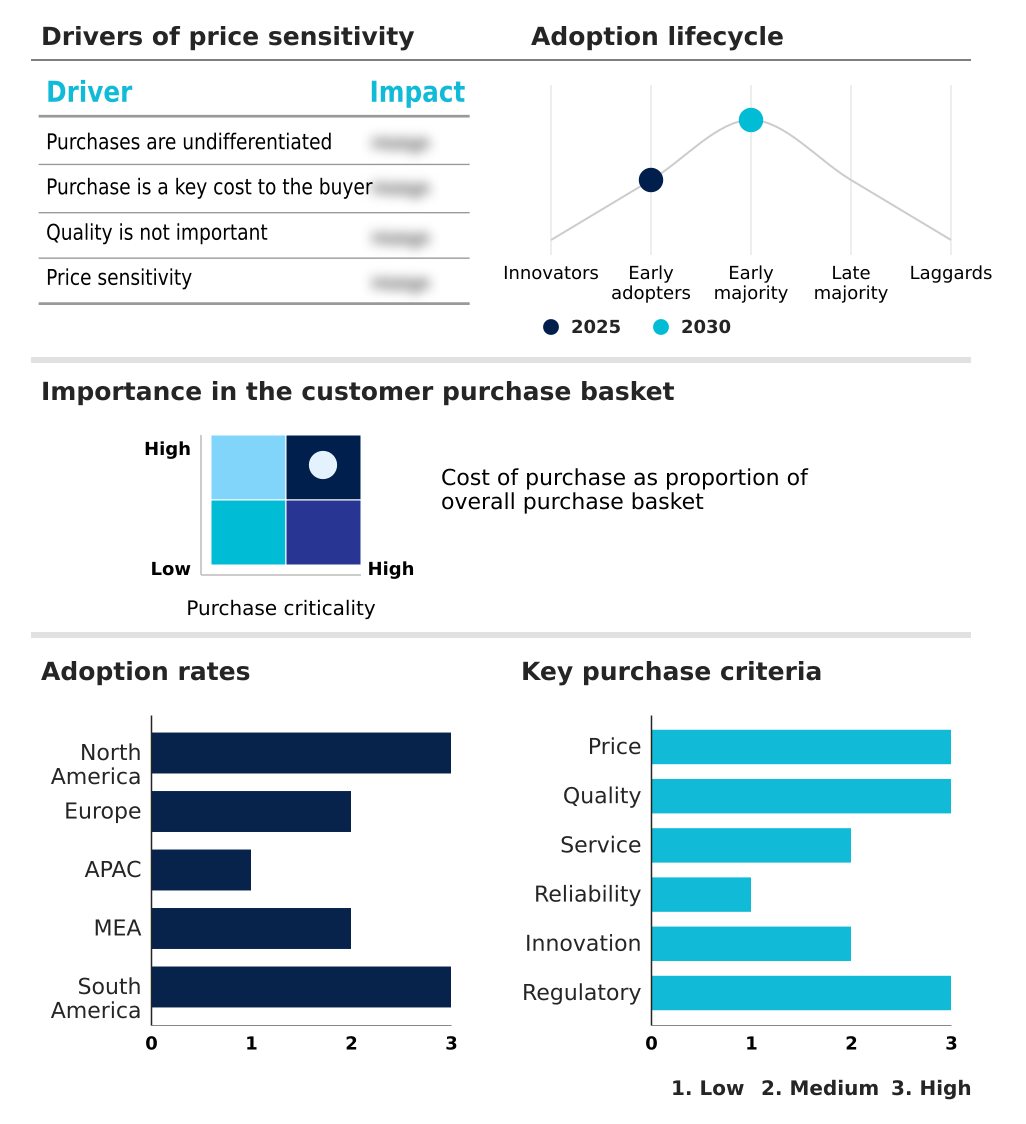
Exclusive Technavio Analysis on Customer Landscape
The gifts retailing market forecasting report includes the adoption lifecycle of the market, covering from the innovator’s stage to the laggard’s stage. It focuses on adoption rates in different regions based on penetration. Furthermore, the gifts retailing market report also includes key purchase criteria and drivers of price sensitivity to help companies evaluate and develop their market growth analysis strategies.
Customer Landscape of Gifts Retailing Industry
Competitive Landscape
Companies are implementing various strategies, such as strategic alliances, gifts retailing market forecast, partnerships, mergers and acquisitions, geographical expansion, and product/service launches, to enhance their presence in the industry.
Aldi Inc. - Analysis indicates a focus on SaaS-based platforms enabling personalized digital gifting, streamlining both consumer and corporate experiences through integrated, on-demand solutions.
The industry research and growth report includes detailed analyses of the competitive landscape of the market and information about key companies, including:
- Aldi Inc.
- Alibaba Group Holding Ltd.
- Amazon.com Inc.
- American Greetings Corp.
- Beyond Inc.
- Card Factory plc
- Enesco LLC
- Ferns N Petals Pvt. Ltd.
- GiftNow Pte Ltd.
- Hallmark Cards Inc.
- House of Fraser Ltd.
- Macys Inc.
- My Pet Gift Box
- Penney IP LLC
- Shutterfly Inc.
- Spencer Gifts LLC
- The Walt Disney Co.
- Walmart Inc.
- Williams Sonoma Inc.
Qualitative and quantitative analysis of companies has been conducted to help clients understand the wider business environment as well as the strengths and weaknesses of key industry players. Data is qualitatively analyzed to categorize companies as pure play, category-focused, industry-focused, and diversified; it is quantitatively analyzed to categorize companies as dominant, leading, strong, tentative, and weak.
Recent Development and News in Gifts retailing market
- In August, 2024, Amazon.com Inc. announced the full-scale deployment of its new AI-driven predictive gifting engine, which uses sentiment analysis to suggest products, aiming to enhance personalization and increase conversion rates for its Prime members.
- In October, 2024, Hallmark Cards Inc. launched a new line of greeting cards and gift packaging made from 100% post-consumer recycled materials and seed paper, responding to increased consumer demand for sustainable products.
- In January, 2025, GiftNow Pte Ltd. secured a major partnership with a leading enterprise software firm to integrate its digital corporate gifting platform into employee wellness and recognition programs, targeting Fortune 500 companies in North America and Europe.
- In April, 2025, Walmart Inc. acquired ‘CustomCreate’, a startup specializing in on-demand 3D printing technology for personalized home decor, signaling a strategic move to integrate micro-manufacturing capabilities into its retail ecosystem.
Dive into Technavio’s robust research methodology, blending expert interviews, extensive data synthesis, and validated models for unparalleled Gifts Retailing Market insights. See full methodology.
| Market Scope | |
|---|---|
| Page number | 301 |
| Base year | 2025 |
| Historic period | 2020-2024 |
| Forecast period | 2026-2030 |
| Growth momentum & CAGR | Accelerate at a CAGR of 4% |
| Market growth 2026-2030 | USD 20486.6 million |
| Market structure | Fragmented |
| YoY growth 2025-2026(%) | 3.8% |
| Key countries | US, Canada, Mexico, Germany, UK, France, Italy, Spain, The Netherlands, China, Japan, India, South Korea, Australia, Indonesia, UAE, Saudi Arabia, South Africa, Turkey, Egypt, Brazil, Argentina and Chile |
| Competitive landscape | Leading Companies, Market Positioning of Companies, Competitive Strategies, and Industry Risks |
Research Analyst Overview
- The gifts retailing market is navigating a profound transformation driven by technological integration and shifting consumer values. The adoption of on-demand 3D printing and localized micro-manufacturing is enabling unprecedented levels of product customization, moving the industry beyond mass production.
- This is complemented by the rise of phygital retail concepts, which blend the tactile benefits of physical stores with digital convenience, enhancing the emotional value proposition. A key trend is the growth of experiential gifting, where consumers prioritize memories over material items.
- In the corporate sector, corporate gifting solutions are evolving to include wellness-oriented gifting and subscription-based gifting as part of strategic employee recognition programs. Sustainability is a dominant theme, with a focus on sustainable gift products, eco-friendly packaging, and circular gifting models, often mandated by extended producer responsibility (EPR) regulations.
- Digital channels are being revolutionized by social commerce integration, livestream shopping platforms, and AI-powered shopping agents that provide hyper-personalized recommendations. For instance, firms using predictive analytics for inventory management have reported a 20% reduction in overstock situations. The market is also seeing a move toward a calm luxury aesthetic and smart giftware technology, further diversifying offerings.
What are the Key Data Covered in this Gifts Retailing Market Research and Growth Report?
-
What is the expected growth of the Gifts Retailing Market between 2026 and 2030?
-
USD 20.49 billion, at a CAGR of 4%
-
-
What segmentation does the market report cover?
-
The report is segmented by Distribution Channel (Offline, and Online), Product (Souvenirs and novelty items, Seasonal decorations, Giftware, Greeting cards, and Others), Type (Personal gifts, Festive gifts, Corporate gifts, and Others) and Geography (North America, Europe, APAC, Middle East and Africa, South America)
-
-
Which regions are analyzed in the report?
-
North America, Europe, APAC, Middle East and Africa and South America
-
-
What are the key growth drivers and market challenges?
-
Proliferation of experiential gifting paradigm and memory-based retail, Structural consumer bifurcation and volatility of discretionary spending
-
-
Who are the major players in the Gifts Retailing Market?
-
Aldi Inc., Alibaba Group Holding Ltd., Amazon.com Inc., American Greetings Corp., Beyond Inc., Card Factory plc, Enesco LLC, Ferns N Petals Pvt. Ltd., GiftNow Pte Ltd., Hallmark Cards Inc., House of Fraser Ltd., Macys Inc., My Pet Gift Box, Penney IP LLC, Shutterfly Inc., Spencer Gifts LLC, The Walt Disney Co., Walmart Inc. and Williams Sonoma Inc.
-
Market Research Insights
- The market is shaped by evolving consumer spending habits, with a clear pivot toward discretionary spending trends that favor meaningful purchases over mass-produced goods. This shift supports the growth of direct-to-consumer (DTC) models, which have demonstrated a 25% higher customer retention rate compared to traditional retail channels by leveraging superior data-driven personalization.
- Successful omnichannel retail strategy implementations are showing a 15% increase in lifetime customer value. B2B procurement processes for corporate gifting are also being redefined, focusing on ethical sourcing standards and robust employee recognition programs. Firms utilizing targeted influencer marketing campaigns and user-generated content are seeing engagement rates climb by over 40%, enhancing brand loyalty metrics without significant capital expenditure.
- The emphasis on a frictionless checkout process remains critical, as streamlined systems can reduce cart abandonment by nearly 30%, directly impacting revenue.
We can help! Our analysts can customize this gifts retailing market research report to meet your requirements.
 RIA -
RIA - 
