Integrated Building Management Systems Market Analysis, Size, and Forecast 2026-2030: Europe (Germany, UK, and France), North America (US, Canada, and Mexico), APAC (China, Japan, and India), South America (Brazil and Argentina), Middle East and Africa (Saudi Arabia, UAE, and South Africa), and Rest of World (ROW)

Integrated Building Management Systems Market Analysis, Size, and Forecast 2026-2030:
Europe (Germany, UK, and France), North America (US, Canada, and Mexico), APAC (China, Japan, and India), South America (Brazil and Argentina), Middle East and Africa (Saudi Arabia, UAE, and South Africa), and Rest of World (ROW)

Published: Apr 2026 336 Pages SKU: IRTNTR40961

Market Overview at a Glance

$21.14 B
Market Opportunity
14.6%
CAGR 2025 - 2030
35.8%
Europe Growth
$9.57 B
Hardware segment 2024

Integrated Building Management Systems Market Size 2026-2030

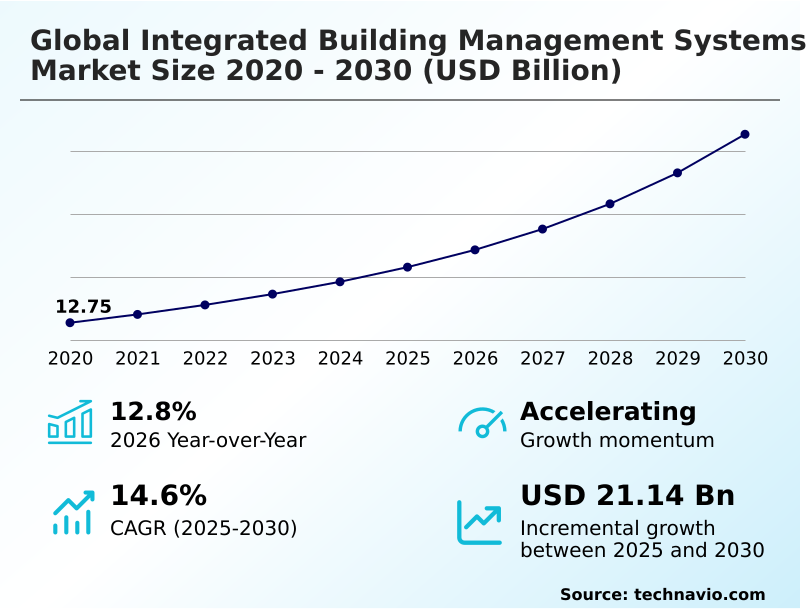
The integrated building management systems market size is valued to increase by USD 21.14 billion, at a CAGR of 14.6% from 2025 to 2030. Institutionalization of net zero mandates and energy decarbonization will drive the integrated building management systems market.

Major Market Trends & Insights

  • Europe dominated the market and accounted for a 35.8% growth during the forecast period.
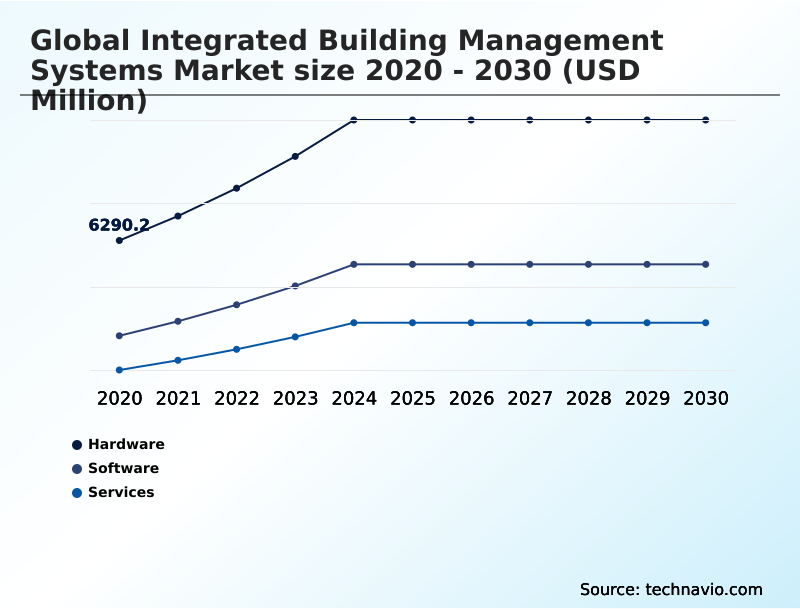
  • By Component - Hardware segment was valued at USD 9.57 billion in 2024
  • By End-user - Commercial segment accounted for the largest market revenue share in 2024

Market Size & Forecast

  • Market Opportunities: USD 29.98 billion
  • Market Future Opportunities: USD 21.14 billion
  • CAGR from 2025 to 2030 : 14.6%

Market Summary

  • The integrated building management systems market is defined by a transition toward comprehensive, autonomous facility orchestration. This evolution is driven by the need for enhanced energy efficiency and compliance with stringent global decarbonization mandates. Open-protocol architecture is becoming standard, unifying systems like HVAC, lighting, and security into a single digital ecosystem.
  • The industrialization of artificial intelligence and machine learning allows buildings to shift from reactive scheduling to predictive, demand-driven operations. For instance, a large commercial real estate portfolio can use IoT sensor integration and predictive analytics to autonomously optimize indoor air quality and energy consumption in real time, significantly reducing operational expenditures and the facility's carbon footprint.
  • This convergence of IT and OT elevates building management systems to strategic assets, providing facility managers with actionable insights through cloud-based dashboards and sovereign cloud solutions, ensuring buildings remain resilient and efficient.

What will be the Size of the Integrated Building Management Systems Market during the forecast period?

Get Key Insights on Market Forecast (PDF) Request Free Sample

How is the Integrated Building Management Systems Market Segmented?

The integrated building management systems industry research report provides comprehensive data (region-wise segment analysis), with forecasts and estimates in "USD million" for the period 2026-2030, as well as historical data from 2020-2024 for the following segments.

  • Component
    • Hardware
    • Software
    • Services
  • End-user
    • Commercial
    • Residential
    • Government
  • Application
    • Energy management
    • Lighting control
    • HVAC control
    • Others
  • Communication technology
    • BACnet
    • LONWorks
    • Modbus
    • Ethernet or IP
    • Others
  • Geography
    • Europe
      • Germany
      • UK
      • France
    • North America
      • US
      • Canada
      • Mexico
    • APAC
      • China
      • Japan
      • India
    • South America
      • Brazil
      • Argentina
    • Middle East and Africa
      • Saudi Arabia
      • UAE
      • South Africa
    • Rest of World (ROW)

By Component Insights

The hardware segment is estimated to witness significant growth during the forecast period.

The hardware segment serves as the foundational physical infrastructure, enabling the translation of digital commands into operational outcomes. This category includes a range of devices from sensors and controllers to gateways that form the building's sensory and nervous system.

Investment in this segment is driven by the need for enhanced asset value maintenance, with organizations achieving an average 15% reduction in equipment downtime through the use of predictive maintenance alerts.

The evolution toward decentralized intelligence and IT/OT convergence necessitates robust edge-processing hardware.

Modern remote monitoring tools and centralized control dashboards rely on this hardware to support advanced analytics, energy decarbonization, and broader corporate responsibility and environmental sustainability goals, all within a user-centric design that facilitates automated load-balancing through centralized management platforms and advanced metering infrastructure.

Request Free Sample

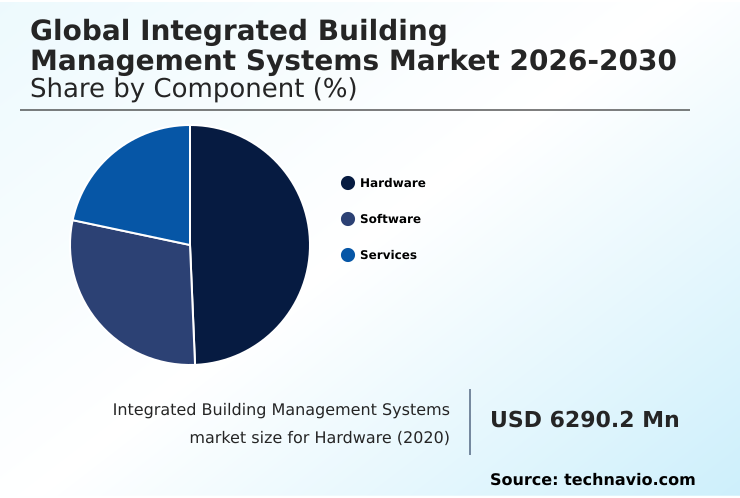
The Hardware segment was valued at USD 9.57 billion in 2024 and showed a gradual increase during the forecast period.

Request Free Sample

Regional Analysis

Europe is estimated to contribute 35.8% to the growth of the global market during the forecast period.Technavio’s analysts have elaborately explained the regional trends and drivers that shape the market during the forecast period.

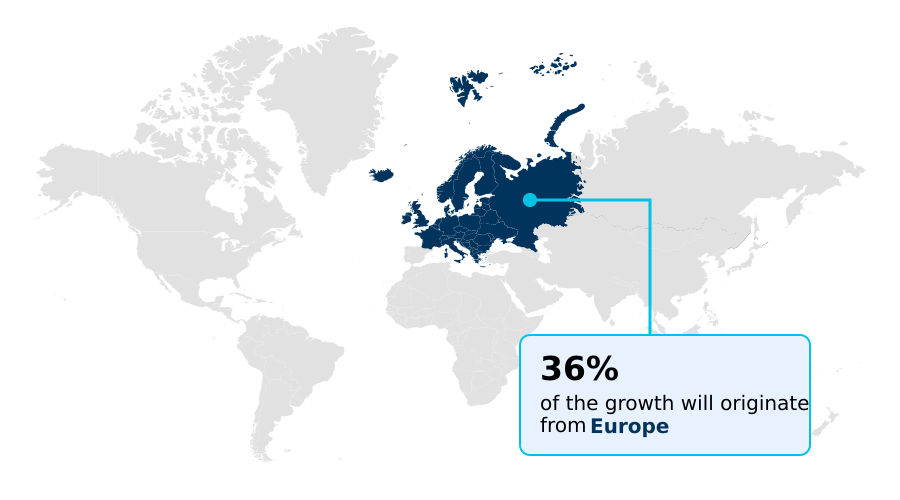
See How Integrated Building Management Systems Market Demand is Rising in Europe Request Free Sample

The geographic landscape is shaped by distinct regional drivers, with a focus on integrating advanced subsystems to meet modern demands.

In North America and Europe, regulatory compliance and data privacy mandates are accelerating the adoption of sophisticated access control systems and water management systems.

In these regions, achieving energy performance standards is critical, often requiring the use of building information modeling during the design phase. In APAC, rapid urbanization fuels demand for smart grid integration.

The implementation of variable refrigerant flow technology, coupled with fire safety integration, allows new high-rises to achieve operational efficiencies.

Across all regions, the integration with enterprise resource planning and industrial control systems is becoming standard, driven by a need for fault detection diagnostics to ensure reliability and continuous operation.

Market Dynamics

Our researchers analyzed the data with 2025 as the base year, along with the key drivers, trends, and challenges. A holistic analysis of drivers will help companies refine their marketing strategies to gain a competitive advantage.

  • Achieving strategic advantage in the current market requires a focus on specific, high-value outcomes. This includes integrating AI for predictive building maintenance to preemptively address equipment issues and implementing zero-trust security in building automation to counter rising cyber threats.
  • A key focus is achieving interoperability with legacy HVAC systems, a challenge that can be mitigated by using digital twins for energy consumption simulation. Forward-thinking organizations are adopting cloud-native platforms for multi-site facility management, which provide a unified view of operations. Utilizing BACnet integration for unified building controls simplifies management and reduces complexity.
  • Success also hinges on managing occupant comfort with sensor data and reducing operational costs with predictive analytics. Ensuring regulatory compliance with energy reporting is streamlined through automated software, while securing connected devices in smart buildings becomes a non-negotiable aspect of risk management.
  • Deploying agentic AI for autonomous building operations represents the next frontier, allowing for optimizing HVAC performance with machine learning. Firms are also enhancing workplace safety through integrated systems and managing hybrid work occupancy patterns. The ability to successfully retrofit older buildings with smart technology, guided by human-centric design for autonomous infrastructure, is a significant differentiator.
  • Ultimately, leveraging IoT for real-time data aggregation and aligning building performance with ESG goals via unified dashboards, while mitigating cybersecurity risks in smart buildings, is essential for long-term value creation. Companies that master these capabilities are seeing operational efficiencies improve at a rate twice that of their peers.

What are the key market drivers leading to the rise in the adoption of Integrated Building Management Systems Industry?

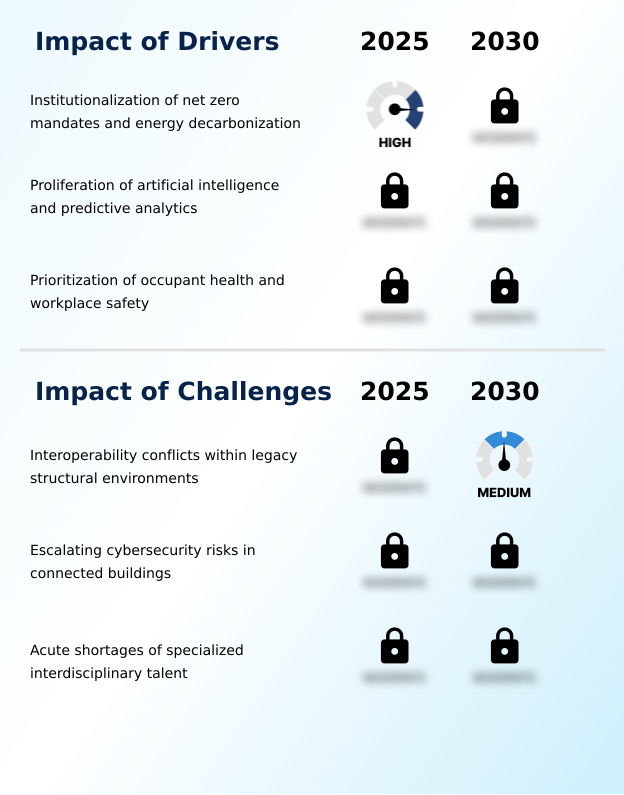
  • The institutionalization of net-zero mandates and a collective push for energy decarbonization are key drivers propelling the growth of the integrated building management systems market.

  • Market growth is significantly propelled by the strategic integration of advanced communication standards and digital technologies. The widespread adoption of the BACnet protocol and LONWorks communication, alongside the industrial-grade Modbus protocol, ensures system interoperability, even with legacy equipment.
  • This is foundational for sophisticated building automation and control systems. Innovations such as Power over Ethernet and digital twin technology are enabling more granular management, with firms reporting up to a 40% reduction in diagnostic times for cyber-physical systems.
  • The implementation of a zero-trust framework and robust demand-response strategies, facilitated by real-time data aggregation, is becoming critical for security and energy cost management, driving a clear return on investment.

What are the market trends shaping the Integrated Building Management Systems Industry?

  • The proliferation of agentic artificial intelligence architectures is a significant emerging trend. This signals a fundamental shift toward more autonomous and proactive building management systems.

  • Key trends are reshaping building operations, moving beyond simple automation to proactive autonomy. The market is seeing a convergence of agentic AI architectures, unified cloud-native platforms, and human-centric autonomous infrastructure, which collectively enhance occupant well-being and facility management.
  • These advancements in predictive analytics enable a data-driven management approach that optimizes indoor air quality and occupant comfort, leading to a 25% reduction in occupant complaints. This shift addresses long-standing interoperability conflicts while helping organizations meet net-zero emission mandates.
  • The focus is on reducing operational expenditures and creating environments that are both efficient and responsive to human needs, with some platforms demonstrating a 15% improvement in space utilization.

What challenges does the Integrated Building Management Systems Industry face during its growth?

  • Interoperability conflicts within legacy structural environments present a key challenge, often hindering the seamless integration and full realization of smart building capabilities.

  • Primary challenges revolve around technical complexity and the pace of technological change. Integrating new systems requires a focus on open-protocol architecture and effective IoT sensor integration to ensure seamless data flow and enable advanced machine learning models.
  • Organizations are adopting sustainable building practices and green software engineering to align with ESG goals, which adds another layer of complexity to asset lifecycle management. The successful deployment of smart building solutions, including those reliant on edge computing and sovereign cloud solutions, can increase energy efficiency optimization by over 20%.
  • However, achieving these gains requires overcoming the hurdle of creating connected building infrastructure that supports automated environmental adjustments without compromising security, a task that has extended project timelines by an average of 15% in complex retrofits.

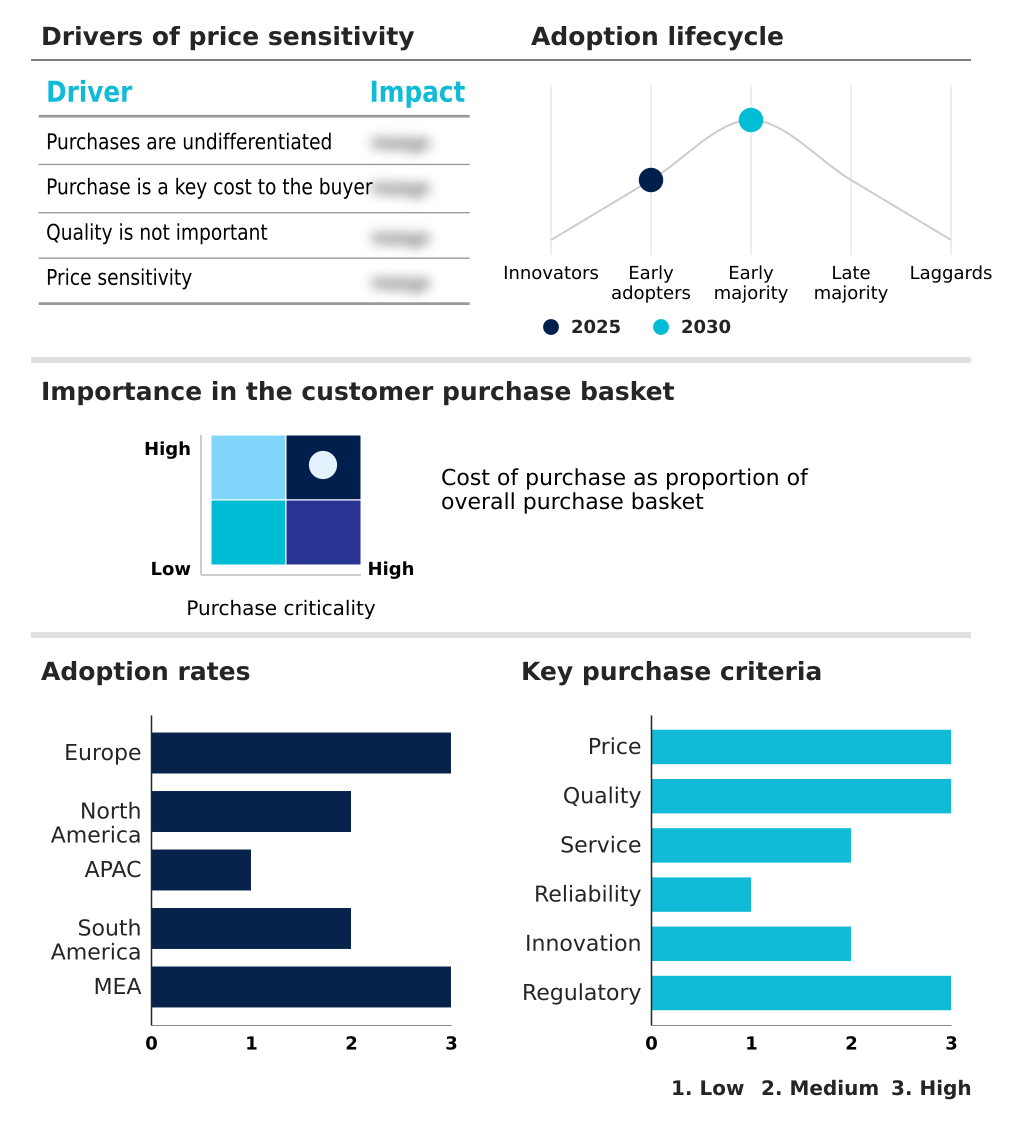
Exclusive Technavio Analysis on Customer Landscape

The integrated building management systems market forecasting report includes the adoption lifecycle of the market, covering from the innovator’s stage to the laggard’s stage. It focuses on adoption rates in different regions based on penetration. Furthermore, the integrated building management systems market report also includes key purchase criteria and drivers of price sensitivity to help companies evaluate and develop their market growth analysis strategies.

Customer Landscape of Integrated Building Management Systems Industry

Competitive Landscape

Companies are implementing various strategies, such as strategic alliances, integrated building management systems market forecast, partnerships, mergers and acquisitions, geographical expansion, and product/service launches, to enhance their presence in the industry.

ABB Ltd. - Expertise centers on delivering integrated building management platforms, including smart automation solutions and advanced control systems designed to enhance operational efficiency and asset performance.

The industry research and growth report includes detailed analyses of the competitive landscape of the market and information about key companies, including:

  • ABB Ltd.
  • Acuity Brands Inc.
  • Advantech Co. Ltd.
  • Azbil Corp.
  • Beckhoff Automation GmbH
  • Bosch Sicherheitssysteme GmbH
  • Carrier Global Corp.
  • Cisco Systems Inc.
  • Daikin Industries Ltd.
  • Emerson Electric Co.
  • Hitachi Ltd.
  • Honeywell International Inc.
  • IBM Corp.
  • Johnson Controls International
  • Legrand SA
  • Mitsubishi Electric Corp.
  • Panasonic Holdings Corp.
  • Siemens AG
  • Trane Technologies plc
  • Yokogawa Electric Corp.

Qualitative and quantitative analysis of companies has been conducted to help clients understand the wider business environment as well as the strengths and weaknesses of key industry players. Data is qualitatively analyzed to categorize companies as pure play, category-focused, industry-focused, and diversified; it is quantitatively analyzed to categorize companies as dominant, leading, strong, tentative, and weak.

Recent Development and News in Integrated building management systems market

  • In April, 2025, Siemens AG announced a strategic partnership to advance its vision for human-centric autonomous buildings, integrating industrial AI to create adaptive, high-performing spaces.
  • In January, 2025, Honeywell International Inc. launched a new strategic initiative focused on its Building Automation segment, aiming to accelerate innovation in smart sensors and edge devices.
  • In November, 2024, Schneider Electric SE unveiled its next-generation EcoStruxure platform, which integrates machine learning and predictive analytics to boost operational efficiency.
  • In September, 2024, Johnson Controls International PLC released a major update to its OpenBlue platform, introducing new agentic AI capabilities for automating operational decisions and improving system resilience.

Dive into Technavio’s robust research methodology, blending expert interviews, extensive data synthesis, and validated models for unparalleled Integrated Building Management Systems Market insights. See full methodology.

Market Scope
Page number 336
Base year 2025
Historic period 2020-2024
Forecast period 2026-2030
Growth momentum & CAGR Accelerate at a CAGR of 14.6%
Market growth 2026-2030 USD 21143.6 million
Market structure Fragmented
YoY growth 2025-2026(%) 12.8%
Key countries Germany, UK, France, Italy, Spain, The Netherlands, US, Canada, Mexico, China, Japan, India, South Korea, Australia, Indonesia, Brazil, Argentina, Chile, Saudi Arabia, UAE, South Africa, Turkey and Israel
Competitive landscape Leading Companies, Market Positioning of Companies, Competitive Strategies, and Industry Risks

Request Free Sample

Research Analyst Overview

  • The market is undergoing a fundamental transformation, driven by the convergence of energy decarbonization and advanced digital capabilities. The adoption of open-protocol architecture and semantic tagging is crucial for breaking down data silos. Decision-making is now influenced by the need to manage environmental sustainability and corporate responsibility, pushing firms toward green software engineering and sovereign cloud solutions.
  • Core technologies such as machine learning models, predictive analytics, and digital twin technology are being integrated into centralized control dashboards to provide predictive maintenance alerts and optimize systems like variable refrigerant flow. Protocols including the BACnet protocol, LONWorks communication, and Modbus protocol are essential for interoperability, while Power over Ethernet supports advanced lighting control that considers human circadian rhythms.
  • The focus on occupant well-being is driving innovations in access control systems, fire safety integration, and water management systems.
  • For boardroom consideration, the implementation of a zero-trust framework to secure industrial control systems and enterprise resource planning data is now a critical budgetary item, directly tied to maintaining asset value and operational continuity through demand-response strategies and IoT sensor integration via remote monitoring tools.

What are the Key Data Covered in this Integrated Building Management Systems Market Research and Growth Report?

  • What is the expected growth of the Integrated Building Management Systems Market between 2026 and 2030?

    • USD 21.14 billion, at a CAGR of 14.6%

  • What segmentation does the market report cover?

    • The report is segmented by Component (Hardware, Software, and Services), End-user (Commercial, Residential, and Government), Application (Energy management, Lighting control, HVAC control, and Others), Communication Technology (BACnet, LONWorks, Modbus, Ethernet or IP, and Others) and Geography (Europe, North America, APAC, South America, Middle East and Africa)

  • Which regions are analyzed in the report?

    • Europe, North America, APAC, South America and Middle East and Africa

  • What are the key growth drivers and market challenges?

    • Institutionalization of net zero mandates and energy decarbonization, Interoperability conflicts within legacy structural environments

  • Who are the major players in the Integrated Building Management Systems Market?

    • ABB Ltd., Acuity Brands Inc., Advantech Co. Ltd., Azbil Corp., Beckhoff Automation GmbH, Bosch Sicherheitssysteme GmbH, Carrier Global Corp., Cisco Systems Inc., Daikin Industries Ltd., Emerson Electric Co., Hitachi Ltd., Honeywell International Inc., IBM Corp., Johnson Controls International, Legrand SA, Mitsubishi Electric Corp., Panasonic Holdings Corp., Siemens AG, Trane Technologies plc and Yokogawa Electric Corp.

Market Research Insights

  • The market dynamics are increasingly shaped by a strategic move toward data-driven management and proactive autonomy, which significantly reduces operational expenditures. Adoption of smart building solutions enables a more than 20% improvement in energy efficiency optimization, directly impacting asset lifecycle management. The emphasis on occupant comfort and indoor air quality is paramount, with advanced control systems facilitating automated environmental adjustments.
  • For facility management, the integration of diverse systems delivers a unified view, improving response times by over 30% compared to siloed legacy equipment. This shift is not just about technology but about creating sustainable building practices through connected building infrastructure that supports real-time data aggregation and enhances system interoperability.

We can help! Our analysts can customize this integrated building management systems market research report to meet your requirements.

Get in touch

1. Executive Summary

1.1 Market overview

Executive Summary - Chart on Market Overview
Executive Summary - Data Table on Market Overview
Executive Summary - Chart on Global Market Characteristics
Executive Summary - Chart on Market by Geography
Executive Summary - Chart on Market Segmentation by Component
Executive Summary - Chart on Market Segmentation by End-user
Executive Summary - Chart on Market Segmentation by Application
Executive Summary - Chart on Market Segmentation by Communication Technology
Executive Summary - Chart on Incremental Growth
Executive Summary - Data Table on Incremental Growth
Executive Summary - Chart on Company Market Positioning

2. Technavio Analysis

2.1 Analysis of price sensitivity, lifecycle, customer purchase basket, adoption rates, and purchase criteria

2.2 Criticality of inputs and Factors of differentiation

Chart on Overview on criticality of inputs and factors of differentiation

2.3 Factors of disruption

Chart on Overview on factors of disruption

2.4 Impact of drivers and challenges

Chart on Impact of drivers and challenges in 2025 and 2030

3. Market Landscape

3.1 Market ecosystem

Chart on Parent Market
Data Table on - Parent Market

3.2 Market characteristics

Chart on Market characteristics analysis

3.3 Value chain analysis

Chart on Value chain analysis

4. Market Sizing

4.1 Market definition

Data Table on Offerings of companies included in the market definition

4.2 Market segment analysis

Market segments

4.3 Market size 2025

4.4 Market outlook: Forecast for 2025-2030

Chart on Global - Market size and forecast 2025-2030 ($ million)
Data Table on Global - Market size and forecast 2025-2030 ($ million)
Chart on Global Market: Year-over-year growth 2025-2030 (%)
Data Table on Global Market: Year-over-year growth 2025-2030 (%)

5. Historic Market Size

5.1 Global Integrated Building Management Systems Market 2020 - 2024

Historic Market Size - Data Table on Global Integrated Building Management Systems Market 2020 - 2024 ($ million)

5.2 Component segment analysis 2020 - 2024

Historic Market Size - Component Segment 2020 - 2024 ($ million)

5.3 End-user segment analysis 2020 - 2024

Historic Market Size - End-user Segment 2020 - 2024 ($ million)

5.4 Application segment analysis 2020 - 2024

Historic Market Size - Application Segment 2020 - 2024 ($ million)

5.5 Communication Technology segment analysis 2020 - 2024

Historic Market Size - Communication Technology Segment 2020 - 2024 ($ million)

5.6 Geography segment analysis 2020 - 2024

Historic Market Size - Geography Segment 2020 - 2024 ($ million)

5.7 Country segment analysis 2020 - 2024

Historic Market Size - Country Segment 2020 - 2024 ($ million)

6. Qualitative Analysis

6.1 Impact of AI in global integrated building management systems market

6.2 Impact of geopolitical conflict on global integrated building management systems market

7. Five Forces Analysis

7.1 Five forces summary

Five forces analysis - Comparison between 2025 and 2030

7.2 Bargaining power of buyers

Bargaining power of buyers - Impact of key factors 2025 and 2030

7.3 Bargaining power of suppliers

Bargaining power of suppliers - Impact of key factors in 2025 and 2030

7.4 Threat of new entrants

Threat of new entrants - Impact of key factors in 2025 and 2030

7.5 Threat of substitutes

Threat of substitutes - Impact of key factors in 2025 and 2030

7.6 Threat of rivalry

Threat of rivalry - Impact of key factors in 2025 and 2030

7.7 Market condition

Chart on Market condition - Five forces 2025 and 2030

8. Market Segmentation by Component

8.1 Market segments

Chart on Component - Market share 2025-2030 (%)
Data Table on Component - Market share 2025-2030 (%)

8.2 Comparison by Component

Chart on Comparison by Component
Data Table on Comparison by Component

8.3 Hardware - Market size and forecast 2025-2030

Chart on Hardware - Market size and forecast 2025-2030 ($ million)
Data Table on Hardware - Market size and forecast 2025-2030 ($ million)
Chart on Hardware - Year-over-year growth 2025-2030 (%)
Data Table on Hardware - Year-over-year growth 2025-2030 (%)

8.4 Software - Market size and forecast 2025-2030

Chart on Software - Market size and forecast 2025-2030 ($ million)
Data Table on Software - Market size and forecast 2025-2030 ($ million)
Chart on Software - Year-over-year growth 2025-2030 (%)
Data Table on Software - Year-over-year growth 2025-2030 (%)

8.5 Services - Market size and forecast 2025-2030

Chart on Services - Market size and forecast 2025-2030 ($ million)
Data Table on Services - Market size and forecast 2025-2030 ($ million)
Chart on Services - Year-over-year growth 2025-2030 (%)
Data Table on Services - Year-over-year growth 2025-2030 (%)

8.6 Market opportunity by Component

Market opportunity by Component ($ million)
Data Table on Market opportunity by Component ($ million)

9. Market Segmentation by End-user

9.1 Market segments

Chart on End-user - Market share 2025-2030 (%)
Data Table on End-user - Market share 2025-2030 (%)

9.2 Comparison by End-user

Chart on Comparison by End-user
Data Table on Comparison by End-user

9.3 Commercial - Market size and forecast 2025-2030

Chart on Commercial - Market size and forecast 2025-2030 ($ million)
Data Table on Commercial - Market size and forecast 2025-2030 ($ million)
Chart on Commercial - Year-over-year growth 2025-2030 (%)
Data Table on Commercial - Year-over-year growth 2025-2030 (%)

9.4 Residential - Market size and forecast 2025-2030

Chart on Residential - Market size and forecast 2025-2030 ($ million)
Data Table on Residential - Market size and forecast 2025-2030 ($ million)
Chart on Residential - Year-over-year growth 2025-2030 (%)
Data Table on Residential - Year-over-year growth 2025-2030 (%)

9.5 Government - Market size and forecast 2025-2030

Chart on Government - Market size and forecast 2025-2030 ($ million)
Data Table on Government - Market size and forecast 2025-2030 ($ million)
Chart on Government - Year-over-year growth 2025-2030 (%)
Data Table on Government - Year-over-year growth 2025-2030 (%)

9.6 Market opportunity by End-user

Market opportunity by End-user ($ million)
Data Table on Market opportunity by End-user ($ million)

10. Market Segmentation by Application

10.1 Market segments

Chart on Application - Market share 2025-2030 (%)
Data Table on Application - Market share 2025-2030 (%)

10.2 Comparison by Application

Chart on Comparison by Application
Data Table on Comparison by Application

10.3 Energy management - Market size and forecast 2025-2030

Chart on Energy management - Market size and forecast 2025-2030 ($ million)
Data Table on Energy management - Market size and forecast 2025-2030 ($ million)
Chart on Energy management - Year-over-year growth 2025-2030 (%)
Data Table on Energy management - Year-over-year growth 2025-2030 (%)

10.4 Lighting control - Market size and forecast 2025-2030

Chart on Lighting control - Market size and forecast 2025-2030 ($ million)
Data Table on Lighting control - Market size and forecast 2025-2030 ($ million)
Chart on Lighting control - Year-over-year growth 2025-2030 (%)
Data Table on Lighting control - Year-over-year growth 2025-2030 (%)

10.5 HVAC control - Market size and forecast 2025-2030

Chart on HVAC control - Market size and forecast 2025-2030 ($ million)
Data Table on HVAC control - Market size and forecast 2025-2030 ($ million)
Chart on HVAC control - Year-over-year growth 2025-2030 (%)
Data Table on HVAC control - Year-over-year growth 2025-2030 (%)

10.6 Others - Market size and forecast 2025-2030

Chart on Others - Market size and forecast 2025-2030 ($ million)
Data Table on Others - Market size and forecast 2025-2030 ($ million)
Chart on Others - Year-over-year growth 2025-2030 (%)
Data Table on Others - Year-over-year growth 2025-2030 (%)

10.7 Market opportunity by Application

Market opportunity by Application ($ million)
Data Table on Market opportunity by Application ($ million)

11. Market Segmentation by Communication Technology

11.1 Market segments

Chart on Communication Technology - Market share 2025-2030 (%)
Data Table on Communication Technology - Market share 2025-2030 (%)

11.2 Comparison by Communication Technology

Chart on Comparison by Communication Technology
Data Table on Comparison by Communication Technology

11.3 BACnet - Market size and forecast 2025-2030

Chart on BACnet - Market size and forecast 2025-2030 ($ million)
Data Table on BACnet - Market size and forecast 2025-2030 ($ million)
Chart on BACnet - Year-over-year growth 2025-2030 (%)
Data Table on BACnet - Year-over-year growth 2025-2030 (%)

11.4 LONWorks - Market size and forecast 2025-2030

Chart on LONWorks - Market size and forecast 2025-2030 ($ million)
Data Table on LONWorks - Market size and forecast 2025-2030 ($ million)
Chart on LONWorks - Year-over-year growth 2025-2030 (%)
Data Table on LONWorks - Year-over-year growth 2025-2030 (%)

11.5 Modbus - Market size and forecast 2025-2030

Chart on Modbus - Market size and forecast 2025-2030 ($ million)
Data Table on Modbus - Market size and forecast 2025-2030 ($ million)
Chart on Modbus - Year-over-year growth 2025-2030 (%)
Data Table on Modbus - Year-over-year growth 2025-2030 (%)

11.6 Ethernet or IP - Market size and forecast 2025-2030

Chart on Ethernet or IP - Market size and forecast 2025-2030 ($ million)
Data Table on Ethernet or IP - Market size and forecast 2025-2030 ($ million)
Chart on Ethernet or IP - Year-over-year growth 2025-2030 (%)
Data Table on Ethernet or IP - Year-over-year growth 2025-2030 (%)

11.7 Others - Market size and forecast 2025-2030

Chart on Others - Market size and forecast 2025-2030 ($ million)
Data Table on Others - Market size and forecast 2025-2030 ($ million)
Chart on Others - Year-over-year growth 2025-2030 (%)
Data Table on Others - Year-over-year growth 2025-2030 (%)

11.8 Market opportunity by Communication Technology

Market opportunity by Communication Technology ($ million)
Data Table on Market opportunity by Communication Technology ($ million)

12. Customer Landscape

12.1 Customer landscape overview

Analysis of price sensitivity, lifecycle, customer purchase basket, adoption rates, and purchase criteria

13. Geographic Landscape

13.1 Geographic segmentation

Chart on Market share by geography 2025-2030 (%)
Data Table on Market share by geography 2025-2030 (%)

13.2 Geographic comparison

Chart on Geographic comparison
Data Table on Geographic comparison

13.3 Europe - Market size and forecast 2025-2030

Chart on Europe - Market size and forecast 2025-2030 ($ million)
Data Table on Europe - Market size and forecast 2025-2030 ($ million)
Chart on Europe - Year-over-year growth 2025-2030 (%)
Data Table on Europe - Year-over-year growth 2025-2030 (%)
Chart on Regional Comparison - Europe
Data Table on Regional Comparison - Europe

13.3.1 Germany - Market size and forecast 2025-2030

Chart on Germany - Market size and forecast 2025-2030 ($ million)
Data Table on Germany - Market size and forecast 2025-2030 ($ million)
Chart on Germany - Year-over-year growth 2025-2030 (%)
Data Table on Germany - Year-over-year growth 2025-2030 (%)

13.3.2 UK - Market size and forecast 2025-2030

Chart on UK - Market size and forecast 2025-2030 ($ million)
Data Table on UK - Market size and forecast 2025-2030 ($ million)
Chart on UK - Year-over-year growth 2025-2030 (%)
Data Table on UK - Year-over-year growth 2025-2030 (%)

13.3.3 France - Market size and forecast 2025-2030

Chart on France - Market size and forecast 2025-2030 ($ million)
Data Table on France - Market size and forecast 2025-2030 ($ million)
Chart on France - Year-over-year growth 2025-2030 (%)
Data Table on France - Year-over-year growth 2025-2030 (%)

13.3.4 Italy - Market size and forecast 2025-2030

Chart on Italy - Market size and forecast 2025-2030 ($ million)
Data Table on Italy - Market size and forecast 2025-2030 ($ million)
Chart on Italy - Year-over-year growth 2025-2030 (%)
Data Table on Italy - Year-over-year growth 2025-2030 (%)

13.3.5 Spain - Market size and forecast 2025-2030

Chart on Spain - Market size and forecast 2025-2030 ($ million)
Data Table on Spain - Market size and forecast 2025-2030 ($ million)
Chart on Spain - Year-over-year growth 2025-2030 (%)
Data Table on Spain - Year-over-year growth 2025-2030 (%)

13.3.6 The Netherlands - Market size and forecast 2025-2030

Chart on The Netherlands - Market size and forecast 2025-2030 ($ million)
Data Table on The Netherlands - Market size and forecast 2025-2030 ($ million)
Chart on The Netherlands - Year-over-year growth 2025-2030 (%)
Data Table on The Netherlands - Year-over-year growth 2025-2030 (%)

13.4 North America - Market size and forecast 2025-2030

Chart on North America - Market size and forecast 2025-2030 ($ million)
Data Table on North America - Market size and forecast 2025-2030 ($ million)
Chart on North America - Year-over-year growth 2025-2030 (%)
Data Table on North America - Year-over-year growth 2025-2030 (%)
Chart on Regional Comparison - North America
Data Table on Regional Comparison - North America

13.4.1 US - Market size and forecast 2025-2030

Chart on US - Market size and forecast 2025-2030 ($ million)
Data Table on US - Market size and forecast 2025-2030 ($ million)
Chart on US - Year-over-year growth 2025-2030 (%)
Data Table on US - Year-over-year growth 2025-2030 (%)

13.4.2 Canada - Market size and forecast 2025-2030

Chart on Canada - Market size and forecast 2025-2030 ($ million)
Data Table on Canada - Market size and forecast 2025-2030 ($ million)
Chart on Canada - Year-over-year growth 2025-2030 (%)
Data Table on Canada - Year-over-year growth 2025-2030 (%)

13.4.3 Mexico - Market size and forecast 2025-2030

Chart on Mexico - Market size and forecast 2025-2030 ($ million)
Data Table on Mexico - Market size and forecast 2025-2030 ($ million)
Chart on Mexico - Year-over-year growth 2025-2030 (%)
Data Table on Mexico - Year-over-year growth 2025-2030 (%)

13.5 APAC - Market size and forecast 2025-2030

Chart on APAC - Market size and forecast 2025-2030 ($ million)
Data Table on APAC - Market size and forecast 2025-2030 ($ million)
Chart on APAC - Year-over-year growth 2025-2030 (%)
Data Table on APAC - Year-over-year growth 2025-2030 (%)
Chart on Regional Comparison - APAC
Data Table on Regional Comparison - APAC

13.5.1 China - Market size and forecast 2025-2030

Chart on China - Market size and forecast 2025-2030 ($ million)
Data Table on China - Market size and forecast 2025-2030 ($ million)
Chart on China - Year-over-year growth 2025-2030 (%)
Data Table on China - Year-over-year growth 2025-2030 (%)

13.5.2 Japan - Market size and forecast 2025-2030

Chart on Japan - Market size and forecast 2025-2030 ($ million)
Data Table on Japan - Market size and forecast 2025-2030 ($ million)
Chart on Japan - Year-over-year growth 2025-2030 (%)
Data Table on Japan - Year-over-year growth 2025-2030 (%)

13.5.3 India - Market size and forecast 2025-2030

Chart on India - Market size and forecast 2025-2030 ($ million)
Data Table on India - Market size and forecast 2025-2030 ($ million)
Chart on India - Year-over-year growth 2025-2030 (%)
Data Table on India - Year-over-year growth 2025-2030 (%)

13.5.4 South Korea - Market size and forecast 2025-2030

Chart on South Korea - Market size and forecast 2025-2030 ($ million)
Data Table on South Korea - Market size and forecast 2025-2030 ($ million)
Chart on South Korea - Year-over-year growth 2025-2030 (%)
Data Table on South Korea - Year-over-year growth 2025-2030 (%)

13.5.5 Australia - Market size and forecast 2025-2030

Chart on Australia - Market size and forecast 2025-2030 ($ million)
Data Table on Australia - Market size and forecast 2025-2030 ($ million)
Chart on Australia - Year-over-year growth 2025-2030 (%)
Data Table on Australia - Year-over-year growth 2025-2030 (%)

13.5.6 Indonesia - Market size and forecast 2025-2030

Chart on Indonesia - Market size and forecast 2025-2030 ($ million)
Data Table on Indonesia - Market size and forecast 2025-2030 ($ million)
Chart on Indonesia - Year-over-year growth 2025-2030 (%)
Data Table on Indonesia - Year-over-year growth 2025-2030 (%)

13.6 South America - Market size and forecast 2025-2030

Chart on South America - Market size and forecast 2025-2030 ($ million)
Data Table on South America - Market size and forecast 2025-2030 ($ million)
Chart on South America - Year-over-year growth 2025-2030 (%)
Data Table on South America - Year-over-year growth 2025-2030 (%)
Chart on Regional Comparison - South America
Data Table on Regional Comparison - South America

13.6.1 Brazil - Market size and forecast 2025-2030

Chart on Brazil - Market size and forecast 2025-2030 ($ million)
Data Table on Brazil - Market size and forecast 2025-2030 ($ million)
Chart on Brazil - Year-over-year growth 2025-2030 (%)
Data Table on Brazil - Year-over-year growth 2025-2030 (%)

13.6.2 Argentina - Market size and forecast 2025-2030

Chart on Argentina - Market size and forecast 2025-2030 ($ million)
Data Table on Argentina - Market size and forecast 2025-2030 ($ million)
Chart on Argentina - Year-over-year growth 2025-2030 (%)
Data Table on Argentina - Year-over-year growth 2025-2030 (%)

13.6.3 Chile - Market size and forecast 2025-2030

Chart on Chile - Market size and forecast 2025-2030 ($ million)
Data Table on Chile - Market size and forecast 2025-2030 ($ million)
Chart on Chile - Year-over-year growth 2025-2030 (%)
Data Table on Chile - Year-over-year growth 2025-2030 (%)

13.7 Middle East and Africa - Market size and forecast 2025-2030

Chart on Middle East and Africa - Market size and forecast 2025-2030 ($ million)
Data Table on Middle East and Africa - Market size and forecast 2025-2030 ($ million)
Chart on Middle East and Africa - Year-over-year growth 2025-2030 (%)
Data Table on Middle East and Africa - Year-over-year growth 2025-2030 (%)
Chart on Regional Comparison - Middle East and Africa
Data Table on Regional Comparison - Middle East and Africa

13.7.1 Saudi Arabia - Market size and forecast 2025-2030

Chart on Saudi Arabia - Market size and forecast 2025-2030 ($ million)
Data Table on Saudi Arabia - Market size and forecast 2025-2030 ($ million)
Chart on Saudi Arabia - Year-over-year growth 2025-2030 (%)
Data Table on Saudi Arabia - Year-over-year growth 2025-2030 (%)

13.7.2 UAE - Market size and forecast 2025-2030

Chart on UAE - Market size and forecast 2025-2030 ($ million)
Data Table on UAE - Market size and forecast 2025-2030 ($ million)
Chart on UAE - Year-over-year growth 2025-2030 (%)
Data Table on UAE - Year-over-year growth 2025-2030 (%)

13.7.3 South Africa - Market size and forecast 2025-2030

Chart on South Africa - Market size and forecast 2025-2030 ($ million)
Data Table on South Africa - Market size and forecast 2025-2030 ($ million)
Chart on South Africa - Year-over-year growth 2025-2030 (%)
Data Table on South Africa - Year-over-year growth 2025-2030 (%)

13.7.4 Turkey - Market size and forecast 2025-2030

Chart on Turkey - Market size and forecast 2025-2030 ($ million)
Data Table on Turkey - Market size and forecast 2025-2030 ($ million)
Chart on Turkey - Year-over-year growth 2025-2030 (%)
Data Table on Turkey - Year-over-year growth 2025-2030 (%)

13.7.5 Israel - Market size and forecast 2025-2030

Chart on Israel - Market size and forecast 2025-2030 ($ million)
Data Table on Israel - Market size and forecast 2025-2030 ($ million)
Chart on Israel - Year-over-year growth 2025-2030 (%)
Data Table on Israel - Year-over-year growth 2025-2030 (%)

13.8 Market opportunity by geography

Market opportunity by geography ($ million)
Data Tables on Market opportunity by geography ($ million)

14. Drivers, Challenges, and Opportunity

14.1 Market drivers

Institutionalization of net zero mandates and energy decarbonization
Proliferation of artificial intelligence and predictive analytics
Prioritization of occupant health and workplace safety

14.2 Market challenges

Interoperability conflicts within legacy structural environments
Escalating cybersecurity risks in connected buildings
Acute shortages of specialized interdisciplinary talent

14.3 Impact of drivers and challenges

Impact of drivers and challenges in 2025 and 2030

14.4 Market opportunities

Proliferation of agentic artificial intelligence architectures
Advancements in unified cloud-native convergence platforms
Evolution toward human-centric autonomous infrastructure

15. Competitive Landscape

15.1 Overview

15.2

Overview on criticality of inputs and factors of differentiation

15.3 Landscape disruption

Overview on factors of disruption

15.4 Industry risks

Impact of key risks on business

16. Competitive Analysis

16.1 Companies profiled

Companies covered

16.2 Company ranking index

16.3 Market positioning of companies

Matrix on companies position and classification

16.4 ABB Ltd.

ABB Ltd. - Overview
ABB Ltd. - Business segments
ABB Ltd. - Key news
ABB Ltd. - Key offerings
ABB Ltd. - Segment focus
SWOT

16.5 Acuity Brands Inc.

Acuity Brands Inc. - Overview
Acuity Brands Inc. - Business segments
Acuity Brands Inc. - Key offerings
Acuity Brands Inc. - Segment focus
SWOT

16.6 Azbil Corp.

Azbil Corp. - Overview
Azbil Corp. - Business segments
Azbil Corp. - Key offerings
Azbil Corp. - Segment focus
SWOT

16.7 Carrier Global Corp.

Carrier Global Corp. - Overview
Carrier Global Corp. - Business segments
Carrier Global Corp. - Key news
Carrier Global Corp. - Key offerings
Carrier Global Corp. - Segment focus
SWOT

16.8 Cisco Systems Inc.

Cisco Systems Inc. - Overview
Cisco Systems Inc. - Business segments
Cisco Systems Inc. - Key news
Cisco Systems Inc. - Key offerings
Cisco Systems Inc. - Segment focus
SWOT

16.9 Daikin Industries Ltd.

Daikin Industries Ltd. - Overview
Daikin Industries Ltd. - Business segments
Daikin Industries Ltd. - Key offerings
Daikin Industries Ltd. - Segment focus
SWOT

16.10 Emerson Electric Co.

Emerson Electric Co. - Overview
Emerson Electric Co. - Business segments
Emerson Electric Co. - Key news
Emerson Electric Co. - Key offerings
Emerson Electric Co. - Segment focus
SWOT

16.11 Honeywell International Inc.

Honeywell International Inc. - Overview
Honeywell International Inc. - Business segments
Honeywell International Inc. - Key news
Honeywell International Inc. - Key offerings
Honeywell International Inc. - Segment focus
SWOT

16.12 IBM Corp.

IBM Corp. - Overview
IBM Corp. - Business segments
IBM Corp. - Key news
IBM Corp. - Key offerings
IBM Corp. - Segment focus
SWOT

16.13 Johnson Controls International

Johnson Controls International - Overview
Johnson Controls International - Business segments
Johnson Controls International - Key news
Johnson Controls International - Key offerings
Johnson Controls International - Segment focus
SWOT

16.14 Legrand SA

Legrand SA - Overview
Legrand SA - Business segments
Legrand SA - Key news
Legrand SA - Key offerings
Legrand SA - Segment focus
SWOT

16.15 Mitsubishi Electric Corp.

Mitsubishi Electric Corp. - Overview
Mitsubishi Electric Corp. - Business segments
Mitsubishi Electric Corp. - Key offerings
Mitsubishi Electric Corp. - Segment focus
SWOT

16.16 Panasonic Holdings Corp.

Panasonic Holdings Corp. - Overview
Panasonic Holdings Corp. - Business segments
Panasonic Holdings Corp. - Key news
Panasonic Holdings Corp. - Key offerings
Panasonic Holdings Corp. - Segment focus
SWOT

16.17 Siemens AG

Siemens AG - Overview
Siemens AG - Business segments
Siemens AG - Key news
Siemens AG - Key offerings
Siemens AG - Segment focus
SWOT

16.18 Trane Technologies plc

Trane Technologies plc - Overview
Trane Technologies plc - Business segments
Trane Technologies plc - Key news
Trane Technologies plc - Key offerings
Trane Technologies plc - Segment focus
SWOT

17. Appendix

17.1 Scope of the report

Market definition
Objectives
Notes and caveats

17.2 Inclusions and exclusions checklist

Inclusions checklist
Exclusions checklist

17.3 Currency conversion rates for US$

17.4 Research methodology

17.5 Data procurement

Information sources

17.6 Data validation

17.7 Validation techniques employed for market sizing

17.8 Data synthesis

17.9 360 degree market analysis

17.10 List of abbreviations

Research Methodology

Technavio presents a detailed picture of the market by way of study, synthesis, and summation of data from multiple sources. The analysts have presented the various facets of the market with a particular focus on identifying the key industry influencers. The data thus presented is comprehensive, reliable, and the result of extensive research, both primary and secondary.

INFORMATION SOURCES

Primary sources

  • Manufacturers and suppliers
  • Channel partners
  • Industry experts
  • Strategic decision makers

Secondary sources

  • Industry journals and periodicals
  • Government data
  • Financial reports of key industry players
  • Historical data
  • Press releases

DATA ANALYSIS

Data Synthesis

  • Collation of data
  • Estimation of key figures
  • Analysis of derived insights

Data Validation

  • Triangulation with data models
  • Reference against proprietary databases
  • Corroboration with industry experts

REPORT WRITING

Qualitative

  • Market drivers
  • Market challenges
  • Market trends
  • Five forces analysis

Quantitative

  • Market size and forecast
  • Market segmentation
  • Geographical insights
  • Competitive landscape

Interested in this report?

Get your sample now to see our research methodology and insights!

Download Now

Frequently Asked Questions

Integrated Building Management Systems market growth will increase by USD 21143.6 million during 2026-2030.

The Integrated Building Management Systems market is expected to grow at a CAGR of 14.6% during 2026-2030.

Integrated Building Management Systems market is segmented by Component (Hardware, Software, Services) End-user (Commercial, Residential, Government) Application (Energy management, Lighting control, HVAC control, Others) Communication technology (BACnet, LONWorks, Modbus, Ethernet or IP, Others)

ABB Ltd., Acuity Brands Inc., Advantech Co. Ltd., Azbil Corp., Beckhoff Automation GmbH, Bosch Sicherheitssysteme GmbH, Carrier Global Corp., Cisco Systems Inc., Daikin Industries Ltd., Emerson Electric Co., Hitachi Ltd., Honeywell International Inc., IBM Corp., Johnson Controls International, Legrand SA, Mitsubishi Electric Corp., Panasonic Holdings Corp., Siemens AG, Trane Technologies plc, Yokogawa Electric Corp. are a few of the key vendors in the Integrated Building Management Systems market.

Europe will register the highest growth rate of 35.8% among the other regions. Therefore, the Integrated Building Management Systems market in Europe is expected to garner significant business opportunities for the vendors during the forecast period.

Germany, UK, France, Italy, Spain, The Netherlands, US, Canada, Mexico, China, Japan, India, South Korea, Australia, Indonesia, Brazil, Argentina, Chile, Saudi Arabia, UAE, South Africa, Turkey, Israel

  • Institutionalization of net zero mandates and energy decarbonization is the driving factor this market.

The Integrated Building Management Systems market vendors should focus on grabbing business opportunities from the Component segment as it accounted for the largest market share in the base year.
RIA - Research AI Assistant
Ask RIA