GNSS Devices Market Size 2025-2029
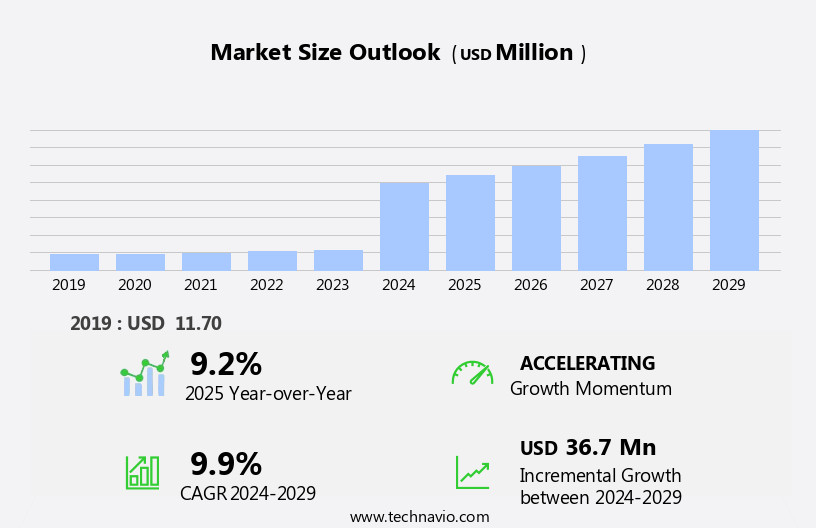
The GNSS devices market size is forecast to increase by USD 36.7 million, at a CAGR of 9.9% between 2024 and 2029.
- The market is experiencing significant growth due to various trends and factors. One major trend is the increasing adoption of GNSS technology in homeland security applications, such as tracking unmanned vehicles and enhancing situational awareness for emergency response teams. Furthermore, autonomous vehicles and precision farming techniques are driving the demand for more accurate and reliable navigation systems. Another trend is the integration of 5G technology and big data analytics, which will enable real-time processing and analysis of location data. Additionally, artificial intelligence and machine learning algorithms are being used to improve the accuracy and efficiency of GNSS systems. However, challenges such as cyber-attacks and the need for continuous satellite signal availability remain significant concerns for the market. Land and construction surveying is another major application area for GNSS technology, where high precision and accuracy are essential. The increasing use of GNSS in these industries is expected to drive market growth.
What will be the Size of the GNSS Devices Market During the Forecast Period?

Request Free Sample
- The market encompasses a diverse range of applications, including homeland security, defense, maritime navigation, space industry, and consumer electronic devices. This market is driven by the increasing demand for satellite services, such as constellations of satellites and satcom networks, which provide essential data for various industries. Significant investments in precision agriculture, autonomous vehicles, and unmanned vehicles are fueling the growth of the market. The integration of GNSS technology with big data and location-based services is enabling new applications and business models.
- However, the market faces challenges from cyber-attacks and the need for interoperability across frequency band signals. The market's size is substantial, with continued expansion expected due to the increasing adoption of GNSS technology in various sectors. The market's direction is towards the development of 5G-capable infrastructure and the integration of GNSS data with driverless technologies and BankMyCell. The initial cost of GNSS devices is decreasing, making them more accessible to a broader consumer base.
How is this GNSS Devices Industry segmented and which is the largest segment?
The GNSS devices industry research report provides comprehensive data (region-wise segment analysis), with forecasts and estimates in "USD million" for the period 2025-2029, as well as historical data from 2019-2023 for the following segments.
- End-user
- Consumer electronics
- Automotive and transportation
- Military and defense
- Others
- Product
- Smartphones
- Tablets and wearables
- In-vehicle systems
- Personal tracking devices
- Others
- Type
- Global constellations
- Regional constellations
- Satellite-based constellations
- Component
- Software
- Hardware
- Services
- Geography
- APAC
- China
- India
- Japan
- South Korea
- North America
- Europe
- Middle East and Africa
- South America
By End-user Insights
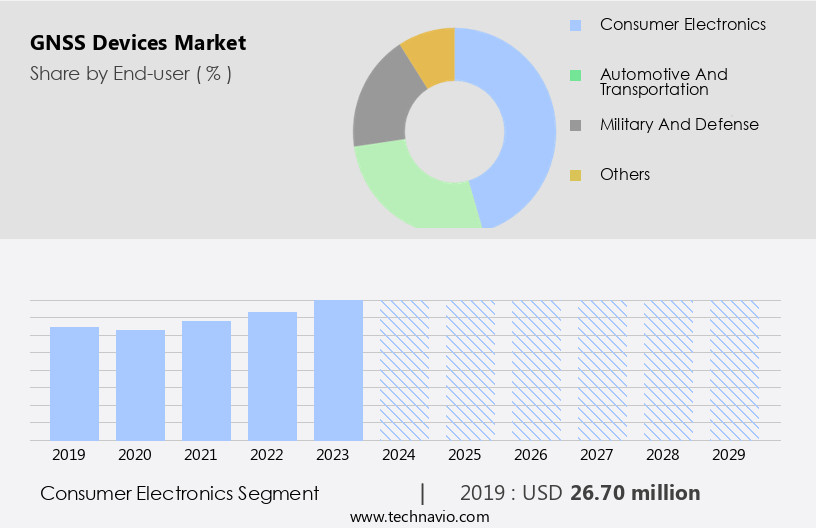
- The consumer electronics segment is estimated to witness significant growth during the forecast period. The market has witnessed substantial growth, catering to the varying needs of industries such as homeland security, defense, marine, space, and more. These devices utilize satellite navigation systems, including Satcom networks and satellite services, to provide real-time data and customized solutions. Investments in technologies like big data, artificial intelligence, and data analytics have fueled the market's expansion. GNSS devices are integral components of space-based navigation platforms, mega-constellations, and satcom services. Frequency allocation and spectrum management are crucial aspects of the market, ensuring dependable satellite navigation signals in the radio frequency spectrum.
- Potential challenges, such as intentional jamming, spoofing, and accidental interference, are being addressed through advanced technology and regulatory measures. The market offers various business models and revenue streams, providing real-time traffic updates, weather reports, places of interest, and location-based services. Applications span across maritime navigation, agriculture, cyber-attacks, and more. Technological advancements, including 5G technology and digital cameras, have further expanded the market's scope. Maintaining location accuracy, frequency band signals, and timing synchronization are essential for various industries, including rail, road, maritime, aviation, smart mobility, and infrastructure monitoring. GNSS devices are also critical for military missions, surveying, mapping, autonomous delivery, flood rescue events, natural calamities, weather forecasting, and tracking devices.

Get a glance at the market report of the share of various segments Request Free Sample
The consumer electronics segment was valued at USD 26.70 million in 2019 and showed a gradual increase during the forecast period.
Regional Analysis
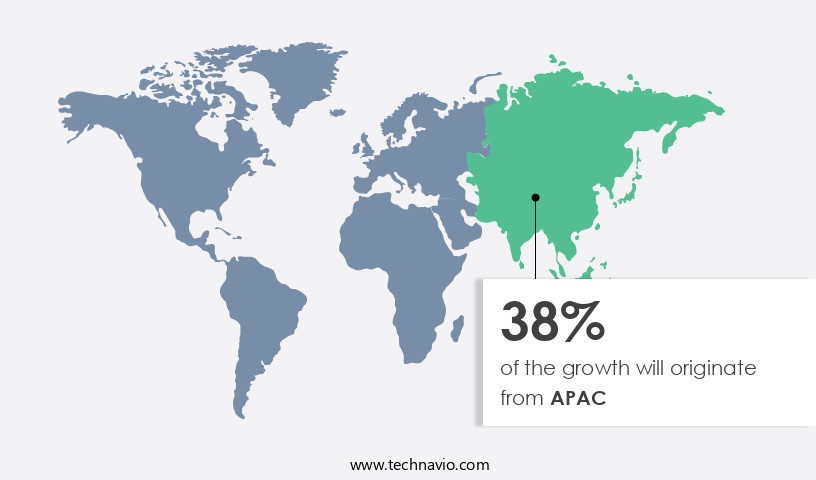
- APAC is estimated to contribute 38% to the growth of the global market during the forecast period. Technavio's analysts have elaborately explained the regional trends and drivers that shape the market during the forecast period. The market is experiencing significant growth, with APAC leading the way in 2024. Key contributors to this region's revenue include South Korea, Japan, and China. The increasing demand for location-based services and GPS-enabled devices is fueling market expansion. The automotive sector is a significant driver, as autonomous vehicles integrate more advanced GPS technology for superior navigation and safety features. Furthermore, the proliferation of connected devices, such as smartphones and wearable technology, is increasing the demand for GNSS chips. The market is projected to continue growing due to the rising demand for GPS technology across various sectors, including transportation, navigation, and mapping.

For more insights on the market size of various regions, Request Free Sample
Satellite navigation systems, such as GPS, Galileo, GLONASS, BeiDou, and others, are integral to this growth. Navigation satellite systems provide real-time traffic updates, weather reports, places of interest, and location accuracy. However, challenges such as technology degradation, latency, bandwidth, data processing, storage, and cyber-attacks pose threats to the market. To mitigate these challenges, customized solutions, business models, and revenue streams are being explored. The market also incorporates satellite constellations, frequency band allocation, spectrum management, and satellite navigation signals. Despite these challenges, the market's future looks promising, with advancements in 5G technology, mega-constellations, and satellite services.
Market Dynamics
Our researchers analyzed the data with 2024 as the base year, along with the key drivers, trends, and challenges. A holistic analysis of drivers will help companies refine their marketing strategies to gain a competitive advantage.
What are the key market drivers leading to the rise in the adoption of GNSS Devices Industry?
- Government initiatives and support in providing assistance in mobile devices is the key driver of the market. The market is experiencing significant growth due to increasing government support and regulatory mandates. For instance, the European Commission has enacted a rule requiring satellite and Wi-Fi location services in newly released smartphones. This rule mandates that these devices use chipsets compatible with the European Union's Galileo Satellite System, which provides precise positioning and timing data. Major GNSS chipset suppliers are responding by creating Galileo-ready chipsets, and leading smartphone manufacturers are incorporating them into their latest models. Additionally, advancements in technology such as mega-constellations, 5G technology, and the integration of artificial intelligence, big data, and data analytics into satellite services are driving market expansion.
- The market is also witnessing investments in space-based navigation platforms, satellite constellations, and ground stations, as well as the development of customized solutions tailored to various business models and revenue streams. The market is anticipated to grow during the forecast period due to the increasing demand for real-time traffic updates, weather reports, and location-based services across various industries, including maritime navigation, agriculture, military applications, and autonomous vehicles. However, challenges such as technology degradation, latency, bandwidth, data processing, storage, and cyber-attacks pose significant threats to market growth. Furthermore, frequency allocation and spectrum management remain critical issues, as satellite navigation signals are susceptible to intentional jamming, spoofing, and accidental interference.
What are the market trends shaping the GNSS Devices Industry?
- Increasing demand for precise navigation is the upcoming market trend. GNSS devices, also known as satellite navigation systems, are integral to various industries due to their capability to provide precise real-time location monitoring and mapping. These systems utilize a constellation of satellites to transmit navigation satellite signals, enabling accurate positioning data for users. The defense, homeland security, space industry, maritime, and transportation sectors are significant consumers of GNSS technology. Transportation and logistics companies leverage GNSS for optimizing routes and tracking vehicles, resulting in faster delivery times and reduced fuel consumption. In the defense sector, GNSS plays a crucial role in military missions, surveying, and mapping. The marine industry uses these systems for navigation, while the space industry relies on them for satellite services and satellite communications networks.
- Investments in GNSS technology are on the rise due to the growing demand for big data, artificial intelligence, and data analytics. The space-based navigation platform is evolving with mega-constellations and advanced satcom services. Frequency band allocation and spectrum management are essential considerations for GNSS technology, with potential challenges from intentional jamming, spoofing, and accidental interference. Customized solutions and business models cater to various industries, offering real-time traffic updates, weather reports, places of interest, and location-based services. The technology's dependability and high accuracy are vital for infrastructure, autonomous vehicles, and unmanned vehicles. Additionally, GNSS data is used in precision agriculture, consumer electronic devices, and various applications such as rail, timing synchronization, road, maritime, aviation, smart mobility, cadastral surveying, construction surveying, machine control applications, mine surveying, infrastructure monitoring, and more.
What challenges does the GNSS Devices Industry face during its growth?
- Indoor positioning navigating limitations is a key challenge affecting the industry growth. The market holds significant potential in various industries, including homeland security, defense, marine, and the space industry. However, the accuracy and dependability of satellite navigation systems can be compromised indoors due to the obstruction of satellite signals by buildings and structures. This challenge presents opportunities for advancements in GNSS devices, such as mega-constellations and satcom networks, to enhance satellite services and provide customized solutions. The integration of big data, artificial intelligence, and data analytics in a space-based navigation platform can improve location accuracy and real-time traffic updates, weather reports, and place-of-interest information. Frequency allocation and spectrum management are crucial in mitigating intentional jamming, spoofing, and accidental interference.
- The market's revenue streams include satellite navigation signals, radio frequency spectrum, and satellite constellations. The demand for GNSS devices extends to various industries, including maritime navigation, agriculture, cyber-attacks, autonomous vehicles, infrastructure, and location-based services. The technology's advancements in latency, bandwidth, data processing, storage, and cloud computing enable real-time applications in industries such as rail, timing synch, road, maritime, aviation, smart mobility, cadastral surveying, construction surveying, machine control applications, mine surveying, infrastructure monitoring, and more. The integration of 5G technology, electronic industry, military applications, and precision agriculture further expands the market's potential. Despite the initial cost and potential cyber-attacks, the market's growth is driven by the increasing demand for real-time data and automation in various industries.
Exclusive Customer Landscape
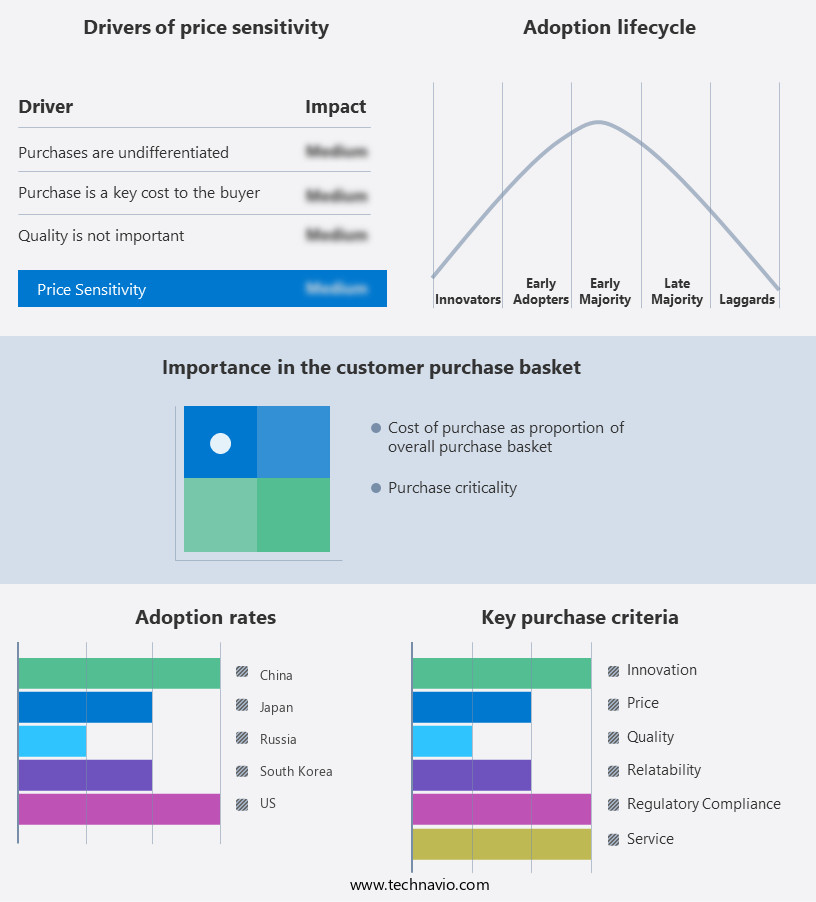
The GNSS devices market forecasting report includes the adoption lifecycle of the market, covering from the innovator's stage to the laggard's stage. It focuses on adoption rates in different regions based on penetration. Furthermore, the GNSS devices market report also includes key purchase criteria and drivers of price sensitivity to help companies evaluate and develop their market growth analysis strategies.

Customer Landscape
Key Companies & Market Insights
Companies are implementing various strategies, such as strategic alliances, GNSS devices market forecast, partnerships, mergers and acquisitions, geographical expansion, and product/service launches, to enhance their presence in the industry.
Broadcom Inc. - The company offers GNSS devices such as BCM47765, BCM47531, and BCM47755.
The industry research and growth report includes detailed analyses of the competitive landscape of the market and information about key companies, including:
- Beijing UniStrong Science and Technology Co. Ltd.
- ComNav Technology Ltd.
- Furuno Electric Co. Ltd.
- Garmin Ltd.
- Hexagon AB
- Intel Corp.
- L3Harris Technologies Inc.
- MediaTek Inc.
- NavtechGPS Inc.
- Osmose Utilities Services Inc.
- Qualcomm Inc.
- RTX Corp.
- SkyTraq Technology Inc.
- STMicroelectronics NV
- Texas Instruments Inc.
- The GEO Group Inc.
- Topcon Corp.
- Trimble Inc.
- u blox AG
Qualitative and quantitative analysis of companies has been conducted to help clients understand the wider business environment as well as the strengths and weaknesses of key industry players. Data is qualitatively analyzed to categorize companies as pure play, category-focused, industry-focused, and diversified; it is quantitatively analyzed to categorize companies as dominant, leading, strong, tentative, and weak.
Research Analyst Overview
The market encompasses a diverse range of technologies and applications, serving various industries and sectors. SNS, also known as Global Navigation Satellite Systems (GNSS), relies on a constellation of satellites to provide location information and navigation services. These systems have gained significant traction due to their dependability and accuracy, offering numerous benefits to various industries. The SNS market is driven by several factors, including the increasing demand for real-time traffic updates, weather reports, and location-based services. The maritime industry, for instance, utilizes SNS for navigation and tracking of ships, ensuring safety and efficiency. Similarly, the agriculture sector employs SNS for precision farming, optimizing crop yields and reducing operational costs.
Further, the space industry is another significant contributor to the SNS market, with satellite services and satcom networks relying on satellite navigation signals for frequency allocation and spectrum management. The increasing trend of mega-constellations and satellite constellations further fuels market growth, as these constellations offer improved latency, bandwidth, and data processing capabilities. Investments in SNS technologies have been on the rise, with companies exploring customized solutions to cater to various industries and applications. Business models and revenue streams are evolving, with the integration of big data, artificial intelligence, and data analytics offering new opportunities for value creation. Despite the numerous benefits, the SNS market faces challenges, such as technology degradation, intentional jamming, spoofing, and accidental interference.
Moreover, cyber-attacks pose a significant threat to the security and reliability of SNS data. The market dynamics of SNS are influenced by several factors, including frequency band signals, ground stations, and satellite navigation systems such as GPS, Galileo, GLONASS, and Beidou. The market is also shaped by regulatory frameworks, frequency allocation, and spectrum management policies. The SNS market is diverse and dynamic, with applications ranging from homeland security and defense to maritime navigation, surveying, and autonomous vehicles. The market is expected to continue growing, driven by advancements in technology, increasing demand for location-based services, and the integration of emerging technologies such as 5G and cybersecurity solutions.
Market Scope
|
Report Coverage
|
Details
|
Page number
|
233
|
Base year
|
2024
|
Historic period
|
2019-2023 |
Forecast period
|
2025-2029
|
Growth momentum & CAGR
|
Accelerate at a CAGR of 9.9%
|
Market growth 2025-2029
|
USD 36.7 million
|
Market structure
|
Fragmented
|
YoY growth 2024-2025(%)
|
9.2
|
Key countries
|
US, Russia, South Korea, Japan, China, India, Germany, Canada, Mexico, and France
|
Competitive landscape
|
Leading Companies, Market Positioning of Companies, Competitive Strategies, and Industry Risks
|
Request Free Sample
What are the Key Data Covered in this GNSS Devices Market Research and Growth Report?
- CAGR of the GNSS Devices industry during the forecast period
- Detailed information on factors that will drive the market growth and forecasting between 2025 and 2029
- Precise estimation of the size of the market and its contribution of the industry in focus to the parent market
- Accurate predictions about upcoming growth and trends and changes in consumer behaviour
- Growth of the market across APAC, North America, Europe, Middle East and Africa, and South America
- Thorough analysis of the market's competitive landscape and detailed information about companies
- Comprehensive analysis of factors that will challenge the gnss devices market growth of industry companies
We can help! Our analysts can customize this gnss devices market research report to meet your requirements.
Get in touch
1 Executive Summary
- 1.1 Market overview
- Executive Summary - Chart on Market Overview
- Executive Summary - Data Table on Market Overview
- Executive Summary - Chart on Global Market Characteristics
- Executive Summary - Chart on Market by Geography
- Executive Summary - Chart on Market Segmentation by End-user
- Executive Summary - Chart on Market Segmentation by Product
- Executive Summary - Chart on Market Segmentation by Type
- Executive Summary - Chart on Market Segmentation by Component
- Executive Summary - Chart on Incremental Growth
- Executive Summary - Data Table on Incremental Growth
- Executive Summary - Chart on Company Market Positioning
2 Technavio Analysis
- 2.1 Analysis of price sensitivity, lifecycle, customer purchase basket, adoption rates, and purchase criteria
- Analysis of price sensitivity, lifecycle, customer purchase basket, adoption rates, and purchase criteria
- 2.2 Criticality of inputs and Factors of differentiation
- Overview on criticality of inputs and factors of differentiation
- 2.3 Factors of disruption
- Overview on factors of disruption
- 2.4 Impact of drivers and challenges
- Impact of drivers and challenges in 2024 and 2029
3 Market Landscape
- 3.1 Market ecosystem
- Parent Market
- Data Table on - Parent Market
- 3.2 Market characteristics
- Market characteristics analysis
4 Market Sizing
- 4.1 Market definition
- Offerings of companies included in the market definition
- 4.2 Market segment analysis
- 4.4 Market outlook: Forecast for 2024-2029
- Chart on Global - Market size and forecast 2024-2029 ($ million)
- Data Table on Global - Market size and forecast 2024-2029 ($ million)
- Chart on Global Market: Year-over-year growth 2024-2029 (%)
- Data Table on Global Market: Year-over-year growth 2024-2029 (%)
5 Historic Market Size
- 5.1 Global GNSS Devices Market 2019 - 2023
- Historic Market Size - Data Table on Global GNSS Devices Market 2019 - 2023 ($ million)
- 5.2 End-user segment analysis 2019 - 2023
- Historic Market Size - End-user Segment 2019 - 2023 ($ million)
- 5.3 Product segment analysis 2019 - 2023
- Historic Market Size - Product Segment 2019 - 2023 ($ million)
- 5.4 Type segment analysis 2019 - 2023
- Historic Market Size - Type Segment 2019 - 2023 ($ million)
- 5.5 Component segment analysis 2019 - 2023
- Historic Market Size - Component Segment 2019 - 2023 ($ million)
- 5.6 Geography segment analysis 2019 - 2023
- Historic Market Size - Geography Segment 2019 - 2023 ($ million)
- 5.7 Country segment analysis 2019 - 2023
- Historic Market Size - Country Segment 2019 - 2023 ($ million)
6 Qualitative Analysis
- 6.1 AI Impact on Global GNSS Devices Market
7 Five Forces Analysis
- 7.1 Five forces summary
- Five forces analysis - Comparison between 2024 and 2029
- 7.2 Bargaining power of buyers
- Bargaining power of buyers - Impact of key factors 2024 and 2029
- 7.3 Bargaining power of suppliers
- Bargaining power of suppliers - Impact of key factors in 2024 and 2029
- 7.4 Threat of new entrants
- Threat of new entrants - Impact of key factors in 2024 and 2029
- 7.5 Threat of substitutes
- Threat of substitutes - Impact of key factors in 2024 and 2029
- 7.6 Threat of rivalry
- Threat of rivalry - Impact of key factors in 2024 and 2029
- 7.7 Market condition
- Chart on Market condition - Five forces 2024 and 2029
8 Market Segmentation by End-user
- 8.1 Market segments
- Chart on End-user - Market share 2024-2029 (%)
- Data Table on End-user - Market share 2024-2029 (%)
- 8.2 Comparison by End-user
- Chart on Comparison by End-user
- Data Table on Comparison by End-user
- 8.3 Consumer electronics - Market size and forecast 2024-2029
- Chart on Consumer electronics - Market size and forecast 2024-2029 ($ million)
- Data Table on Consumer electronics - Market size and forecast 2024-2029 ($ million)
- Chart on Consumer electronics - Year-over-year growth 2024-2029 (%)
- Data Table on Consumer electronics - Year-over-year growth 2024-2029 (%)
- 8.4 Automotive and transportation - Market size and forecast 2024-2029
- Chart on Automotive and transportation - Market size and forecast 2024-2029 ($ million)
- Data Table on Automotive and transportation - Market size and forecast 2024-2029 ($ million)
- Chart on Automotive and transportation - Year-over-year growth 2024-2029 (%)
- Data Table on Automotive and transportation - Year-over-year growth 2024-2029 (%)
- 8.5 Military and defense - Market size and forecast 2024-2029
- Chart on Military and defense - Market size and forecast 2024-2029 ($ million)
- Data Table on Military and defense - Market size and forecast 2024-2029 ($ million)
- Chart on Military and defense - Year-over-year growth 2024-2029 (%)
- Data Table on Military and defense - Year-over-year growth 2024-2029 (%)
- 8.6 Others - Market size and forecast 2024-2029
- Chart on Others - Market size and forecast 2024-2029 ($ million)
- Data Table on Others - Market size and forecast 2024-2029 ($ million)
- Chart on Others - Year-over-year growth 2024-2029 (%)
- Data Table on Others - Year-over-year growth 2024-2029 (%)
- 8.7 Market opportunity by End-user
- Market opportunity by End-user ($ million)
- Data Table on Market opportunity by End-user ($ million)
9 Market Segmentation by Product
- 9.1 Market segments
- Chart on Product - Market share 2024-2029 (%)
- Data Table on Product - Market share 2024-2029 (%)
- 9.2 Comparison by Product
- Chart on Comparison by Product
- Data Table on Comparison by Product
- 9.3 Smartphones - Market size and forecast 2024-2029
- Chart on Smartphones - Market size and forecast 2024-2029 ($ million)
- Data Table on Smartphones - Market size and forecast 2024-2029 ($ million)
- Chart on Smartphones - Year-over-year growth 2024-2029 (%)
- Data Table on Smartphones - Year-over-year growth 2024-2029 (%)
- 9.4 Tablets and wearables - Market size and forecast 2024-2029
- Chart on Tablets and wearables - Market size and forecast 2024-2029 ($ million)
- Data Table on Tablets and wearables - Market size and forecast 2024-2029 ($ million)
- Chart on Tablets and wearables - Year-over-year growth 2024-2029 (%)
- Data Table on Tablets and wearables - Year-over-year growth 2024-2029 (%)
- 9.5 In-vehicle systems - Market size and forecast 2024-2029
- Chart on In-vehicle systems - Market size and forecast 2024-2029 ($ million)
- Data Table on In-vehicle systems - Market size and forecast 2024-2029 ($ million)
- Chart on In-vehicle systems - Year-over-year growth 2024-2029 (%)
- Data Table on In-vehicle systems - Year-over-year growth 2024-2029 (%)
- 9.6 Personal tracking devices - Market size and forecast 2024-2029
- Chart on Personal tracking devices - Market size and forecast 2024-2029 ($ million)
- Data Table on Personal tracking devices - Market size and forecast 2024-2029 ($ million)
- Chart on Personal tracking devices - Year-over-year growth 2024-2029 (%)
- Data Table on Personal tracking devices - Year-over-year growth 2024-2029 (%)
- 9.7 Others - Market size and forecast 2024-2029
- Chart on Others - Market size and forecast 2024-2029 ($ million)
- Data Table on Others - Market size and forecast 2024-2029 ($ million)
- Chart on Others - Year-over-year growth 2024-2029 (%)
- Data Table on Others - Year-over-year growth 2024-2029 (%)
- 9.8 Market opportunity by Product
- Market opportunity by Product ($ million)
- Data Table on Market opportunity by Product ($ million)
10 Market Segmentation by Type
- 10.1 Market segments
- Chart on Type - Market share 2024-2029 (%)
- Data Table on Type - Market share 2024-2029 (%)
- 10.2 Comparison by Type
- Chart on Comparison by Type
- Data Table on Comparison by Type
- 10.3 Global constellations - Market size and forecast 2024-2029
- Chart on Global constellations - Market size and forecast 2024-2029 ($ million)
- Data Table on Global constellations - Market size and forecast 2024-2029 ($ million)
- Chart on Global constellations - Year-over-year growth 2024-2029 (%)
- Data Table on Global constellations - Year-over-year growth 2024-2029 (%)
- 10.4 Regional constellations - Market size and forecast 2024-2029
- Chart on Regional constellations - Market size and forecast 2024-2029 ($ million)
- Data Table on Regional constellations - Market size and forecast 2024-2029 ($ million)
- Chart on Regional constellations - Year-over-year growth 2024-2029 (%)
- Data Table on Regional constellations - Year-over-year growth 2024-2029 (%)
- 10.5 Satellite-based constellations - Market size and forecast 2024-2029
- Chart on Satellite-based constellations - Market size and forecast 2024-2029 ($ million)
- Data Table on Satellite-based constellations - Market size and forecast 2024-2029 ($ million)
- Chart on Satellite-based constellations - Year-over-year growth 2024-2029 (%)
- Data Table on Satellite-based constellations - Year-over-year growth 2024-2029 (%)
- 10.6 Market opportunity by Type
- Market opportunity by Type ($ million)
- Data Table on Market opportunity by Type ($ million)
11 Market Segmentation by Component
- 11.1 Market segments
- Chart on Component - Market share 2024-2029 (%)
- Data Table on Component - Market share 2024-2029 (%)
- 11.2 Comparison by Component
- Chart on Comparison by Component
- Data Table on Comparison by Component
- 11.3 Software - Market size and forecast 2024-2029
- Chart on Software - Market size and forecast 2024-2029 ($ million)
- Data Table on Software - Market size and forecast 2024-2029 ($ million)
- Chart on Software - Year-over-year growth 2024-2029 (%)
- Data Table on Software - Year-over-year growth 2024-2029 (%)
- 11.4 Hardware - Market size and forecast 2024-2029
- Chart on Hardware - Market size and forecast 2024-2029 ($ million)
- Data Table on Hardware - Market size and forecast 2024-2029 ($ million)
- Chart on Hardware - Year-over-year growth 2024-2029 (%)
- Data Table on Hardware - Year-over-year growth 2024-2029 (%)
- 11.5 Services - Market size and forecast 2024-2029
- Chart on Services - Market size and forecast 2024-2029 ($ million)
- Data Table on Services - Market size and forecast 2024-2029 ($ million)
- Chart on Services - Year-over-year growth 2024-2029 (%)
- Data Table on Services - Year-over-year growth 2024-2029 (%)
- 11.6 Market opportunity by Component
- Market opportunity by Component ($ million)
- Data Table on Market opportunity by Component ($ million)
12 Customer Landscape
- 12.1 Customer landscape overview
- Analysis of price sensitivity, lifecycle, customer purchase basket, adoption rates, and purchase criteria
13 Geographic Landscape
- 13.1 Geographic segmentation
- Chart on Market share by geography 2024-2029 (%)
- Data Table on Market share by geography 2024-2029 (%)
- 13.2 Geographic comparison
- Chart on Geographic comparison
- Data Table on Geographic comparison
- 13.3 APAC - Market size and forecast 2024-2029
- Chart on APAC - Market size and forecast 2024-2029 ($ million)
- Data Table on APAC - Market size and forecast 2024-2029 ($ million)
- Chart on APAC - Year-over-year growth 2024-2029 (%)
- Data Table on APAC - Year-over-year growth 2024-2029 (%)
- 13.4 North America - Market size and forecast 2024-2029
- Chart on North America - Market size and forecast 2024-2029 ($ million)
- Data Table on North America - Market size and forecast 2024-2029 ($ million)
- Chart on North America - Year-over-year growth 2024-2029 (%)
- Data Table on North America - Year-over-year growth 2024-2029 (%)
- 13.5 Europe - Market size and forecast 2024-2029
- Chart on Europe - Market size and forecast 2024-2029 ($ million)
- Data Table on Europe - Market size and forecast 2024-2029 ($ million)
- Chart on Europe - Year-over-year growth 2024-2029 (%)
- Data Table on Europe - Year-over-year growth 2024-2029 (%)
- 13.6 Middle East and Africa - Market size and forecast 2024-2029
- Chart on Middle East and Africa - Market size and forecast 2024-2029 ($ million)
- Data Table on Middle East and Africa - Market size and forecast 2024-2029 ($ million)
- Chart on Middle East and Africa - Year-over-year growth 2024-2029 (%)
- Data Table on Middle East and Africa - Year-over-year growth 2024-2029 (%)
- 13.7 South America - Market size and forecast 2024-2029
- Chart on South America - Market size and forecast 2024-2029 ($ million)
- Data Table on South America - Market size and forecast 2024-2029 ($ million)
- Chart on South America - Year-over-year growth 2024-2029 (%)
- Data Table on South America - Year-over-year growth 2024-2029 (%)
- 13.8 US - Market size and forecast 2024-2029
- Chart on US - Market size and forecast 2024-2029 ($ million)
- Data Table on US - Market size and forecast 2024-2029 ($ million)
- Chart on US - Year-over-year growth 2024-2029 (%)
- Data Table on US - Year-over-year growth 2024-2029 (%)
- 13.9 Russia - Market size and forecast 2024-2029
- Chart on Russia - Market size and forecast 2024-2029 ($ million)
- Data Table on Russia - Market size and forecast 2024-2029 ($ million)
- Chart on Russia - Year-over-year growth 2024-2029 (%)
- Data Table on Russia - Year-over-year growth 2024-2029 (%)
- 13.10 South Korea - Market size and forecast 2024-2029
- Chart on South Korea - Market size and forecast 2024-2029 ($ million)
- Data Table on South Korea - Market size and forecast 2024-2029 ($ million)
- Chart on South Korea - Year-over-year growth 2024-2029 (%)
- Data Table on South Korea - Year-over-year growth 2024-2029 (%)
- 13.11 Japan - Market size and forecast 2024-2029
- Chart on Japan - Market size and forecast 2024-2029 ($ million)
- Data Table on Japan - Market size and forecast 2024-2029 ($ million)
- Chart on Japan - Year-over-year growth 2024-2029 (%)
- Data Table on Japan - Year-over-year growth 2024-2029 (%)
- 13.12 China - Market size and forecast 2024-2029
- Chart on China - Market size and forecast 2024-2029 ($ million)
- Data Table on China - Market size and forecast 2024-2029 ($ million)
- Chart on China - Year-over-year growth 2024-2029 (%)
- Data Table on China - Year-over-year growth 2024-2029 (%)
- 13.13 India - Market size and forecast 2024-2029
- Chart on India - Market size and forecast 2024-2029 ($ million)
- Data Table on India - Market size and forecast 2024-2029 ($ million)
- Chart on India - Year-over-year growth 2024-2029 (%)
- Data Table on India - Year-over-year growth 2024-2029 (%)
- 13.14 Germany - Market size and forecast 2024-2029
- Chart on Germany - Market size and forecast 2024-2029 ($ million)
- Data Table on Germany - Market size and forecast 2024-2029 ($ million)
- Chart on Germany - Year-over-year growth 2024-2029 (%)
- Data Table on Germany - Year-over-year growth 2024-2029 (%)
- 13.15 Mexico - Market size and forecast 2024-2029
- Chart on Mexico - Market size and forecast 2024-2029 ($ million)
- Data Table on Mexico - Market size and forecast 2024-2029 ($ million)
- Chart on Mexico - Year-over-year growth 2024-2029 (%)
- Data Table on Mexico - Year-over-year growth 2024-2029 (%)
- 13.16 Canada - Market size and forecast 2024-2029
- Chart on Canada - Market size and forecast 2024-2029 ($ million)
- Data Table on Canada - Market size and forecast 2024-2029 ($ million)
- Chart on Canada - Year-over-year growth 2024-2029 (%)
- Data Table on Canada - Year-over-year growth 2024-2029 (%)
- 13.17 France - Market size and forecast 2024-2029
- Chart on France - Market size and forecast 2024-2029 ($ million)
- Data Table on France - Market size and forecast 2024-2029 ($ million)
- Chart on France - Year-over-year growth 2024-2029 (%)
- Data Table on France - Year-over-year growth 2024-2029 (%)
- 13.18 Market opportunity by geography
- Market opportunity by geography ($ million)
- Data Tables on Market opportunity by geography ($ million)
14 Drivers, Challenges, and Opportunity/Restraints
- 14.3 Impact of drivers and challenges
- Impact of drivers and challenges in 2024 and 2029
- 14.4 Market opportunities/restraints
15 Competitive Landscape
- 15.2 Competitive Landscape
- Overview on criticality of inputs and factors of differentiation
- 15.3 Landscape disruption
- Overview on factors of disruption
- 15.4 Industry risks
- Impact of key risks on business
16 Competitive Analysis
- 16.2 Company ranking index
- 16.3 Market positioning of companies
- Matrix on companies position and classification
- 16.4 Broadcom Inc.
- Broadcom Inc. - Overview
- Broadcom Inc. - Business segments
- Broadcom Inc. - Key news
- Broadcom Inc. - Key offerings
- Broadcom Inc. - Segment focus
- SWOT
- 16.5 Furuno Electric Co. Ltd.
- Furuno Electric Co. Ltd. - Overview
- Furuno Electric Co. Ltd. - Business segments
- Furuno Electric Co. Ltd. - Key offerings
- Furuno Electric Co. Ltd. - Segment focus
- SWOT
- 16.6 Garmin Ltd.
- Garmin Ltd. - Overview
- Garmin Ltd. - Business segments
- Garmin Ltd. - Key news
- Garmin Ltd. - Key offerings
- Garmin Ltd. - Segment focus
- SWOT
- 16.7 Intel Corp.
- Intel Corp. - Overview
- Intel Corp. - Business segments
- Intel Corp. - Key news
- Intel Corp. - Key offerings
- Intel Corp. - Segment focus
- SWOT
- 16.8 L3Harris Technologies Inc.
- L3Harris Technologies Inc. - Overview
- L3Harris Technologies Inc. - Business segments
- L3Harris Technologies Inc. - Key news
- L3Harris Technologies Inc. - Key offerings
- L3Harris Technologies Inc. - Segment focus
- SWOT
- 16.9 MediaTek Inc.
- MediaTek Inc. - Overview
- MediaTek Inc. - Product / Service
- MediaTek Inc. - Key news
- MediaTek Inc. - Key offerings
- SWOT
- 16.10 Osmose Utilities Services Inc.
- Osmose Utilities Services Inc. - Overview
- Osmose Utilities Services Inc. - Product / Service
- Osmose Utilities Services Inc. - Key offerings
- SWOT
- 16.11 Qualcomm Inc.
- Qualcomm Inc. - Overview
- Qualcomm Inc. - Business segments
- Qualcomm Inc. - Key news
- Qualcomm Inc. - Key offerings
- Qualcomm Inc. - Segment focus
- SWOT
- 16.12 RTX Corp.
- RTX Corp. - Overview
- RTX Corp. - Business segments
- RTX Corp. - Key news
- RTX Corp. - Key offerings
- RTX Corp. - Segment focus
- SWOT
- 16.13 SkyTraq Technology Inc.
- SkyTraq Technology Inc. - Overview
- SkyTraq Technology Inc. - Product / Service
- SkyTraq Technology Inc. - Key offerings
- SWOT
- 16.14 STMicroelectronics NV
- STMicroelectronics NV - Overview
- STMicroelectronics NV - Business segments
- STMicroelectronics NV - Key news
- STMicroelectronics NV - Key offerings
- STMicroelectronics NV - Segment focus
- SWOT
- 16.15 Texas Instruments Inc.
- Texas Instruments Inc. - Overview
- Texas Instruments Inc. - Business segments
- Texas Instruments Inc. - Key offerings
- Texas Instruments Inc. - Segment focus
- SWOT
- 16.16 Topcon Corp.
- Topcon Corp. - Overview
- Topcon Corp. - Business segments
- Topcon Corp. - Key offerings
- Topcon Corp. - Segment focus
- SWOT
- 16.17 Trimble Inc.
- Trimble Inc. - Overview
- Trimble Inc. - Business segments
- Trimble Inc. - Key news
- Trimble Inc. - Key offerings
- Trimble Inc. - Segment focus
- SWOT
- 16.18 u blox AG
- u blox AG - Overview
- u blox AG - Business segments
- u blox AG - Key offerings
- u blox AG - Segment focus
- SWOT
17 Appendix
- 17.2 Inclusions and exclusions checklist
- Inclusions checklist
- Exclusions checklist
- 17.3 Currency conversion rates for US$
- Currency conversion rates for US$
- 17.4 Research methodology
- 17.7 Validation techniques employed for market sizing
- Validation techniques employed for market sizing
- 17.9 360 degree market analysis
- 360 degree market analysis
- 17.10 List of abbreviations