Gooseberry Products Market Size 2026-2030
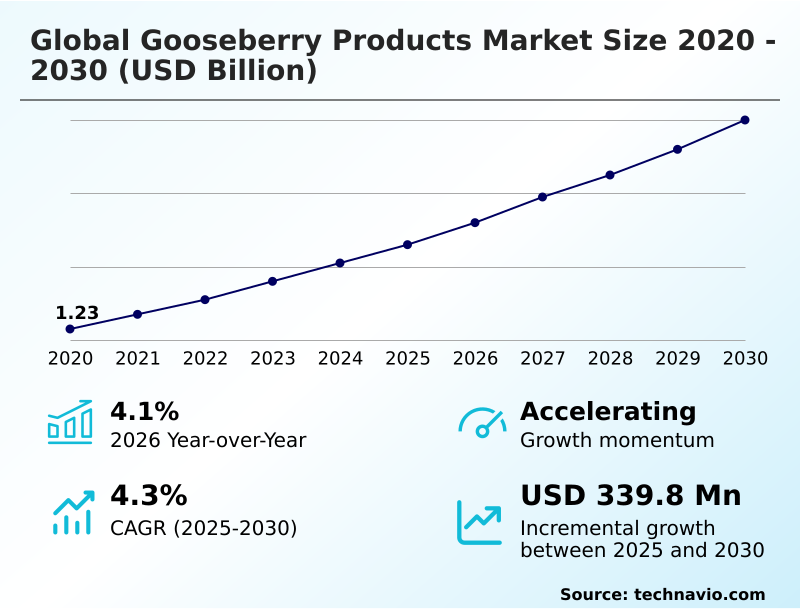
The gooseberry products market size is valued to increase by USD 339.8 million, at a CAGR of 4.3% from 2025 to 2030. Surging industrial demand for natural antioxidant and immunity-boosting ingredients will drive the gooseberry products market.
Major Market Trends & Insights
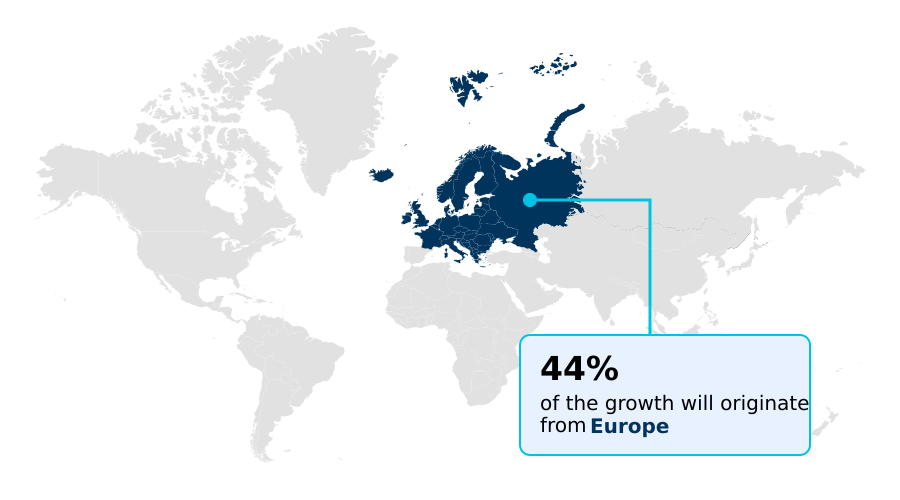
- Europe dominated the market and accounted for a 44.3% growth during the forecast period.
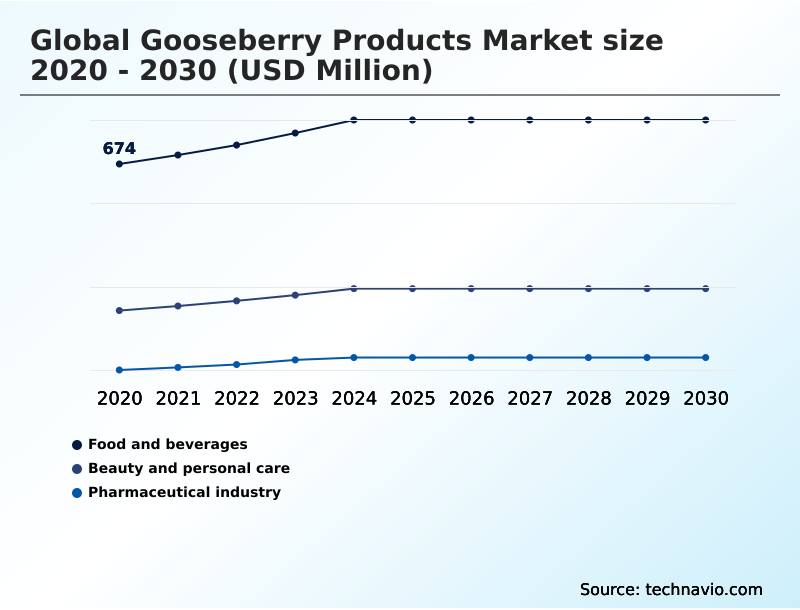
- By Application - Food and beverages segment was valued at USD 772.9 million in 2024
- By Product - Gooseberry powder segment accounted for the largest market revenue share in 2024
Market Size & Forecast
- Market Opportunities: USD 572.4 million
- Market Future Opportunities: USD 339.8 million
- CAGR from 2025 to 2030 : 4.3%
Market Summary
- The gooseberry products market is undergoing a significant transformation, evolving from a niche category to a mainstream component of the global wellness industry. This expansion is propelled by a convergence of consumer demand for nutrient-dense superfoods and industrial innovation in botanical ingredient processing.
- The market encompasses a range of value-added derivatives, from traditional jams and juices to highly purified standardized extracts used in nutraceutical and cosmetic formulations. A key dynamic is the dual demand for both European gooseberry varieties in culinary applications and the Indian gooseberry (Amla) for its therapeutic properties rooted in Ayurvedic traditions.
- For instance, a functional beverage company might reformulate its product line to include gooseberry-derived natural acidulants, replacing synthetic ascorbic acid to meet clean-label standards and appeal to health-conscious consumers. This shift requires overcoming supply chain challenges like harvest volatility and perishability through advanced cold-chain logistics and processing technologies.
- As such, the market's trajectory is defined by the interplay between agricultural science, food technology, and evolving consumer health priorities, creating opportunities for stakeholders who can ensure quality, traceability, and efficacy.
What will be the Size of the Gooseberry Products Market during the forecast period?
Get Key Insights on Market Forecast (PDF) Get Free Sample
How is the Gooseberry Products Market Segmented?
The gooseberry products industry research report provides comprehensive data (region-wise segment analysis), with forecasts and estimates in "USD million" for the period 2026-2030, as well as historical data from 2020-2024 for the following segments.
- Application
- Food and beverages
- Beauty and personal care
- Pharmaceutical industry
- Product
- Gooseberry powder
- Gooseberry jam
- Gooseberry tablets
- Gooseberry chilli sauce
- Gooseberry liquor
- Distribution channel
- Offline
- Online
- Geography
- Europe
- Germany
- UK
- France
- APAC
- China
- India
- Japan
- North America
- US
- Canada
- Mexico
- South America
- Brazil
- Argentina
- Middle East and Africa
- South Africa
- UAE
- Saudi Arabia
- Rest of World (ROW)
- Europe
By Application Insights
The food and beverages segment is estimated to witness significant growth during the forecast period.
The food and beverages sector is the primary application for gooseberry products, driven by the fruit's use as a natural acidulant and flavor enhancer.
Industrial utilization spans premium jams, functional drinks, and confectionery, where the fruit's tartness and nutritional profile are key.
Formats like gooseberry powder and gooseberry tablets extend its use beyond traditional preserves, enabling integration into functional foods and even adjacent wellness categories like ayurvedic skincare through cold-pressed oils.
The demand for clean-label ingredients has boosted its adoption, with formulators leveraging these botanical ingredients for everything from beverage fortification to private label skincare.
This segment, representing over 55% of application-based revenue, is bolstered by consumer interest in nutrient-dense, versatile products that offer both culinary appeal and functional health benefits.
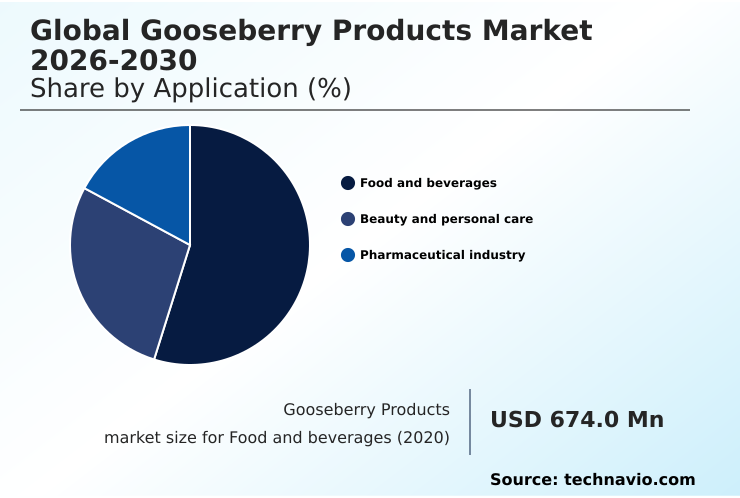
The Food and beverages segment was valued at USD 772.9 million in 2024 and showed a gradual increase during the forecast period.
Regional Analysis
Europe is estimated to contribute 44.3% to the growth of the global market during the forecast period.Technavio’s analysts have elaborately explained the regional trends and drivers that shape the market during the forecast period.
See How Gooseberry Products Market Demand is Rising in Europe Get Free Sample
The geographic landscape is dominated by APAC, the epicenter for Amla-based nutraceutical formulations and value-added derivatives, where freeze-drying is employed to preserve bioactive compounds.
Europe maintains a strong market for culinary applications and is a hub for developing high-quality clean-label ingredients.
North America is a fast-growing region, driven by demand for anti-aging creams and products providing hair-strengthening properties, with the region accounting for over 19% of the global opportunity.
Innovations in processing, like spray drying, enable the creation of versatile powders used in functional food ingredients globally. This regional specialization ensures a diverse product ecosystem, from traditional health remedies to advanced cosmetic applications, catering to varied consumer preferences worldwide.
Market Dynamics
Our researchers analyzed the data with 2025 as the base year, along with the key drivers, trends, and challenges. A holistic analysis of drivers will help companies refine their marketing strategies to gain a competitive advantage.
- The gooseberry products market is advancing beyond its traditional culinary roots, driven by sophisticated applications in health and wellness. Key to this evolution is the use of gooseberry extract for skin health and its function as a natural antioxidant in food processing.
- The demand for amla powder for immune support is surging, leading to a greater focus on high-potency botanical supplements. This requires overcoming significant logistical hurdles, particularly regarding cold chain logistics for perishables, which can account for up to 30% of the final product cost compared to shelf-stable goods.
- As a result, the industry is increasingly focused on developing clean-label functional beverage ingredients and standardized extracts for nutraceuticals. This shift is supported by technological advancements in fruit processing and a deeper understanding of gooseberry derivatives in functional foods. The emphasis on plant-based personal care formulation and sustainable sourcing of botanical ingredients is creating new avenues for growth.
- Furthermore, navigating regulatory compliance for herbal supplements and leveraging gooseberry products in ayurvedic medicine are central to long-term success, especially for natural ingredients for hair care and products for managing oxidative stress with gooseberries.
What are the key market drivers leading to the rise in the adoption of Gooseberry Products Industry?
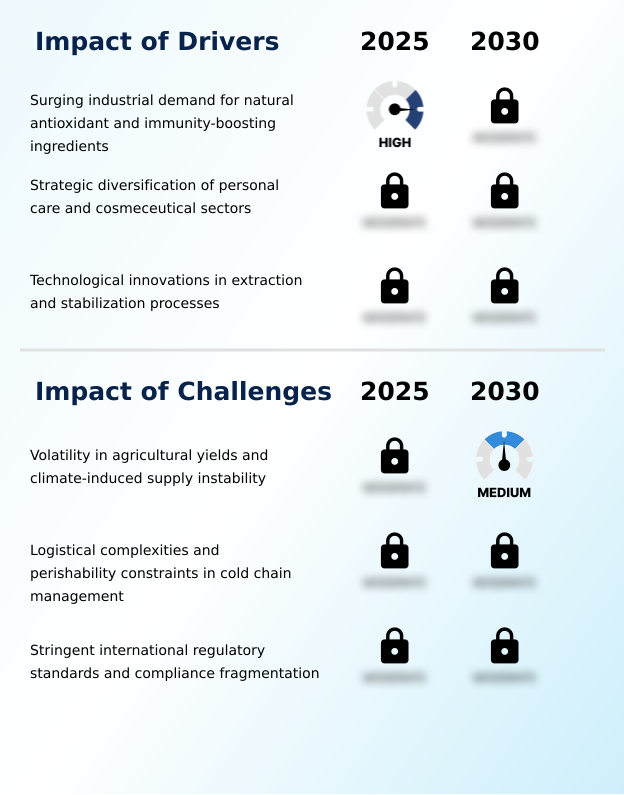
- Surging industrial demand for natural antioxidant and immunity-boosting ingredients is the key driver of the market.
- The market's expansion is significantly driven by a strong preventative health focus and demand for ingredients with a potent immunity-boosting profile.
- The fruit's high concentration of gallic acid, tannins, and flavonoids makes it an ideal natural acidulant and one of the most effective natural preservatives, extending product shelf life by up to 25% in certain applications.
- This biochemical signature is being leveraged more effectively due to advancements in industrial processing technologies, such as ultrasonic-assisted extraction, which improves yield by 15% and leads to superior shelf-stability enhancement.
- These innovations allow manufacturers to produce highly concentrated, stable powders and extracts, ensuring the fruit's beneficial properties are retained for various consumer goods.
What are the market trends shaping the Gooseberry Products Industry?
- An emphasis on clean-label transparency and traceable supply chains is an upcoming trend in the market. This is driving demand for verifiable sourcing and production information.
- A defining trend is the shift toward radical supply chain transparency, where traceable sourcing of herbal health care ingredients and ayurvedic formulations is becoming a prerequisite for brand trust.
- This emphasis on clean-label production directly supports the growth of plant-based formulations and plant-based alternatives, where gooseberry derivatives serve as natural preservatives and functional enhancers, with traceable products showing 18% higher consumer loyalty. Concurrently, a premiumization strategy is unfolding, leading to a proliferation of artisanal gourmet condiments and products in the specialty food sector.
- This trend is elevating gooseberry from a commodity to a high-value component in dietary supplements, with consumers showing a willingness to pay more for verified origin and superior quality.
What challenges does the Gooseberry Products Industry face during its growth?
- Volatility in agricultural yields and climate-induced supply instability is a key challenge affecting industry growth.
- A primary challenge is navigating supply chain volatility to produce consistent botanical extracts and herbal formulations. Fluctuating yields and fragmented regulatory landscapes complicate the creation of standardized extracts and reliable functional ingredient formulations, leading to batch-to-batch potency variations of up to 20%.
- This inconsistency poses a risk for manufacturers in high-value sectors such as nutricosmetics, where consistent skin-brightening properties are expected. Addressing the need for better oxidative stress management through supplements requires a dependable supply of high-potency ingredients.
- Consequently, establishing robust supply chain traceability is a critical necessity to ensure product quality and meet the stringent demands of global health and beauty markets, which can reduce compliance-related delays by 30%.
Exclusive Technavio Analysis on Customer Landscape
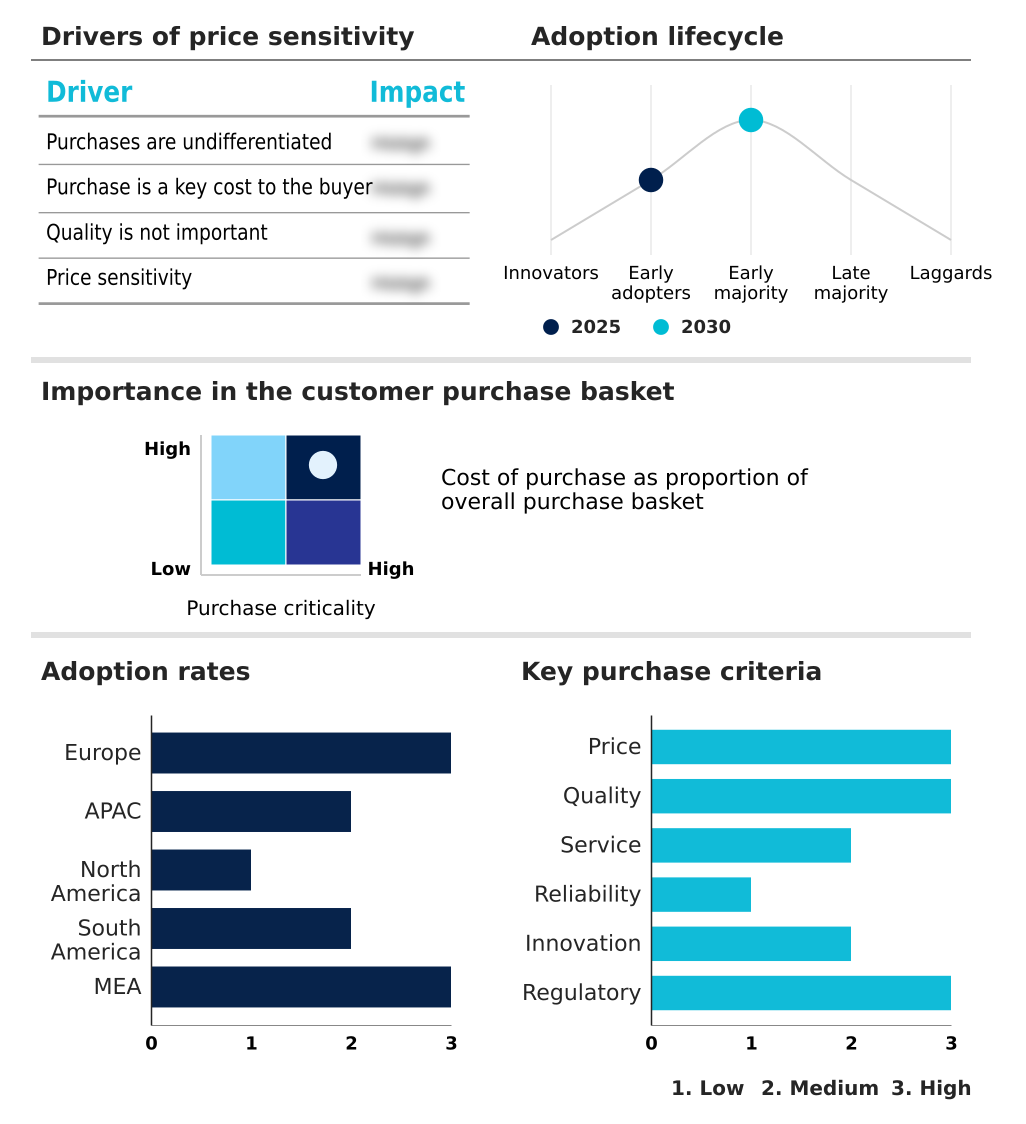
The gooseberry products market forecasting report includes the adoption lifecycle of the market, covering from the innovator’s stage to the laggard’s stage. It focuses on adoption rates in different regions based on penetration. Furthermore, the gooseberry products market report also includes key purchase criteria and drivers of price sensitivity to help companies evaluate and develop their market growth analysis strategies.
Customer Landscape of Gooseberry Products Industry
Competitive Landscape
Companies are implementing various strategies, such as strategic alliances, gooseberry products market forecast, partnerships, mergers and acquisitions, geographical expansion, and product/service launches, to enhance their presence in the industry.
Aadhunik Ayurveda Vitals - Key offerings include standardized botanical extracts and value-added derivatives such as amla powder, tablets, and functional ingredients for nutraceutical, food, and personal care applications.
The industry research and growth report includes detailed analyses of the competitive landscape of the market and information about key companies, including:
- Aadhunik Ayurveda Vitals
- AmbePhytoextracts Pvt. Ltd.
- Arjuna Natural Pvt. Ltd.
- Atulya
- Dabur India Ltd.
- Euroasias Organics
- Kiril Mischeff Ltd.
- Maya Industries
- Neelamari Herbs
- Oregon Fruit Products
- Paradise Herbs And Essentials
- Patanjali Ayurved Ltd.
- ProV Foods Pvt. Ltd.
- Risun Bio Tech Inc.
- Sydler India Pvt. Ltd.
- Taiyo Kagaku Co. Ltd.
- Taj Agro Products Ltd.
- The Himalaya Drug Co.
- Two Brothers Organic Farms
Qualitative and quantitative analysis of companies has been conducted to help clients understand the wider business environment as well as the strengths and weaknesses of key industry players. Data is qualitatively analyzed to categorize companies as pure play, category-focused, industry-focused, and diversified; it is quantitatively analyzed to categorize companies as dominant, leading, strong, tentative, and weak.
Recent Development and News in Gooseberry products market
- In May, 2025, Sami-Sabinsa Group officially showcased its Saberry amla extract at the Expo West trade show, emphasizing high-purity, standardized formulations for the functional beverage and nutraceutical markets.
- In April, 2025, Sami-Sabinsa Group released a comprehensive research compendium, 'Amla, Super-Fruit with Superior Science,' detailing advanced phytochemical profiles and standardization protocols for gooseberry extracts.
- In March, 2025, Dabur India Ltd. initiated the construction of a new large-scale manufacturing facility in Tamil Nadu to bolster the supply chain for its natural healthcare portfolio, which features gooseberry-based formulations.
- In January, 2025, Sami-Sabinsa Group commenced operations at its new manufacturing facility, Hassan Unit-2, in India, dedicated to producing standardized herbal ingredients, including high-grade gooseberry extracts.
Dive into Technavio’s robust research methodology, blending expert interviews, extensive data synthesis, and validated models for unparalleled Gooseberry Products Market insights. See full methodology.
| Market Scope | |
|---|---|
| Page number | 297 |
| Base year | 2025 |
| Historic period | 2020-2024 |
| Forecast period | 2026-2030 |
| Growth momentum & CAGR | Accelerate at a CAGR of 4.3% |
| Market growth 2026-2030 | USD 339.8 million |
| Market structure | Fragmented |
| YoY growth 2025-2026(%) | 4.1% |
| Key countries | Germany, UK, France, Poland, The Netherlands, Spain, China, India, Japan, Australia, South Korea, Indonesia, US, Canada, Mexico, Brazil, Argentina, Chile, South Africa, UAE, Saudi Arabia, Nigeria and Egypt |
| Competitive landscape | Leading Companies, Market Positioning of Companies, Competitive Strategies, and Industry Risks |
Research Analyst Overview
- The gooseberry products market is characterized by a strategic shift toward scientifically validated, high-purity botanical ingredients. The industry's growth hinges on the effective use of botanical extracts and standardized extracts, which are rich in phytochemicals like ascorbic acid and other polyphenolic compounds.
- Advanced processing methods, including spray drying and freeze-drying, are critical for producing stable, clean-label ingredients with preserved bioactive compounds for nutraceutical formulations. These versatile inputs, ranging from natural acidulants to functional ingredient formulations, are pivotal in developing herbal formulations and plant-based alternatives for dietary supplements and functional foods.
- A key boardroom consideration is the investment in traceable supply chains, which can reduce raw material sourcing errors by over 25%. This focus on quality and transparency is essential for expanding into high-value applications, including Ayurvedic skincare, cold-pressed oils, and other private label skincare products leveraging essential oils and herbal health care principles.
What are the Key Data Covered in this Gooseberry Products Market Research and Growth Report?
-
What is the expected growth of the Gooseberry Products Market between 2026 and 2030?
-
USD 339.8 million, at a CAGR of 4.3%
-
-
What segmentation does the market report cover?
-
The report is segmented by Application (Food and beverages, Beauty and personal care, and Pharmaceutical industry), Product (Gooseberry powder, Gooseberry jam, Gooseberry tablets, Gooseberry chilli sauce, and Gooseberry liquor), Distribution Channel (Offline, and Online) and Geography (Europe, APAC, North America, South America, Middle East and Africa)
-
-
Which regions are analyzed in the report?
-
Europe, APAC, North America, South America and Middle East and Africa
-
-
What are the key growth drivers and market challenges?
-
Surging industrial demand for natural antioxidant and immunity-boosting ingredients, Volatility in agricultural yields and climate-induced supply instability
-
-
Who are the major players in the Gooseberry Products Market?
-
Aadhunik Ayurveda Vitals, AmbePhytoextracts Pvt. Ltd., Arjuna Natural Pvt. Ltd., Atulya, Dabur India Ltd., Euroasias Organics, Kiril Mischeff Ltd., Maya Industries, Neelamari Herbs, Oregon Fruit Products, Paradise Herbs And Essentials, Patanjali Ayurved Ltd., ProV Foods Pvt. Ltd., Risun Bio Tech Inc., Sydler India Pvt. Ltd., Taiyo Kagaku Co. Ltd., Taj Agro Products Ltd., The Himalaya Drug Co. and Two Brothers Organic Farms
-
Market Research Insights
- The market is shaped by a dynamic interplay of industrial demand and consumer-driven wellness trends. The strategic adoption of plant-based formulations is a key factor, with firms reporting that products featuring natural preservatives see a 15% higher repeat purchase rate. A prominent premiumization strategy is also evident, where gourmet condiments and specialty food sector offerings leverage the fruit's unique profile.
- The industry is also influenced by the growing nutricosmetics sector, where gooseberry's skin-brightening properties are highly valued. Companies that successfully navigate supply chain traceability and focus on preventative health solutions are better positioned for growth, as evidenced by a 20% increase in market penetration for brands with transparent sourcing.
We can help! Our analysts can customize this gooseberry products market research report to meet your requirements.
 RIA -
RIA - 
