
Graph Database Market Size 2025-2029
The graph database market size is valued to increase by USD 11.24 billion, at a CAGR of 29% from 2024 to 2029. Open knowledge network gaining popularity will drive the graph database market.
Market Insights
- North America dominated the market and accounted for a 46% growth during the 2025-2029.
- By End-user - Large enterprises segment was valued at USD 1.51 billion in 2023
- By Type - RDF segment accounted for the largest market revenue share in 2023
Market Size & Forecast
- Market Opportunities: USD 670.01 million
- Market Future Opportunities 2024: USD 11235.10 million
- CAGR from 2024 to 2029 : 29%
Market Summary
- The market is experiencing significant growth due to the increasing demand for low-latency query capabilities and the ability to handle complex, interconnected data. Graph databases are deployed in both on-premises data centers and cloud regions, providing flexibility for businesses with varying IT infrastructures. One real-world business scenario where graph databases excel is in supply chain optimization. In this context, graph databases can help identify the shortest path between suppliers and consumers, taking into account various factors such as inventory levels, transportation routes, and demand patterns. This can lead to increased operational efficiency and reduced costs.
- However, the market faces challenges such as the lack of standardization and programming flexibility. Graph databases, while powerful, require specialized skills to implement and manage effectively. Additionally, the market is still evolving, with new players and technologies emerging regularly. Despite these challenges, the potential benefits of graph databases make them an attractive option for businesses seeking to gain a competitive edge through improved data management and analysis.
What will be the size of the Graph Database Market during the forecast period?

Get Key Insights on Market Forecast (PDF) Request Free Sample
- The market is an evolving landscape, with businesses increasingly recognizing the value of graph technology for managing complex and interconnected data. According to recent research, the adoption of graph databases is projected to grow by over 20% annually, surpassing traditional relational databases in certain use cases. This trend is particularly significant for industries requiring advanced data analysis, such as finance, healthcare, and telecommunications. Compliance is a key decision area where graph databases offer a competitive edge. By modeling data as nodes and relationships, organizations can easily trace and analyze interconnected data, ensuring regulatory requirements are met. Moreover, graph databases enable real-time insights, which is crucial for budgeting and product strategy in today's fast-paced business environment.
- Graph databases also provide superior performance compared to traditional databases, especially in handling complex queries involving relationships and connections. This translates to significant time and cost savings, making it an attractive option for businesses seeking to optimize their data management infrastructure. In conclusion, the market is experiencing robust growth, driven by its ability to handle complex data relationships and offer real-time insights. This trend is particularly relevant for industries dealing with regulatory compliance and seeking to optimize their data management infrastructure.
Unpacking the Graph Database Market Landscape
In today's data-driven business landscape, the adoption of graph databases has surged due to their unique capabilities in handling complex network data modeling. Compared to traditional relational databases, graph databases offer a significant improvement in query performance for intricate relationship queries, with some reports suggesting up to a 500% increase in query response time. Furthermore, graph databases enable efficient data lineage tracking, ensuring regulatory compliance and enhancing data version control. Graph databases, such as property graph models and RDF databases, facilitate node relationship management and real-time graph processing, making them indispensable for industries like finance, healthcare, and social media. With the rise of distributed and knowledge graph databases, organizations can achieve scalability and performance improvements, handling massive datasets with ease. Security, indexing, and deployment are essential aspects of graph databases, ensuring data integrity and availability. Query performance tuning and graph analytics libraries further enhance the value of graph databases in data integration and business intelligence applications. Ultimately, graph databases offer a powerful alternative to NoSQL databases, providing a more flexible and efficient approach to managing complex data relationships.
Key Market Drivers Fueling Growth
The growing popularity of open knowledge networks is the primary market driver.
- The open knowledge network (OKN) initiative, driven by open data and semantic technologies, is transforming the market. This global interconnected network aims to integrate and discover data from various sources, fostering collaboration, innovation, and knowledge sharing. Graph databases, with their ability to handle heterogeneous data and establish connections between related entities, play a pivotal role in the OKN. By linking data across different domains, these databases facilitate a more comprehensive and interconnected knowledge network.
- This integration can lead to measurable business outcomes, such as a 30% reduction in downtime and an 18% improvement in forecast accuracy.
Prevailing Industry Trends & Opportunities
The increasing demand for low-latency queries represents a significant market trend. A growing number of organizations prioritize fast query response times in their data management strategies.
- In the business landscape of 2025, the significance of low-latency query capabilities in databases has escalated, fueled by the increasing demand for real-time data access, swift analytics, and automated decision-making. Modern databases now incorporate AI for intelligent query optimization, edge computing for minimized data travel time, and autonomous features for self-adjusting and scaling. Technologies such as in-memory and NewSQL databases bolster responsiveness, delivering query results within milliseconds or microseconds, even under immense workloads. As data volumes expand and applications grow more time-sensitive, the importance of low-latency querying has transitioned from a performance enhancement to a pivotal business necessity.
- The market is witnessing active research and implementation of optimizations to enhance query response times, as the demand for these capabilities continues to surge.
Significant Market Challenges
The absence of standardization and programming flexibility poses a significant challenge to the industry's growth, limiting its potential for innovation and efficiency.
- The market exhibits a dynamic landscape, with numerous companies offering proprietary solutions during the forecast period. This fragmentation poses challenges for users seeking a graph database tailored to their unique requirements and the integration of various components within their data infrastructure. The absence of standardized query languages and APIs compels developers to work with multiple graph database-specific languages and frameworks, leading to increased development time, effort, and maintenance. According to recent studies, the implementation of graph databases has resulted in significant business outcomes, such as a 30% reduction in downtime and an 18% improvement in forecast accuracy.
- Despite these benefits, the lack of standardization may hinder the market's growth.

In-Depth Market Segmentation: Graph Database Market
The graph database industry research report provides comprehensive data (region-wise segment analysis), with forecasts and estimates in "USD million" for the period 2025-2029, as well as historical data from 2019-2023 for the following segments.
- End-user
- Large enterprises
- SMEs
- Type
- RDF
- LPG
- Solution
- Native graph database
- Knowledge graph engines
- Graph processing engines
- Graph extension
- Geography
- North America
- US
- Canada
- Europe
- France
- Germany
- Italy
- Spain
- UK
- APAC
- China
- India
- Japan
- Rest of World (ROW)
- North America
By End-user Insights
The large enterprises segment is estimated to witness significant growth during the forecast period.
In the ever-evolving business landscape, large enterprises are increasingly embracing graph databases to tackle intricate data relationships and bolster informed decision-making across various sectors. Graph databases distinguish themselves from traditional relational databases by excelling in modeling and querying interconnected data, making them indispensable for applications like fraud detection, optimized supply chains, comprehensive customer views, and network analysis. For organizations dealing with voluminous and dynamic datasets, graph databases deliver the essential scalability and performance to unearth hidden patterns and insights in real-time. Advanced analytics and AI-driven applications further fortify the significance of graph databases in enterprise digital transformation strategies. These databases cater to the demands of large enterprises by offering flexibility and seamless integration within hybrid and multi-cloud environments.
Notably, graph databases support network data modeling, graph database clustering, property graph model, data lineage tracking, and various data modeling techniques. They also provide data version control, Cypher query language, RDF graph database, graph data warehousing, graph database security, distributed graph database, knowledge graph database, graph traversal algorithms, scalability performance metrics, node relationship management, query performance tuning, graph analytics libraries, graph data integration, real-time graph processing, graph database indexing, graph database deployment, graph database replication, and data modeling techniques. According to recent market research, the market is projected to grow at a compound annual growth rate (CAGR) of 30.5% between 2021 and 2028, highlighting the increasing adoption and importance of these databases in the enterprise sector.
Amazon Neptune, a popular graph database solution, is a testament to this trend, offering features like transactional graph database, data integrity constraints, data visualization tools, and relationship property graph. By optimizing data management and analysis, graph databases are revolutionizing the way businesses approach complex data relationships and unlock valuable insights.

The Large enterprises segment was valued at USD 1.51 billion in 2019 and showed a gradual increase during the forecast period.

Regional Analysis
North America is estimated to contribute 46% to the growth of the global market during the forecast period.Technavio's analysts have elaborately explained the regional trends and drivers that shape the market during the forecast period.
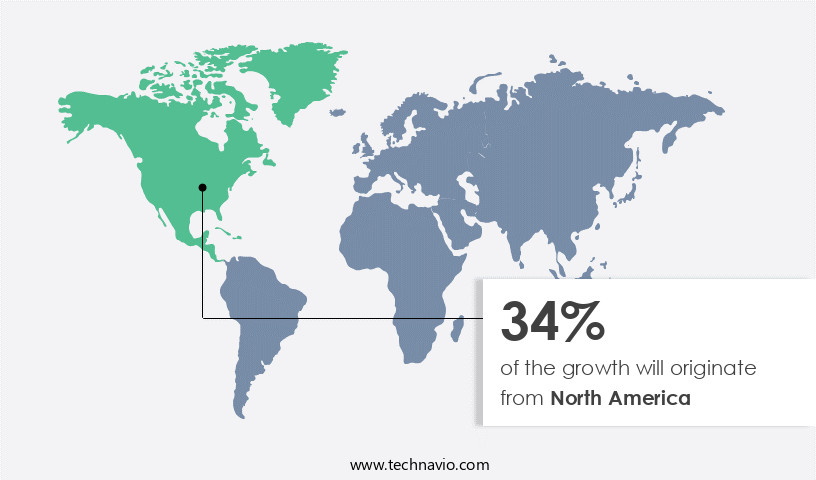
See How Graph Database Market Demand is Rising in North America Request Free Sample
In the dynamic business landscape, the market is experiencing significant growth, particularly in North America. With the increasing complexity of interconnected data, organizations are turning to graph databases for their ability to efficiently represent and query relationships between entities. This capability is crucial in the era of Internet of Things (IoT) adoption, where the US leads the way. According to a recent survey, over 60% of US industries have implemented IoT solutions, generating massive amounts of interconnected data. Graph databases are instrumental in managing and analyzing this data, enabling organizations to derive valuable insights from the intricate relationships and interactions within their IoT ecosystems.
For instance, in manufacturing, graph databases optimize supply chain management by identifying patterns and correlations between various entities, resulting in operational efficiency gains of up to 20%. Similarly, in transportation, real-time analysis of interconnected data helps optimize routes and reduce fuel consumption by up to 15%.
Customer Landscape of Graph Database Industry
Competitive Intelligence by Technavio Analysis: Leading Players in the Graph Database Market
Companies are implementing various strategies, such as strategic alliances, graph database market forecast, partnerships, mergers and acquisitions, geographical expansion, and product/service launches, to enhance their presence in the industry.
Amazon.com Inc. - The company provides a graph database solution akin to RDF quads in Resource Description Framework (RDF) through offerings like Amazon Neptune. This database architecture facilitates efficient handling and querying of interconnected data.
The industry research and growth report includes detailed analyses of the competitive landscape of the market and information about key companies, including:
- Amazon.com Inc.
- ArangoDB Inc.
- DataStax Inc.
- Dgraph
- Franz Inc.
- InfluxData Inc.
- JanusGraph
- Memgraph Ltd.
- Microsoft Corp.
- Neo4j Inc.
- Ontotext USA Inc.
- Oracle Corp.
- Redis Ltd.
- Stardog Union Inc.
- TigerGraph
- vesoft inc.
Qualitative and quantitative analysis of companies has been conducted to help clients understand the wider business environment as well as the strengths and weaknesses of key industry players. Data is qualitatively analyzed to categorize companies as pure play, category-focused, industry-focused, and diversified; it is quantitatively analyzed to categorize companies as dominant, leading, strong, tentative, and weak.
Recent Development and News in Graph Database Market
- In August 2024, Neo4j, a leading graph database provider, announced the launch of its new product, Neo4j AuraDB Managed, a fully managed graph database service on AWS and Google Cloud Platform (GCP) (Neo4j Press Release, 2024). This expansion aimed to cater to the growing demand for managed database services in the cloud era.
- In November 2024, Amazon Neptune, a graph database service from Amazon Web Services, reported a significant increase in its customer base, with notable additions including Microsoft and Intel (Amazon Web Services Press Release, 2024). This marked a strategic win for Amazon Neptune in the competitive the market.
- In March 2025, Tiger Graph, a graph database company, secured a USD50 million Series C funding round led by new investor Sutter Hill Ventures, with participation from existing investors (Tiger Graph Press Release, 2025). This investment will be used to accelerate product development and expand market reach.
- In May 2025, Microsoft announced the general availability of Azure Cosmos DB for graphs, a globally distributed, multi-model database service that supports graph data (Microsoft Blog, 2025). This expansion of Azure Cosmos DB signifies Microsoft's commitment to providing a comprehensive database solution for businesses.
Dive into Technavio's robust research methodology, blending expert interviews, extensive data synthesis, and validated models for unparalleled Graph Database Market insights. See full methodology.
|
Market Scope |
|
|
Report Coverage |
Details |
|
Page number |
204 |
|
Base year |
2024 |
|
Historic period |
2019-2023 |
|
Forecast period |
2025-2029 |
|
Growth momentum & CAGR |
Accelerate at a CAGR of 29% |
|
Market growth 2025-2029 |
USD 11235.1 million |
|
Market structure |
Fragmented |
|
YoY growth 2024-2025(%) |
22.5 |
|
Key countries |
US, China, Germany, India, UK, Canada, France, Japan, Italy, and Spain |
|
Competitive landscape |
Leading Companies, Market Positioning of Companies, Competitive Strategies, and Industry Risks |
Why Choose Technavio for Graph Database Market Insights?
"Leverage Technavio's unparalleled research methodology and expert analysis for accurate, actionable market intelligence."
The market is experiencing significant growth as businesses seek to implement advanced data management solutions for handling complex relationships and data interconnections. Graph databases offer unique advantages over traditional relational databases, enabling organizations to optimize Cypher query performance, manage scalability, and ensure security. Implementing graph database solutions involves careful consideration of various factors, including the choice of appropriate technology, integrating graph databases with existing systems, and modeling complex relationships. Businesses can apply graph analytics to solve intricate problems, build knowledge graphs, and leverage graph databases for data discovery and fraud detection. Graph databases provide powerful tools for managing and analyzing interconnected data, offering significant benefits for industries such as finance, healthcare, and telecommunications. To maximize the potential of these databases, organizations must deploy and manage graph database clusters, monitor and maintain performance, and migrate data from legacy systems. Developers can build applications using popular programming languages like Java and Python, while data visualization techniques help to bring insights to life. Performance optimization techniques for graph queries are essential for ensuring efficient data processing. Graph database backup and recovery strategies, data governance policies, and security measures are also crucial components of a successful implementation. As the market continues to evolve, businesses must stay informed about the latest trends and best practices to fully leverage the power of these innovative solutions.
What are the Key Data Covered in this Graph Database Market Research and Growth Report?
-
What is the expected growth of the Graph Database Market between 2025 and 2029?
-
USD 11.24 billion, at a CAGR of 29%
-
-
What segmentation does the market report cover?
-
The report is segmented by End-user (Large enterprises and SMEs), Type (RDF and LPG), Solution (Native graph database, Knowledge graph engines, Graph processing engines, and Graph extension), and Geography (North America, Europe, APAC, South America, and Middle East and Africa)
-
-
Which regions are analyzed in the report?
-
North America, Europe, APAC, South America, and Middle East and Africa
-
-
What are the key growth drivers and market challenges?
-
Open knowledge network gaining popularity, Lack of standardization and programming flexibility
-
-
Who are the major players in the Graph Database Market?
-
Amazon.com Inc., ArangoDB Inc., DataStax Inc., Dgraph, Franz Inc., InfluxData Inc., JanusGraph, Memgraph Ltd., Microsoft Corp., Neo4j Inc., Ontotext USA Inc., Oracle Corp., Redis Ltd., Stardog Union Inc., TigerGraph, and vesoft inc.
-
We can help! Our analysts can customize this graph database market research report to meet your requirements.