Gym And Health Clubs Market Analysis, Size, and Forecast 2026-2030: North America (US, Canada, and Mexico), APAC (China, Japan, and India), Europe (Germany, UK, and France), Middle East and Africa (South Africa, UAE, and Saudi Arabia), South America (Brazil, Argentina, and Colombia), and Rest of World (ROW)

Gym And Health Clubs Market Analysis, Size, and Forecast 2026-2030:
North America (US, Canada, and Mexico), APAC (China, Japan, and India), Europe (Germany, UK, and France), Middle East and Africa (South Africa, UAE, and Saudi Arabia), South America (Brazil, Argentina, and Colombia), and Rest of World (ROW)

Published: Mar 2026 286 Pages SKU: IRTNTR44222

Market Overview at a Glance

$43.89 B
Market Opportunity
6.1%
CAGR 2025 - 2030
40.5%
North America Growth
$104.98 B
Membership fees segment 2024

Gym And Health Clubs Market Size 2026-2030

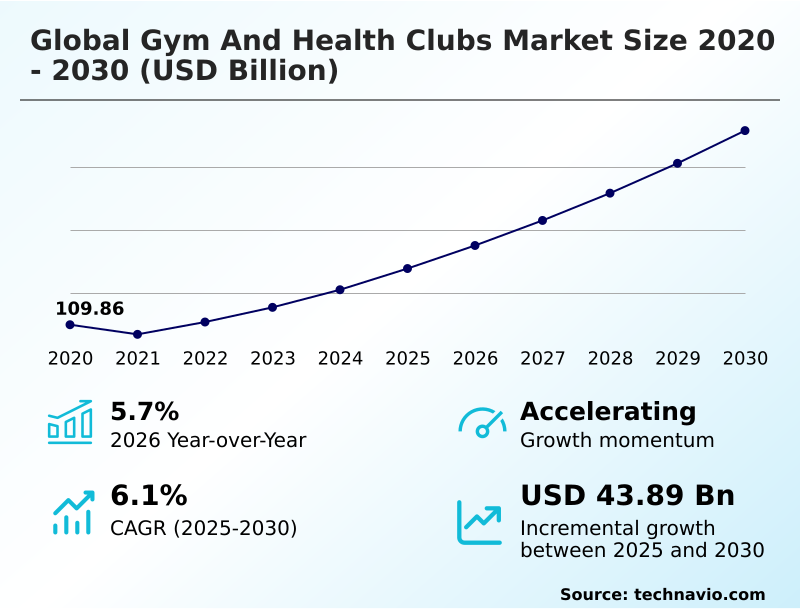
The gym and health clubs market size is valued to increase by USD 43.89 billion, at a CAGR of 6.1% from 2025 to 2030. Increasing health and wellness consciousness for consumers will drive the gym and health clubs market.

Major Market Trends & Insights

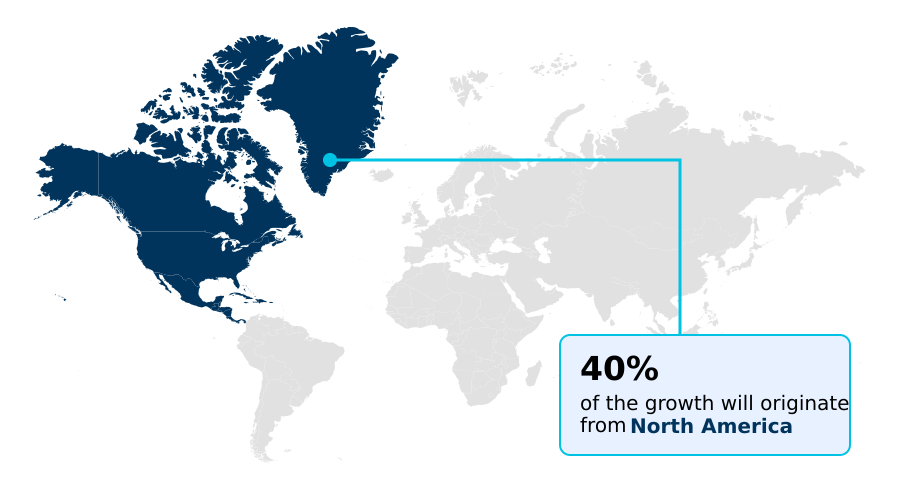
  • North America dominated the market and accounted for a 40.5% growth during the forecast period.
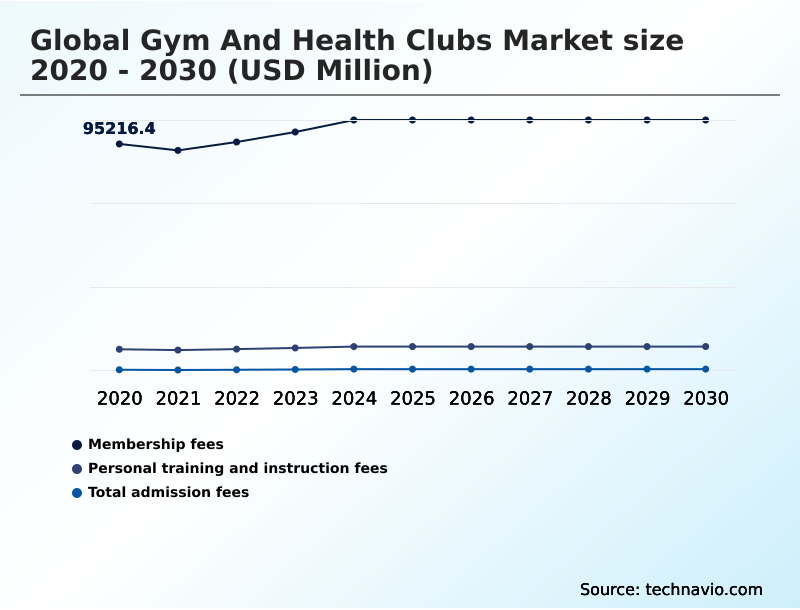
  • By Service - Membership fees segment was valued at USD 104.98 billion in 2024
  • By Type - Private segment accounted for the largest market revenue share in 2024

Market Size & Forecast

  • Market Opportunities: USD 61.77 billion
  • Market Future Opportunities: USD 43.89 billion
  • CAGR from 2025 to 2030 : 6.1%

Market Summary

  • The gym and health clubs market is undergoing a significant transformation, moving beyond traditional fitness to become comprehensive holistic wellness hubs. Key drivers include a greater focus on preventative healthcare measures and the widespread adoption of corporate wellness programs.
  • This shift is reshaping service models, with full-service health clubs and boutique fitness studios alike incorporating specialized instruction and integrated health offerings such as nutritional counseling and recovery therapies. Technology is a critical enabler, with wearable technology integration, ai-powered coaching, and digital fitness platforms delivering personalized workout plans and improving data-informed member engagement.
  • A key business scenario involves leveraging gym management software to optimize operational efficiency. For instance, by analyzing member usage patterns to adjust class schedules and staffing, operators can reduce overhead costs while simultaneously enhancing the customer-centric service experience. This data-driven approach is crucial for navigating challenges like competition from at-home solutions and rising operational expenses.
  • The market's future hinges on creating a seamless hybrid fitness model that merges physical and digital experiences, fostering community-driven fitness, and proving a clear return on wellness investment for both individuals and corporate partners.

What will be the Size of the Gym And Health Clubs Market during the forecast period?

Get Key Insights on Market Forecast (PDF) Request Free Sample

How is the Gym And Health Clubs Market Segmented?

The gym and health clubs industry research report provides comprehensive data (region-wise segment analysis), with forecasts and estimates in "USD million" for the period 2026-2030, as well as historical data from 2020-2024 for the following segments.

  • Service
    • Membership fees
    • Personal training and instruction fees
    • Total admission fees
  • Type
    • Private
    • Public
  • End-user
    • Individuals
    • Corporates
  • Geography
    • North America
      • US
      • Canada
      • Mexico
    • APAC
      • China
      • Japan
      • India
    • Europe
      • Germany
      • UK
      • France
    • Middle East and Africa
      • South Africa
      • UAE
      • Saudi Arabia
    • South America
      • Brazil
      • Argentina
      • Colombia
    • Rest of World (ROW)

By Service Insights

The membership fees segment is estimated to witness significant growth during the forecast period.

The membership fees segment is evolving from rigid contracts to dynamic membership fee structures that prioritize value-driven retention over simple volume-driven acquisition.

Operators now utilize tiered pricing strategies and flexible payment options like pay-as-you-go membership as a key customer acquisition channel.

This data-driven approach allows for sophisticated member administration and improved operational efficiency, with advanced gym management software managing everything from billing to access control.

The success of the high-value low-price segment has demonstrated that facilities optimizing their pricing models can achieve member loyalty improvements of over 15%.

This strategy is complemented by ancillary income from services such as personal training fees to maximize revenue per member.

Request Free Sample

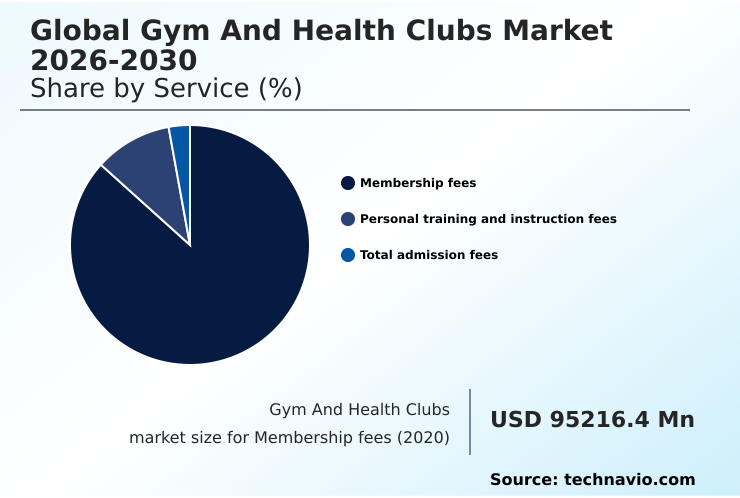
The Membership fees segment was valued at USD 104.98 billion in 2024 and showed a gradual increase during the forecast period.

Request Free Sample

Regional Analysis

North America is estimated to contribute 40.5% to the growth of the global market during the forecast period.Technavio’s analysts have elaborately explained the regional trends and drivers that shape the market during the forecast period.

See How Gym And Health Clubs Market Demand is Rising in North America Request Free Sample

The geographic landscape is defined by regional maturity and consumer demand for integrated health offerings. North America, which accounts for over 40% of incremental growth, sees high demand for premium fitness facilities offering medical wellness services and personalized workout plans.

European clubs emphasize physical recovery, incorporating cryotherapy, infrared saunas, and assisted stretching into standard packages. In APAC, the fastest-growing region, the focus is on family-oriented fitness and group exercise studios with round-the-clock access.

These specialized services, including nutritional counseling, have become a primary customer acquisition channel, with facilities offering them reporting a 15% higher conversion rate from trials to full memberships compared to basic gym-only models.

Market Dynamics

Our researchers analyzed the data with 2025 as the base year, along with the key drivers, trends, and challenges. A holistic analysis of drivers will help companies refine their marketing strategies to gain a competitive advantage.

  • The strategic direction of the fitness industry is shaped by key transformative pressures, including the imperative of integrating medical wellness into fitness models. This move is a direct response to the consumer demand for holistic wellness services and the need for providing glp-1 companion fitness programs.
  • A central theme is hyper-personalization through technology and data, which underpins the role of AI in personalized fitness coaching and the widespread adoption of wearable tech in gyms.
  • This technology integration in gym member engagement is essential for developing strategies for improving member retention rates, which have been shown to increase by over 20% in clubs that effectively leverage member data. Concurrently, the market is navigating the competition between budget gyms and boutiques and the financial strain of rising operational costs for fitness centers.
  • The growth of specialized boutique fitness studios, which capitalize on the importance of community in boutique studios, has fragmented the consumer base. In response, larger clubs are diversifying revenue streams for health clubs and adopting a premiumization strategy for low-cost gyms.
  • The industry is also contending with challenges from at-home fitness solutions by promoting hybrid models combining in-person and digital fitness. The impact of corporate wellness on memberships and the impact of flexible memberships on loyalty are reshaping acquisition strategies.
  • Ultimately, the successful convergence of fitness and the medical sector depends on using data analytics for identifying at-risk members and delivering quantifiable health outcomes.

What are the key market drivers leading to the rise in the adoption of Gym And Health Clubs Industry?

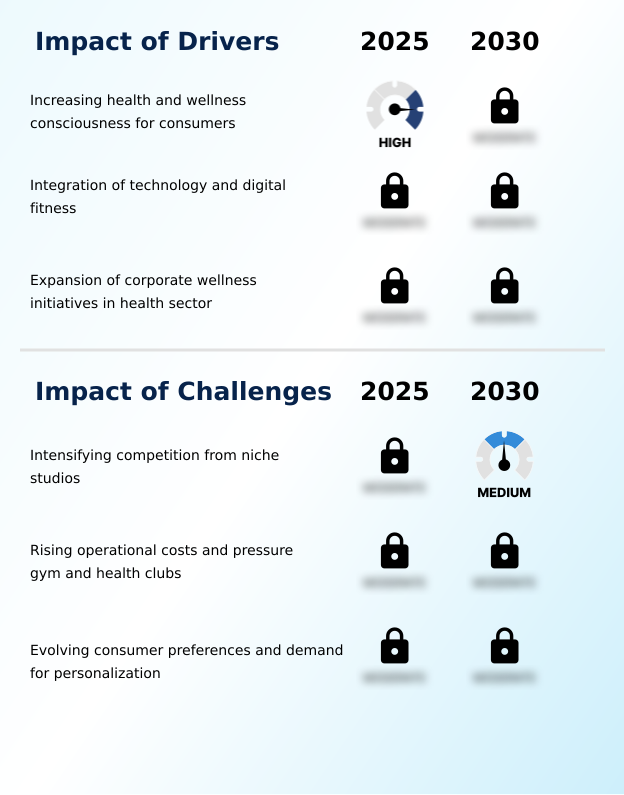
  • A key market driver is the increasing health and wellness consciousness among consumers, compelling them to seek preventative health measures and adopt more active lifestyles.

  • The adoption of preventative healthcare measures and a focus on preventative health management are key drivers. This is amplified by the expansion of corporate wellness programs and dedicated corporate partnership programs, which make facilities more accessible.
  • Technology is pivotal, with wearable technology integration providing biometric feedback for data-informed member engagement and ai-powered coaching.
  • The rollout of smart fitness equipment and fitness tracking apps provides convenient fitness solutions, with platforms offering 24/7 gym accessibility seeing user adoption grow by 30% annually.
  • These tools are crucial in providing accessible fitness solutions that meet modern consumer demands for personalized, data-driven health and fitness experiences, improving member outcomes by as much as 40%.

What are the market trends shaping the Gym And Health Clubs Industry?

  • A significant market trend is the ascent of holistic wellness and integrated health offerings. This reflects a consumer shift toward comprehensive well-being that combines physical fitness with mental and emotional health.

  • The market is shifting toward holistic wellness hubs that prioritize mental well-being and community-driven fitness. This third space concept is exemplified by the rise of boutique fitness studios, which offer specialized instruction and community-centric workouts that foster loyalty. These facilities provide specialized fitness experiences and experiential fitness far beyond traditional gyms, with some reporting a 20% higher member engagement rate.
  • The integration of mindfulness classes and recovery therapies is now standard. Furthermore, the hybrid fitness model, which combines physical access with on-demand fitness content, has become essential, with operators seeing a 25% increase in retention among users who engage with both formats.

What challenges does the Gym And Health Clubs Industry face during its growth?

  • A significant challenge affecting industry growth is the intensifying competition from specialized boutique studios and accessible at-home digital fitness alternatives.

  • Intense competition from digital fitness platforms offering virtual personal training challenges traditional full-service health clubs. These platforms leverage asset-light business models and often provide a more customer-centric service at a lower cost. Simultaneously, both franchisee-owned stores and corporate-owned stores must contend with specialized studios offering high-intensity interval training or low-impact fitness solutions.
  • To compete, operators are enhancing member retention strategies by focusing on social connection and luxury fitness experiences. Diversifying through ancillary revenue streams has become critical, as facilities implementing such strategies report up to a 10% greater resilience against market fragmentation. The challenge lies in balancing operational costs with the need for continuous innovation.

Exclusive Technavio Analysis on Customer Landscape

The gym and health clubs market forecasting report includes the adoption lifecycle of the market, covering from the innovator’s stage to the laggard’s stage. It focuses on adoption rates in different regions based on penetration. Furthermore, the gym and health clubs market report also includes key purchase criteria and drivers of price sensitivity to help companies evaluate and develop their market growth analysis strategies.

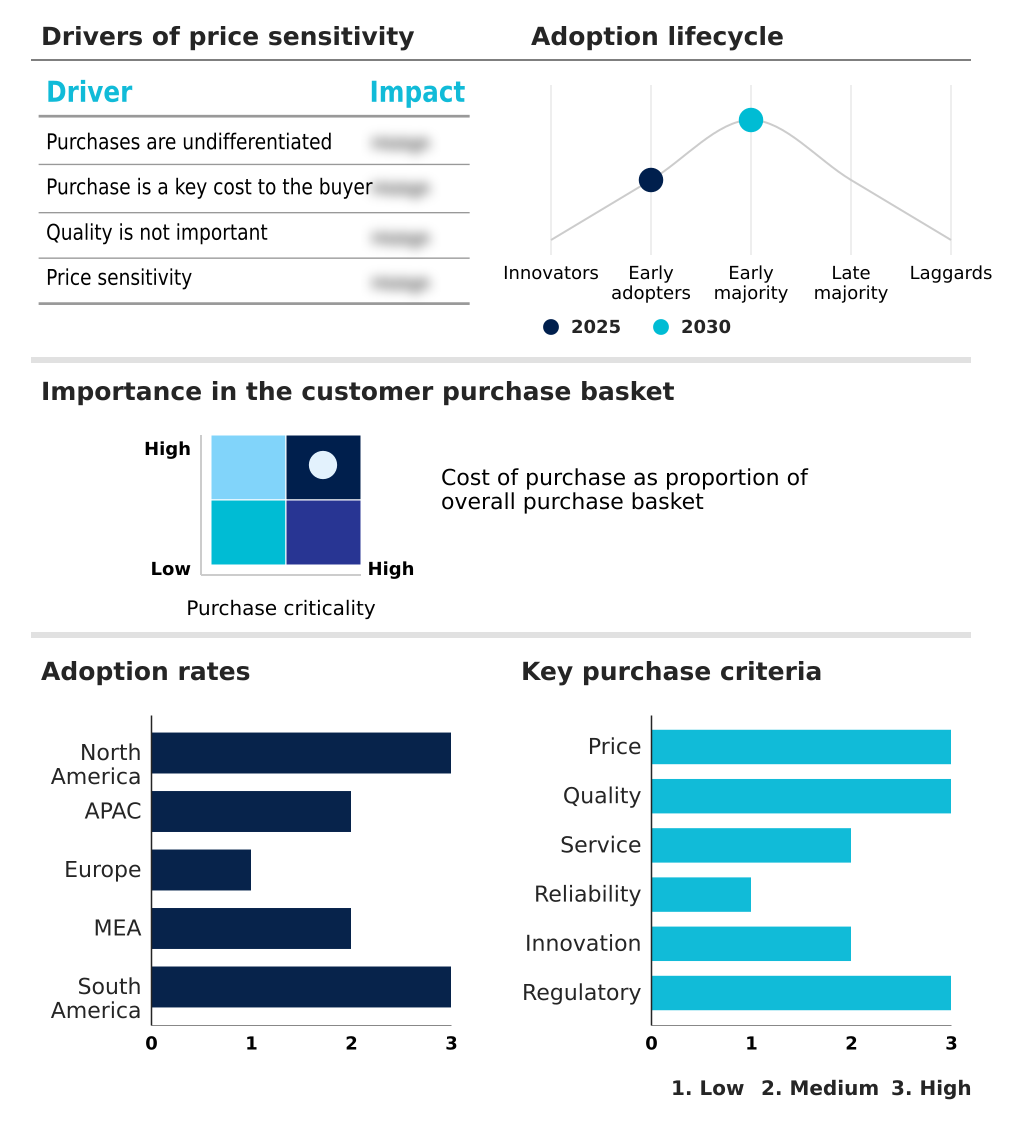
Customer Landscape of Gym And Health Clubs Industry

Competitive Landscape

Companies are implementing various strategies, such as strategic alliances, gym and health clubs market forecast, partnerships, mergers and acquisitions, geographical expansion, and product/service launches, to enhance their presence in the industry.

24 Hour Fitness USA LLC - Offering round-the-clock access and diverse fitness programming, these facilities cater to a broad range of user schedules and wellness goals through a comprehensive, accessible service model.

The industry research and growth report includes detailed analyses of the competitive landscape of the market and information about key companies, including:

  • 24 Hour Fitness USA LLC
  • Bev Francis Powerhouse Gym
  • Chelsea Piers LP
  • Crunch LLC
  • CureFit Healthcare Pvt. Ltd.
  • David Lloyd Leisure Ltd.
  • Equinox Holdings Inc.
  • Genesis Health Clubs
  • Life Time Inc.
  • Metroflex Gym
  • Planet Fitness Inc.
  • RSG Group GmbH
  • Self Esteem Brands LLC
  • Snap Fitness Inc
  • The Bay Clubs Co. LLC
  • The Club Co Ltd
  • Thor Fitness
  • UFC Gym
  • Virgin Active
  • Xsports Fitness

Qualitative and quantitative analysis of companies has been conducted to help clients understand the wider business environment as well as the strengths and weaknesses of key industry players. Data is qualitatively analyzed to categorize companies as pure play, category-focused, industry-focused, and diversified; it is quantitatively analyzed to categorize companies as dominant, leading, strong, tentative, and weak.

Recent Development and News in Gym and health clubs market

  • In September 2025, TDR Capital executed a significant recapitalization of David Lloyd Leisure, transferring ownership to a new investment vehicle to provide liquidity for accelerating its European expansion.
  • In March 2025, Vitality, a prominent European fitness chain, announced a strategic partnership with a leading mental wellness app to integrate guided meditations and stress-reduction exercises into member services.
  • In March 2025, a leading Egyptian telecommunications company formed a strategic partnership with a global fitness app, enabling the launch of integrated subscription packages for mobile customers.
  • In January 2025, Life Time Inc. launched its proprietary AI-powered digital coaching platform, which leverages data from member wearables to deliver hyper-personalized workout and nutrition plans.

Dive into Technavio’s robust research methodology, blending expert interviews, extensive data synthesis, and validated models for unparalleled Gym And Health Clubs Market insights. See full methodology.

Market Scope
Page number 286
Base year 2025
Historic period 2020-2024
Forecast period 2026-2030
Growth momentum & CAGR Accelerate at a CAGR of 6.1%
Market growth 2026-2030 USD 43886.5 million
Market structure Fragmented
YoY growth 2025-2026(%) 5.7%
Key countries US, Canada, Mexico, China, Japan, India, Australia, South Korea, Indonesia, Germany, UK, France, Italy, Spain, The Netherlands, South Africa, UAE, Saudi Arabia, Egypt, Israel, Brazil, Argentina and Colombia
Competitive landscape Leading Companies, Market Positioning of Companies, Competitive Strategies, and Industry Risks

Request Free Sample

Research Analyst Overview

  • The market's evolution is marked by a pivot to preventative healthcare measures and medical wellness services. Full-service health clubs and boutique fitness studios are now integrating everything from high-intensity interval training to low-impact fitness solutions and mindfulness classes. Boardroom decisions are increasingly focused on technology investment, particularly in gym management software for member administration and ai-powered coaching platforms.
  • The rollout of smart fitness equipment and wearable technology integration provides the biometric feedback necessary for a truly data-driven approach. This focus on personalized workout plans is critical for retention. Facilities offering glp-1 companion programs and nutritional counseling are seeing member goal achievement rates improve by up to 30%.
  • The rise of digital fitness platforms offering on-demand fitness content has forced a hybrid fitness model. Operators, from franchisee-owned stores to corporate-owned stores, are diversifying revenue with personal training fees and specialized recovery therapies like cryotherapy, infrared saunas, and assisted stretching, while group exercise studios foster community-centric workouts.

What are the Key Data Covered in this Gym And Health Clubs Market Research and Growth Report?

  • What is the expected growth of the Gym And Health Clubs Market between 2026 and 2030?

    • USD 43.89 billion, at a CAGR of 6.1%

  • What segmentation does the market report cover?

    • The report is segmented by Service (Membership fees, Personal training and instruction fees, and Total admission fees), Type (Private, and Public), End-user (Individuals, and Corporates) and Geography (North America, APAC, Europe, Middle East and Africa, South America)

  • Which regions are analyzed in the report?

    • North America, APAC, Europe, Middle East and Africa and South America

  • What are the key growth drivers and market challenges?

    • Increasing health and wellness consciousness for consumers, Intensifying competition from niche studios

  • Who are the major players in the Gym And Health Clubs Market?

    • 24 Hour Fitness USA LLC, Bev Francis Powerhouse Gym, Chelsea Piers LP, Crunch LLC, CureFit Healthcare Pvt. Ltd., David Lloyd Leisure Ltd., Equinox Holdings Inc., Genesis Health Clubs, Life Time Inc., Metroflex Gym, Planet Fitness Inc., RSG Group GmbH, Self Esteem Brands LLC, Snap Fitness Inc, The Bay Clubs Co. LLC, The Club Co Ltd, Thor Fitness, UFC Gym, Virgin Active and Xsports Fitness

Market Research Insights

  • Market dynamics are shifting from volume-driven acquisition to value-driven retention, with operators becoming holistic wellness hubs. This customer-centric service model offers integrated health offerings, specialized fitness experiences, and experiential fitness to foster social connection and mental well-being. Premium fitness facilities deliver luxury fitness experiences, while the high-value low-price segment provides accessible fitness solutions.
  • Adopting flexible payment options and family-oriented fitness plans improves member retention strategies, increasing loyalty by 15%. Corporate partnership programs act as a key customer acquisition channel. To boost operational efficiency, clubs use ancillary revenue streams and asset-light business models.
  • Convenient fitness solutions like 24/7 gym accessibility and a focus on physical recovery drive data-informed member engagement, solidifying the gym as a third space concept for preventative health management and community-driven fitness with round-the-clock access.

We can help! Our analysts can customize this gym and health clubs market research report to meet your requirements.

Get in touch

1. Executive Summary

1.1 Market overview

Executive Summary - Chart on Market Overview
Executive Summary - Data Table on Market Overview
Executive Summary - Chart on Global Market Characteristics
Executive Summary - Chart on Market by Geography
Executive Summary - Chart on Market Segmentation by Service
Executive Summary - Chart on Market Segmentation by Type
Executive Summary - Chart on Market Segmentation by End-user
Executive Summary - Chart on Incremental Growth
Executive Summary - Data Table on Incremental Growth
Executive Summary - Chart on Company Market Positioning

2. Technavio Analysis

2.1 Analysis of price sensitivity, lifecycle, customer purchase basket, adoption rates, and purchase criteria

2.2 Criticality of inputs and Factors of differentiation

Chart on Overview on criticality of inputs and factors of differentiation

2.3 Factors of disruption

Chart on Overview on factors of disruption

2.4 Impact of drivers and challenges

Chart on Impact of drivers and challenges in 2025 and 2030

3. Market Landscape

3.1 Market ecosystem

Chart on Parent Market
Data Table on - Parent Market

3.2 Market characteristics

Chart on Market characteristics analysis

3.3 Value chain analysis

Chart on Value chain analysis

4. Market Sizing

4.1 Market definition

Data Table on Offerings of companies included in the market definition

4.2 Market segment analysis

Market segments

4.3 Market size 2025

4.4 Market outlook: Forecast for 2025-2030

Chart on Global - Market size and forecast 2025-2030 ($ million)
Data Table on Global - Market size and forecast 2025-2030 ($ million)
Chart on Global Market: Year-over-year growth 2025-2030 (%)
Data Table on Global Market: Year-over-year growth 2025-2030 (%)

5. Historic Market Size

5.1 Global Gym And Health Clubs Market 2020 - 2024

Historic Market Size - Data Table on Global Gym And Health Clubs Market 2020 - 2024 ($ million)

5.2 Service segment analysis 2020 - 2024

Historic Market Size - Service Segment 2020 - 2024 ($ million)

5.3 Type segment analysis 2020 - 2024

Historic Market Size - Type Segment 2020 - 2024 ($ million)

5.4 End-user segment analysis 2020 - 2024

Historic Market Size - End-user Segment 2020 - 2024 ($ million)

5.5 Geography segment analysis 2020 - 2024

Historic Market Size - Geography Segment 2020 - 2024 ($ million)

5.6 Country segment analysis 2020 - 2024

Historic Market Size - Country Segment 2020 - 2024 ($ million)

6. Qualitative Analysis

6.1 Impact of AI in global gym and health clubs market

7. Five Forces Analysis

7.1 Five forces summary

Five forces analysis - Comparison between 2025 and 2030

7.2 Bargaining power of buyers

Bargaining power of buyers - Impact of key factors 2025 and 2030

7.3 Bargaining power of suppliers

Bargaining power of suppliers - Impact of key factors in 2025 and 2030

7.4 Threat of new entrants

Threat of new entrants - Impact of key factors in 2025 and 2030

7.5 Threat of substitutes

Threat of substitutes - Impact of key factors in 2025 and 2030

7.6 Threat of rivalry

Threat of rivalry - Impact of key factors in 2025 and 2030

7.7 Market condition

Chart on Market condition - Five forces 2025 and 2030

8. Market Segmentation by Service

8.1 Market segments

Chart on Service - Market share 2025-2030 (%)
Data Table on Service - Market share 2025-2030 (%)

8.2 Comparison by Service

Chart on Comparison by Service
Data Table on Comparison by Service

8.3 Membership fees - Market size and forecast 2025-2030

Chart on Membership fees - Market size and forecast 2025-2030 ($ million)
Data Table on Membership fees - Market size and forecast 2025-2030 ($ million)
Chart on Membership fees - Year-over-year growth 2025-2030 (%)
Data Table on Membership fees - Year-over-year growth 2025-2030 (%)

8.4 Personal training and instruction fees - Market size and forecast 2025-2030

Chart on Personal training and instruction fees - Market size and forecast 2025-2030 ($ million)
Data Table on Personal training and instruction fees - Market size and forecast 2025-2030 ($ million)
Chart on Personal training and instruction fees - Year-over-year growth 2025-2030 (%)
Data Table on Personal training and instruction fees - Year-over-year growth 2025-2030 (%)

8.5 Total admission fees - Market size and forecast 2025-2030

Chart on Total admission fees - Market size and forecast 2025-2030 ($ million)
Data Table on Total admission fees - Market size and forecast 2025-2030 ($ million)
Chart on Total admission fees - Year-over-year growth 2025-2030 (%)
Data Table on Total admission fees - Year-over-year growth 2025-2030 (%)

8.6 Market opportunity by Service

Market opportunity by Service ($ million)
Data Table on Market opportunity by Service ($ million)

9. Market Segmentation by Type

9.1 Market segments

Chart on Type - Market share 2025-2030 (%)
Data Table on Type - Market share 2025-2030 (%)

9.2 Comparison by Type

Chart on Comparison by Type
Data Table on Comparison by Type

9.3 Private - Market size and forecast 2025-2030

Chart on Private - Market size and forecast 2025-2030 ($ million)
Data Table on Private - Market size and forecast 2025-2030 ($ million)
Chart on Private - Year-over-year growth 2025-2030 (%)
Data Table on Private - Year-over-year growth 2025-2030 (%)

9.4 Public - Market size and forecast 2025-2030

Chart on Public - Market size and forecast 2025-2030 ($ million)
Data Table on Public - Market size and forecast 2025-2030 ($ million)
Chart on Public - Year-over-year growth 2025-2030 (%)
Data Table on Public - Year-over-year growth 2025-2030 (%)

9.5 Market opportunity by Type

Market opportunity by Type ($ million)
Data Table on Market opportunity by Type ($ million)

10. Market Segmentation by End-user

10.1 Market segments

Chart on End-user - Market share 2025-2030 (%)
Data Table on End-user - Market share 2025-2030 (%)

10.2 Comparison by End-user

Chart on Comparison by End-user
Data Table on Comparison by End-user

10.3 Individuals - Market size and forecast 2025-2030

Chart on Individuals - Market size and forecast 2025-2030 ($ million)
Data Table on Individuals - Market size and forecast 2025-2030 ($ million)
Chart on Individuals - Year-over-year growth 2025-2030 (%)
Data Table on Individuals - Year-over-year growth 2025-2030 (%)

10.4 Corporates - Market size and forecast 2025-2030

Chart on Corporates - Market size and forecast 2025-2030 ($ million)
Data Table on Corporates - Market size and forecast 2025-2030 ($ million)
Chart on Corporates - Year-over-year growth 2025-2030 (%)
Data Table on Corporates - Year-over-year growth 2025-2030 (%)

10.5 Market opportunity by End-user

Market opportunity by End-user ($ million)
Data Table on Market opportunity by End-user ($ million)

11. Customer Landscape

11.1 Customer landscape overview

Analysis of price sensitivity, lifecycle, customer purchase basket, adoption rates, and purchase criteria

12. Geographic Landscape

12.1 Geographic segmentation

Chart on Market share by geography 2025-2030 (%)
Data Table on Market share by geography 2025-2030 (%)

12.2 Geographic comparison

Chart on Geographic comparison
Data Table on Geographic comparison

12.3 North America - Market size and forecast 2025-2030

Chart on North America - Market size and forecast 2025-2030 ($ million)
Data Table on North America - Market size and forecast 2025-2030 ($ million)
Chart on North America - Year-over-year growth 2025-2030 (%)
Data Table on North America - Year-over-year growth 2025-2030 (%)
Chart on Regional Comparison - North America
Data Table on Regional Comparison - North America

12.3.1 US - Market size and forecast 2025-2030

Chart on US - Market size and forecast 2025-2030 ($ million)
Data Table on US - Market size and forecast 2025-2030 ($ million)
Chart on US - Year-over-year growth 2025-2030 (%)
Data Table on US - Year-over-year growth 2025-2030 (%)

12.3.2 Canada - Market size and forecast 2025-2030

Chart on Canada - Market size and forecast 2025-2030 ($ million)
Data Table on Canada - Market size and forecast 2025-2030 ($ million)
Chart on Canada - Year-over-year growth 2025-2030 (%)
Data Table on Canada - Year-over-year growth 2025-2030 (%)

12.3.3 Mexico - Market size and forecast 2025-2030

Chart on Mexico - Market size and forecast 2025-2030 ($ million)
Data Table on Mexico - Market size and forecast 2025-2030 ($ million)
Chart on Mexico - Year-over-year growth 2025-2030 (%)
Data Table on Mexico - Year-over-year growth 2025-2030 (%)

12.4 APAC - Market size and forecast 2025-2030

Chart on APAC - Market size and forecast 2025-2030 ($ million)
Data Table on APAC - Market size and forecast 2025-2030 ($ million)
Chart on APAC - Year-over-year growth 2025-2030 (%)
Data Table on APAC - Year-over-year growth 2025-2030 (%)
Chart on Regional Comparison - APAC
Data Table on Regional Comparison - APAC

12.4.1 China - Market size and forecast 2025-2030

Chart on China - Market size and forecast 2025-2030 ($ million)
Data Table on China - Market size and forecast 2025-2030 ($ million)
Chart on China - Year-over-year growth 2025-2030 (%)
Data Table on China - Year-over-year growth 2025-2030 (%)

12.4.2 Japan - Market size and forecast 2025-2030

Chart on Japan - Market size and forecast 2025-2030 ($ million)
Data Table on Japan - Market size and forecast 2025-2030 ($ million)
Chart on Japan - Year-over-year growth 2025-2030 (%)
Data Table on Japan - Year-over-year growth 2025-2030 (%)

12.4.3 India - Market size and forecast 2025-2030

Chart on India - Market size and forecast 2025-2030 ($ million)
Data Table on India - Market size and forecast 2025-2030 ($ million)
Chart on India - Year-over-year growth 2025-2030 (%)
Data Table on India - Year-over-year growth 2025-2030 (%)

12.4.4 Australia - Market size and forecast 2025-2030

Chart on Australia - Market size and forecast 2025-2030 ($ million)
Data Table on Australia - Market size and forecast 2025-2030 ($ million)
Chart on Australia - Year-over-year growth 2025-2030 (%)
Data Table on Australia - Year-over-year growth 2025-2030 (%)

12.4.5 South Korea - Market size and forecast 2025-2030

Chart on South Korea - Market size and forecast 2025-2030 ($ million)
Data Table on South Korea - Market size and forecast 2025-2030 ($ million)
Chart on South Korea - Year-over-year growth 2025-2030 (%)
Data Table on South Korea - Year-over-year growth 2025-2030 (%)

12.4.6 Indonesia - Market size and forecast 2025-2030

Chart on Indonesia - Market size and forecast 2025-2030 ($ million)
Data Table on Indonesia - Market size and forecast 2025-2030 ($ million)
Chart on Indonesia - Year-over-year growth 2025-2030 (%)
Data Table on Indonesia - Year-over-year growth 2025-2030 (%)

12.5 Europe - Market size and forecast 2025-2030

Chart on Europe - Market size and forecast 2025-2030 ($ million)
Data Table on Europe - Market size and forecast 2025-2030 ($ million)
Chart on Europe - Year-over-year growth 2025-2030 (%)
Data Table on Europe - Year-over-year growth 2025-2030 (%)
Chart on Regional Comparison - Europe
Data Table on Regional Comparison - Europe

12.5.1 Germany - Market size and forecast 2025-2030

Chart on Germany - Market size and forecast 2025-2030 ($ million)
Data Table on Germany - Market size and forecast 2025-2030 ($ million)
Chart on Germany - Year-over-year growth 2025-2030 (%)
Data Table on Germany - Year-over-year growth 2025-2030 (%)

12.5.2 UK - Market size and forecast 2025-2030

Chart on UK - Market size and forecast 2025-2030 ($ million)
Data Table on UK - Market size and forecast 2025-2030 ($ million)
Chart on UK - Year-over-year growth 2025-2030 (%)
Data Table on UK - Year-over-year growth 2025-2030 (%)

12.5.3 France - Market size and forecast 2025-2030

Chart on France - Market size and forecast 2025-2030 ($ million)
Data Table on France - Market size and forecast 2025-2030 ($ million)
Chart on France - Year-over-year growth 2025-2030 (%)
Data Table on France - Year-over-year growth 2025-2030 (%)

12.5.4 Italy - Market size and forecast 2025-2030

Chart on Italy - Market size and forecast 2025-2030 ($ million)
Data Table on Italy - Market size and forecast 2025-2030 ($ million)
Chart on Italy - Year-over-year growth 2025-2030 (%)
Data Table on Italy - Year-over-year growth 2025-2030 (%)

12.5.5 Spain - Market size and forecast 2025-2030

Chart on Spain - Market size and forecast 2025-2030 ($ million)
Data Table on Spain - Market size and forecast 2025-2030 ($ million)
Chart on Spain - Year-over-year growth 2025-2030 (%)
Data Table on Spain - Year-over-year growth 2025-2030 (%)

12.5.6 The Netherlands - Market size and forecast 2025-2030

Chart on The Netherlands - Market size and forecast 2025-2030 ($ million)
Data Table on The Netherlands - Market size and forecast 2025-2030 ($ million)
Chart on The Netherlands - Year-over-year growth 2025-2030 (%)
Data Table on The Netherlands - Year-over-year growth 2025-2030 (%)

12.6 Middle East and Africa - Market size and forecast 2025-2030

Chart on Middle East and Africa - Market size and forecast 2025-2030 ($ million)
Data Table on Middle East and Africa - Market size and forecast 2025-2030 ($ million)
Chart on Middle East and Africa - Year-over-year growth 2025-2030 (%)
Data Table on Middle East and Africa - Year-over-year growth 2025-2030 (%)
Chart on Regional Comparison - Middle East and Africa
Data Table on Regional Comparison - Middle East and Africa

12.6.1 South Africa - Market size and forecast 2025-2030

Chart on South Africa - Market size and forecast 2025-2030 ($ million)
Data Table on South Africa - Market size and forecast 2025-2030 ($ million)
Chart on South Africa - Year-over-year growth 2025-2030 (%)
Data Table on South Africa - Year-over-year growth 2025-2030 (%)

12.6.2 UAE - Market size and forecast 2025-2030

Chart on UAE - Market size and forecast 2025-2030 ($ million)
Data Table on UAE - Market size and forecast 2025-2030 ($ million)
Chart on UAE - Year-over-year growth 2025-2030 (%)
Data Table on UAE - Year-over-year growth 2025-2030 (%)

12.6.3 Saudi Arabia - Market size and forecast 2025-2030

Chart on Saudi Arabia - Market size and forecast 2025-2030 ($ million)
Data Table on Saudi Arabia - Market size and forecast 2025-2030 ($ million)
Chart on Saudi Arabia - Year-over-year growth 2025-2030 (%)
Data Table on Saudi Arabia - Year-over-year growth 2025-2030 (%)

12.6.4 Egypt - Market size and forecast 2025-2030

Chart on Egypt - Market size and forecast 2025-2030 ($ million)
Data Table on Egypt - Market size and forecast 2025-2030 ($ million)
Chart on Egypt - Year-over-year growth 2025-2030 (%)
Data Table on Egypt - Year-over-year growth 2025-2030 (%)

12.6.5 Israel - Market size and forecast 2025-2030

Chart on Israel - Market size and forecast 2025-2030 ($ million)
Data Table on Israel - Market size and forecast 2025-2030 ($ million)
Chart on Israel - Year-over-year growth 2025-2030 (%)
Data Table on Israel - Year-over-year growth 2025-2030 (%)

12.7 South America - Market size and forecast 2025-2030

Chart on South America - Market size and forecast 2025-2030 ($ million)
Data Table on South America - Market size and forecast 2025-2030 ($ million)
Chart on South America - Year-over-year growth 2025-2030 (%)
Data Table on South America - Year-over-year growth 2025-2030 (%)
Chart on Regional Comparison - South America
Data Table on Regional Comparison - South America

12.7.1 Brazil - Market size and forecast 2025-2030

Chart on Brazil - Market size and forecast 2025-2030 ($ million)
Data Table on Brazil - Market size and forecast 2025-2030 ($ million)
Chart on Brazil - Year-over-year growth 2025-2030 (%)
Data Table on Brazil - Year-over-year growth 2025-2030 (%)

12.7.2 Argentina - Market size and forecast 2025-2030

Chart on Argentina - Market size and forecast 2025-2030 ($ million)
Data Table on Argentina - Market size and forecast 2025-2030 ($ million)
Chart on Argentina - Year-over-year growth 2025-2030 (%)
Data Table on Argentina - Year-over-year growth 2025-2030 (%)

12.7.3 Colombia - Market size and forecast 2025-2030

Chart on Colombia - Market size and forecast 2025-2030 ($ million)
Data Table on Colombia - Market size and forecast 2025-2030 ($ million)
Chart on Colombia - Year-over-year growth 2025-2030 (%)
Data Table on Colombia - Year-over-year growth 2025-2030 (%)

12.8 Market opportunity by geography

Market opportunity by geography ($ million)
Data Tables on Market opportunity by geography ($ million)

13. Drivers, Challenges, and Opportunity

13.1 Market drivers

Increasing health and wellness consciousness for consumers
Integration of technology and digital fitness
Expansion of corporate wellness initiatives in health sector

13.2 Market challenges

Intensifying competition from niche studios
Rising operational costs and pressure gym and health clubs
Evolving consumer preferences and demand for personalization

13.3 Impact of drivers and challenges

Impact of drivers and challenges in 2025 and 2030

13.4 Market opportunities

Ascent of holistic wellness and integrated health offerings
Hyper-personalization through technology and data analytics
Rise of boutique studios and specialized fitness experiences

14. Competitive Landscape

14.1 Overview

14.2

Overview on criticality of inputs and factors of differentiation

14.3 Landscape disruption

Overview on factors of disruption

14.4 Industry risks

Impact of key risks on business

15. Competitive Analysis

15.1 Companies profiled

Companies covered

15.2 Company ranking index

15.3 Market positioning of companies

Matrix on companies position and classification

15.4 24 Hour Fitness USA LLC

24 Hour Fitness USA LLC - Overview
24 Hour Fitness USA LLC - Product / Service
24 Hour Fitness USA LLC - Key offerings
SWOT

15.5 Bev Francis Powerhouse Gym

Bev Francis Powerhouse Gym - Overview
Bev Francis Powerhouse Gym - Product / Service
Bev Francis Powerhouse Gym - Key offerings
SWOT

15.6 Chelsea Piers LP

Chelsea Piers LP - Overview
Chelsea Piers LP - Product / Service
Chelsea Piers LP - Key offerings
SWOT

15.7 Crunch LLC

Crunch LLC - Overview
Crunch LLC - Product / Service
Crunch LLC - Key offerings
SWOT

15.8 CureFit Healthcare Pvt. Ltd.

CureFit Healthcare Pvt. Ltd. - Overview
CureFit Healthcare Pvt. Ltd. - Product / Service
CureFit Healthcare Pvt. Ltd. - Key offerings
SWOT

15.9 David Lloyd Leisure Ltd.

David Lloyd Leisure Ltd. - Overview
David Lloyd Leisure Ltd. - Product / Service
David Lloyd Leisure Ltd. - Key offerings
SWOT

15.10 Equinox Holdings Inc.

Equinox Holdings Inc. - Overview
Equinox Holdings Inc. - Product / Service
Equinox Holdings Inc. - Key offerings
SWOT

15.11 Genesis Health Clubs

Genesis Health Clubs - Overview
Genesis Health Clubs - Product / Service
Genesis Health Clubs - Key offerings
SWOT

15.12 Life Time Inc.

Life Time Inc. - Overview
Life Time Inc. - Product / Service
Life Time Inc. - Key offerings
SWOT

15.13 Metroflex Gym

Metroflex Gym - Overview
Metroflex Gym - Product / Service
Metroflex Gym - Key offerings
SWOT

15.14 Planet Fitness Inc.

Planet Fitness Inc. - Overview
Planet Fitness Inc. - Business segments
Planet Fitness Inc. - Key offerings
Planet Fitness Inc. - Segment focus
SWOT

15.15 RSG Group GmbH

RSG Group GmbH - Overview
RSG Group GmbH - Product / Service
RSG Group GmbH - Key offerings
SWOT

15.16 Self Esteem Brands LLC

Self Esteem Brands LLC - Overview
Self Esteem Brands LLC - Product / Service
Self Esteem Brands LLC - Key offerings
SWOT

15.17 Snap Fitness Inc

Snap Fitness Inc - Overview
Snap Fitness Inc - Product / Service
Snap Fitness Inc - Key offerings
SWOT

15.18 The Bay Clubs Co. LLC

The Bay Clubs Co. LLC - Overview
The Bay Clubs Co. LLC - Product / Service
The Bay Clubs Co. LLC - Key offerings
SWOT

16. Appendix

16.1 Scope of the report

Market definition
Objectives
Notes and caveats

16.2 Inclusions and exclusions checklist

Inclusions checklist
Exclusions checklist

16.3 Currency conversion rates for US$

16.4 Research methodology

16.5 Data procurement

Information sources

16.6 Data validation

16.7 Validation techniques employed for market sizing

16.8 Data synthesis

16.9 360 degree market analysis

16.10 List of abbreviations

Research Methodology

Technavio presents a detailed picture of the market by way of study, synthesis, and summation of data from multiple sources. The analysts have presented the various facets of the market with a particular focus on identifying the key industry influencers. The data thus presented is comprehensive, reliable, and the result of extensive research, both primary and secondary.

INFORMATION SOURCES

Primary sources

  • Manufacturers and suppliers
  • Channel partners
  • Industry experts
  • Strategic decision makers

Secondary sources

  • Industry journals and periodicals
  • Government data
  • Financial reports of key industry players
  • Historical data
  • Press releases

DATA ANALYSIS

Data Synthesis

  • Collation of data
  • Estimation of key figures
  • Analysis of derived insights

Data Validation

  • Triangulation with data models
  • Reference against proprietary databases
  • Corroboration with industry experts

REPORT WRITING

Qualitative

  • Market drivers
  • Market challenges
  • Market trends
  • Five forces analysis

Quantitative

  • Market size and forecast
  • Market segmentation
  • Geographical insights
  • Competitive landscape

Interested in this report?

Get your sample now to see our research methodology and insights!

Download Now

Frequently Asked Questions

Gym And Health Clubs market growth will increase by USD 43886.5 million during 2026-2030.

The Gym And Health Clubs market is expected to grow at a CAGR of 6.1% during 2026-2030.

Gym And Health Clubs market is segmented by Service (Membership fees, Personal training and instruction fees, Total admission fees) Type (Private, Public) End-user (Individuals, Corporates)

24 Hour Fitness USA LLC, Bev Francis Powerhouse Gym, Chelsea Piers LP, Crunch LLC, CureFit Healthcare Pvt. Ltd., David Lloyd Leisure Ltd., Equinox Holdings Inc., Genesis Health Clubs, Life Time Inc., Metroflex Gym, Planet Fitness Inc., RSG Group GmbH, Self Esteem Brands LLC, Snap Fitness Inc, The Bay Clubs Co. LLC, The Club Co Ltd, Thor Fitness, UFC Gym, Virgin Active, Xsports Fitness are a few of the key vendors in the Gym And Health Clubs market.

North America will register the highest growth rate of 40.5% among the other regions. Therefore, the Gym And Health Clubs market in North America is expected to garner significant business opportunities for the vendors during the forecast period.

US, Canada, Mexico, China, Japan, India, Australia, South Korea, Indonesia, Germany, UK, France, Italy, Spain, The Netherlands, South Africa, UAE, Saudi Arabia, Egypt, Israel, Brazil, Argentina, Colombia

  • Increasing health and wellness consciousness for consumers is the driving factor this market.

The Gym And Health Clubs market vendors should focus on grabbing business opportunities from the Service segment as it accounted for the largest market share in the base year.