Hazardous Waste Handling Automation Market Analysis, Size, and Forecast 2026-2030: APAC (China, India, and Japan), North America (US, Canada, and Mexico), Europe (Germany, UK, and France), South America (Brazil and Argentina), Middle East and Africa (Saudi Arabia, UAE, and South Africa), and Rest of World (ROW)

Hazardous Waste Handling Automation Market Analysis, Size, and Forecast 2026-2030:
APAC (China, India, and Japan), North America (US, Canada, and Mexico), Europe (Germany, UK, and France), South America (Brazil and Argentina), Middle East and Africa (Saudi Arabia, UAE, and South Africa), and Rest of World (ROW)

Published: Jan 2026 310 Pages SKU: IRTNTR72584

Market Overview at a Glance

$9.44 B
Market Opportunity
7.7%
CAGR 2025 - 2030
48.6%
APAC Growth
$16.24 B
Industries segment 2024

Hazardous Waste Handling Automation Market Size 2026-2030

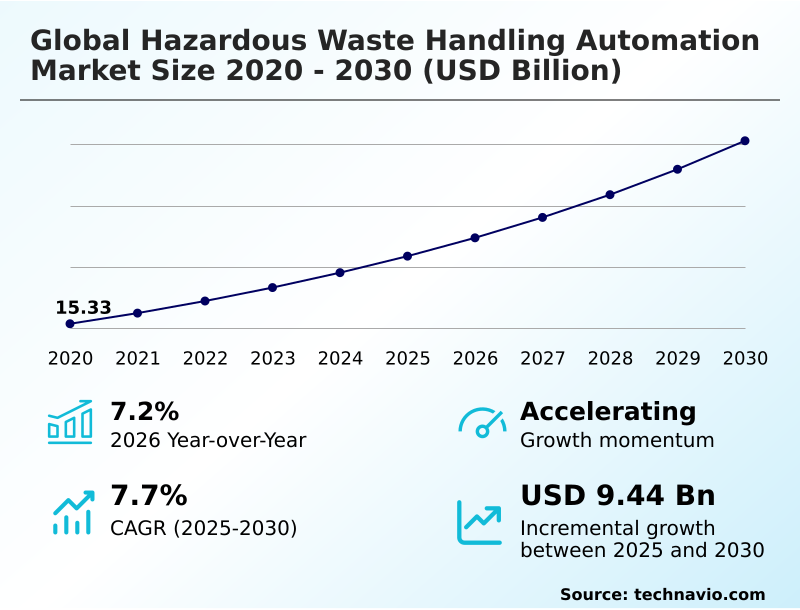
The hazardous waste handling automation market size is valued to increase by USD 9.44 billion, at a CAGR of 7.7% from 2025 to 2030. Technological advancements in automation and AI will drive the hazardous waste handling automation market.

Major Market Trends & Insights

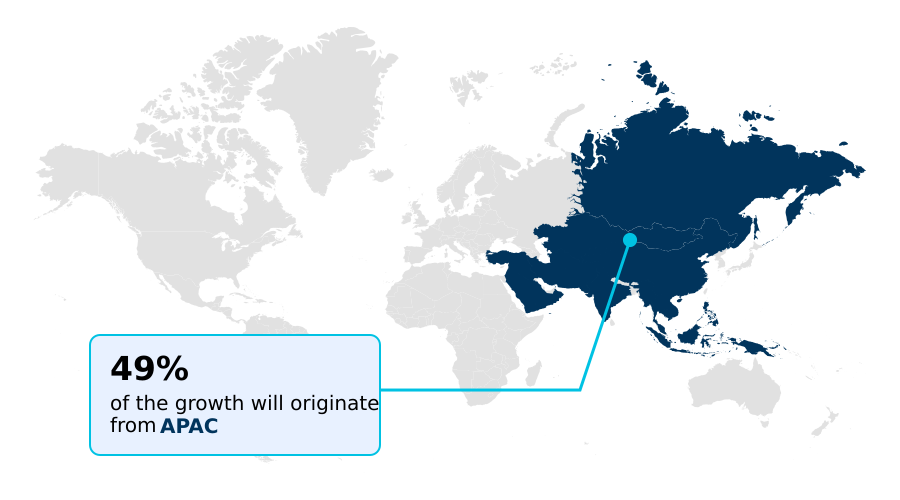
  • APAC dominated the market and accounted for a 48.6% growth during the forecast period.
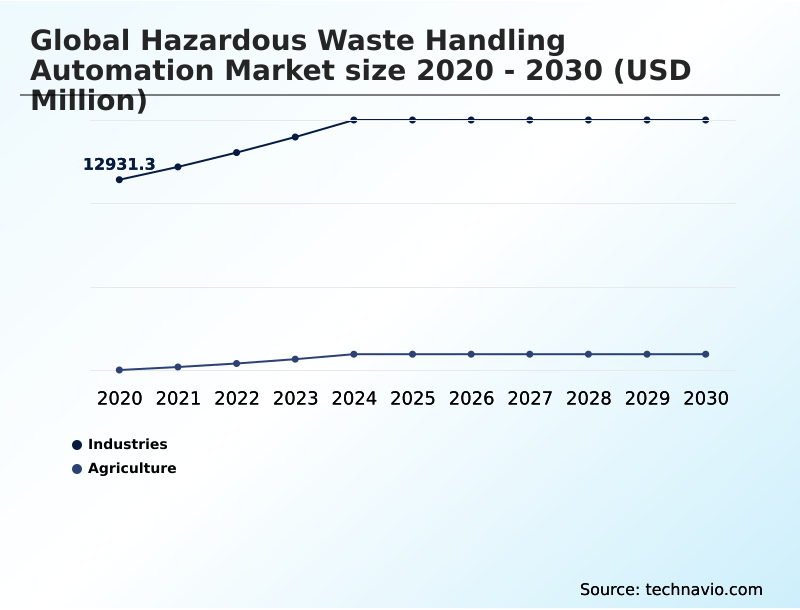
  • By Application - Industries segment was valued at USD 16.24 billion in 2024
  • By Component - Hardware segment accounted for the largest market revenue share in 2024

Market Size & Forecast

  • Market Opportunities: USD 14.97 billion
  • Market Future Opportunities: USD 9.44 billion
  • CAGR from 2025 to 2030 : 7.7%

Market Summary

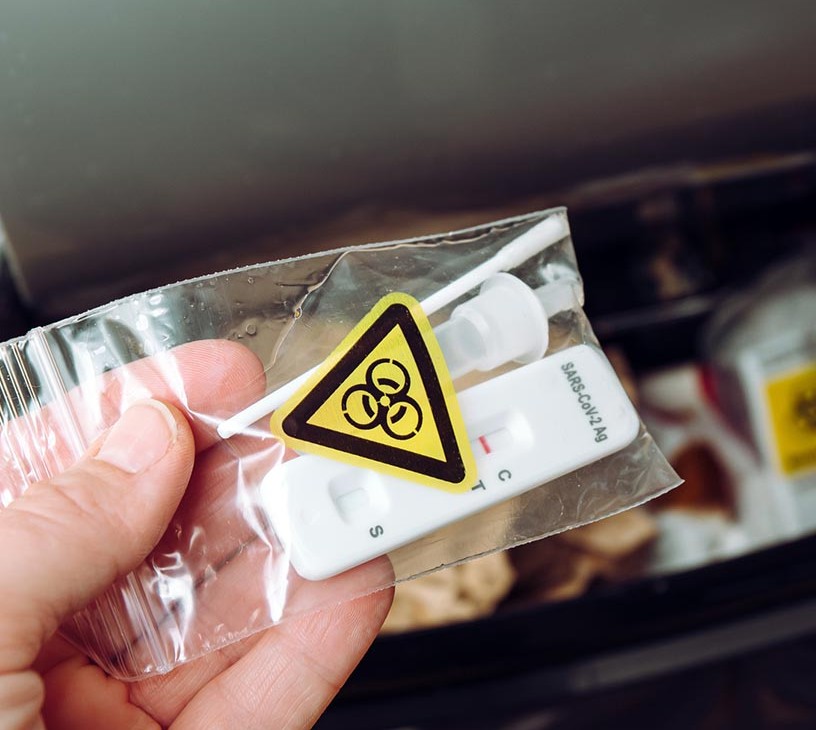
  • The hazardous waste handling automation market is defined by a decisive shift from manual labor to sophisticated technological systems, driven by stringent safety regulations and the pursuit of operational excellence. This transition involves the deployment of robotic sorting of hazardous waste and remote-controlled technologies to manage toxic, radioactive, and infectious materials, thereby minimizing human exposure and ensuring environmental compliance automation.
  • In a typical industrial byproduct management scenario, a chemical plant might utilize robotic sorting arms equipped with chemical resistant robotics to segregate corrosive materials, while radiation-hardened sensors provide real-time data for automated containment solutions. This approach not only enhances worker safety in hazardous environments but also improves the precision and efficiency of waste processing.
  • The integration of AI-powered analytics and machine vision systems further enables predictive maintenance and optimizes waste stream workflows, making automation a cornerstone of modern, sustainable disposal strategies. As industries worldwide prioritize risk mitigation and resource recovery from waste, the demand for integrated, intelligent automation continues to accelerate, reshaping the landscape of high-risk material handling.

What will be the Size of the Hazardous Waste Handling Automation Market during the forecast period?

Get Key Insights on Market Forecast (PDF) Request Free Sample

How is the Hazardous Waste Handling Automation Market Segmented?

The hazardous waste handling automation industry research report provides comprehensive data (region-wise segment analysis), with forecasts and estimates in "USD million" for the period 2026-2030, as well as historical data from 2020-2024 for the following segments.

  • Application
    • Industries
    • Agriculture
  • Component
    • Hardware
    • Software
    • Services
  • Category
    • Solid
    • Liquid
    • Gaseous
  • Product
    • Manipulator arms
    • Cranes
    • Trusses
    • Others
  • Geography
    • APAC
      • China
      • India
      • Japan
    • North America
      • US
      • Canada
      • Mexico
    • Europe
      • Germany
      • UK
      • France
    • South America
      • Brazil
      • Argentina
    • Middle East and Africa
      • Saudi Arabia
      • UAE
      • South Africa
    • Rest of World (ROW)

By Application Insights

The industries segment is estimated to witness significant growth during the forecast period.

The industrial sector's adoption of hazardous waste handling automation is driven by the need to manage toxic byproducts from manufacturing, chemical processing, and energy generation.

As industries integrate Industry 4.0 principles, the use of robotic cell integration and automated decontamination robots becomes essential for meeting stringent environmental regulations.

Facilities handling radioactive materials and chemical sludge rely on remote handling systems and automated material recovery to mitigate risks associated with manual intervention.

This includes the use of autonomous sorting and segregation technologies, which improve material recovery rates by over 15%.

This strategic shift toward smart waste infrastructure, driven by a focus on sustainable disposal strategies and operational efficiency in waste management, underscores the sector's commitment to advanced automation for worker safety in hazardous environments.

Request Free Sample

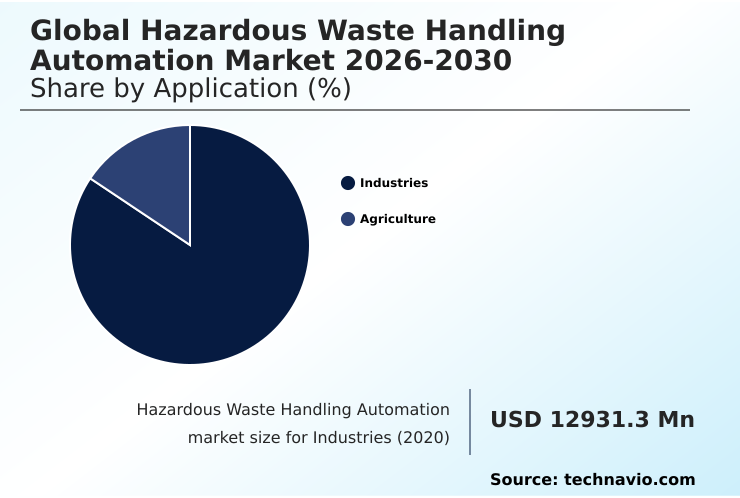
The Industries segment was valued at USD 16.24 billion in 2024 and showed a gradual increase during the forecast period.

Request Free Sample

Regional Analysis

APAC is estimated to contribute 48.6% to the growth of the global market during the forecast period.Technavio’s analysts have elaborately explained the regional trends and drivers that shape the market during the forecast period.

See How Hazardous Waste Handling Automation Market Demand is Rising in APAC Request Free Sample

The geographic landscape is prominently shaped by APAC, which accounts for over 48% of the market's incremental growth opportunity.

This expansion is driven by rapid industrialization and stringent environmental mandates in countries like China and India, compelling industries to adopt automated waste treatment systems.

Japan's leadership in robotics is critical, where an aging workforce necessitates the deployment of remote-controlled technologies and tele-operated manipulators, particularly for nuclear decommissioning robotics and managing radioactive waste processing.

The adoption of robotic waste compaction and automated autoclaving systems in the region's expanding healthcare sector further fuels demand.

As a result, the convergence of regulatory pressure and technological innovation for biohazardous substance control and infectious waste disposal automation solidifies APAC's position as the primary engine of global market growth.
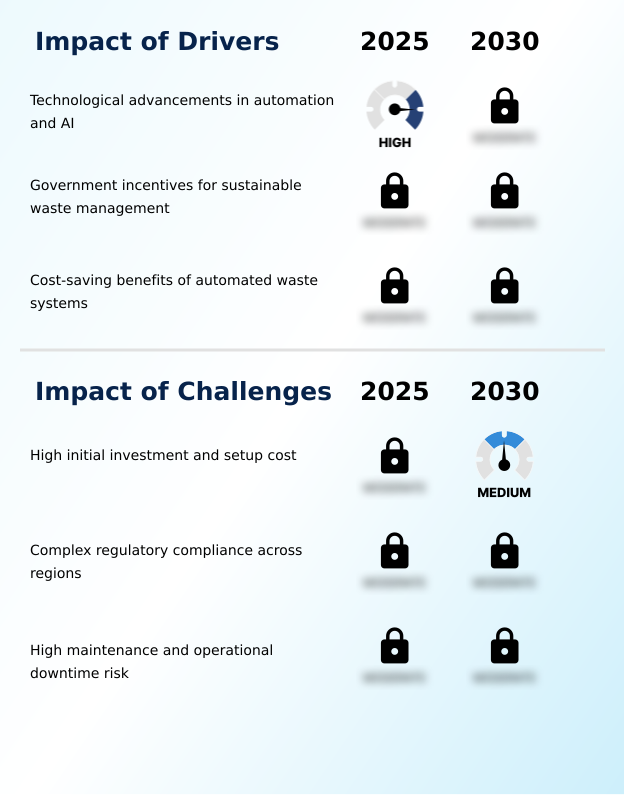
Market Dynamics

Our researchers analyzed the data with 2025 as the base year, along with the key drivers, trends, and challenges. A holistic analysis of drivers will help companies refine their marketing strategies to gain a competitive advantage.

  • The strategic imperative for reducing human exposure to toxins is accelerating the adoption of specialized automation across industries. Solutions for automating drum and container handling are becoming standard in chemical facilities to prevent spills and ensure precise inventory management. In the energy and electronics sectors, robotic systems for battery recycling are critical for safely dismantling components and recovering valuable materials.
  • The development of AI for sorting mixed hazardous waste enables facilities to process complex streams with high accuracy, a task previously deemed too dangerous for manual labor. This is particularly vital for the automated handling of asbestos materials, where robotic precision eliminates airborne fiber risks.
  • For nuclear sites, the use of autonomous vehicles in nuclear sites and tele-operated robots for decontamination tasks is non-negotiable for safety. Similarly, enhancing traceability of hazardous streams through automation is crucial for regulatory reporting and lifecycle management. The application of robotic arms for chemical handling in laboratories and the use of UAVs for site inspection and monitoring provide comprehensive oversight.
  • In healthcare, automating infectious medical waste disposal with robotic solutions for lab waste prevents pathogen spread. Facilities implementing such technologies report operational efficiencies over 30% higher than traditional methods, validating the investment in automation for optimizing hazardous liquid transfer and overall compliance with hazardous material regulations.
  • AI-based predictive failure in robotics and automation in chemical spill cleanup are also gaining traction.

What are the key market drivers leading to the rise in the adoption of Hazardous Waste Handling Automation Industry?

  • Technological advancements in automation and AI are a key driver of market growth, enhancing safety and operational efficiency in hazardous material management.

  • Technological advancements, particularly in AI and robotics, are the primary drivers of market expansion. The integration of AI-driven sorting systems and machine vision systems has revolutionized waste segregation, reducing human exposure in high-risk zones by over 90%.
  • These intelligent platforms, powered by predictive maintenance algorithms, analyze data from automated incineration control and robotic manipulators to anticipate equipment failures, boosting operational uptime by 15%.
  • Automated guided vehicles (AGVs) and robotic disassembly systems streamline workflows, increasing processing throughput by more than 25%.
  • The convergence of these technologies enables precision handling tools for waste, supporting key applications like automated containment solutions and industrial byproduct management, which are critical for both safety and regulatory adherence in toxic material management.

What are the market trends shaping the Hazardous Waste Handling Automation Industry?

  • The emergence of cloud-based hazardous waste tracking platforms represents a significant upcoming trend, offering real-time visibility and centralized data management for enhanced compliance.

  • A primary trend reshaping the market is the rapid adoption of cloud-based platforms and IoT sensor integration for comprehensive waste management. These systems provide unprecedented real-time visibility into operations, enabling automated waste classification and tamper-proof compliance documentation through features like blockchain-based recordkeeping. This digital transformation allows for predictive insights, improving forecast accuracy for waste generation by up to 25%.
  • Furthermore, by integrating dual-armed telerobotic systems with a central data hub, organizations can optimize remote operations in waste facilities, reducing diagnostic and repair times by 30%. The move toward integrated, intelligent solutions for e-waste recycling automation and heavy metal sludge handling is streamlining compliance and enhancing overall operational control through resource recovery from waste.

What challenges does the Hazardous Waste Handling Automation Industry face during its growth?

  • The high initial investment and setup costs for advanced automated systems represent a primary challenge, potentially slowing market adoption despite long-term benefits.

  • The high initial investment required for advanced automation presents a significant market challenge, particularly for customized applications such as biohazard containment automation or handling radioactive waste.
  • The total cost of ownership for fully autonomous platforms, including specialized hardware like robotic end-effectors and sensor-based sorting mechanisms, can be up to three times higher than semi-automated alternatives in the first year of deployment. Integrating autonomous ground vehicles and automated drum conveyance systems with existing infrastructure often requires substantial capital outlay.
  • However, this investment yields long-term returns by reducing labor-related incident costs and insurance premiums by an average of 50%, validating the financial case for adopting advanced systems for pharmaceutical waste automation and enhancing data-driven waste tracking.

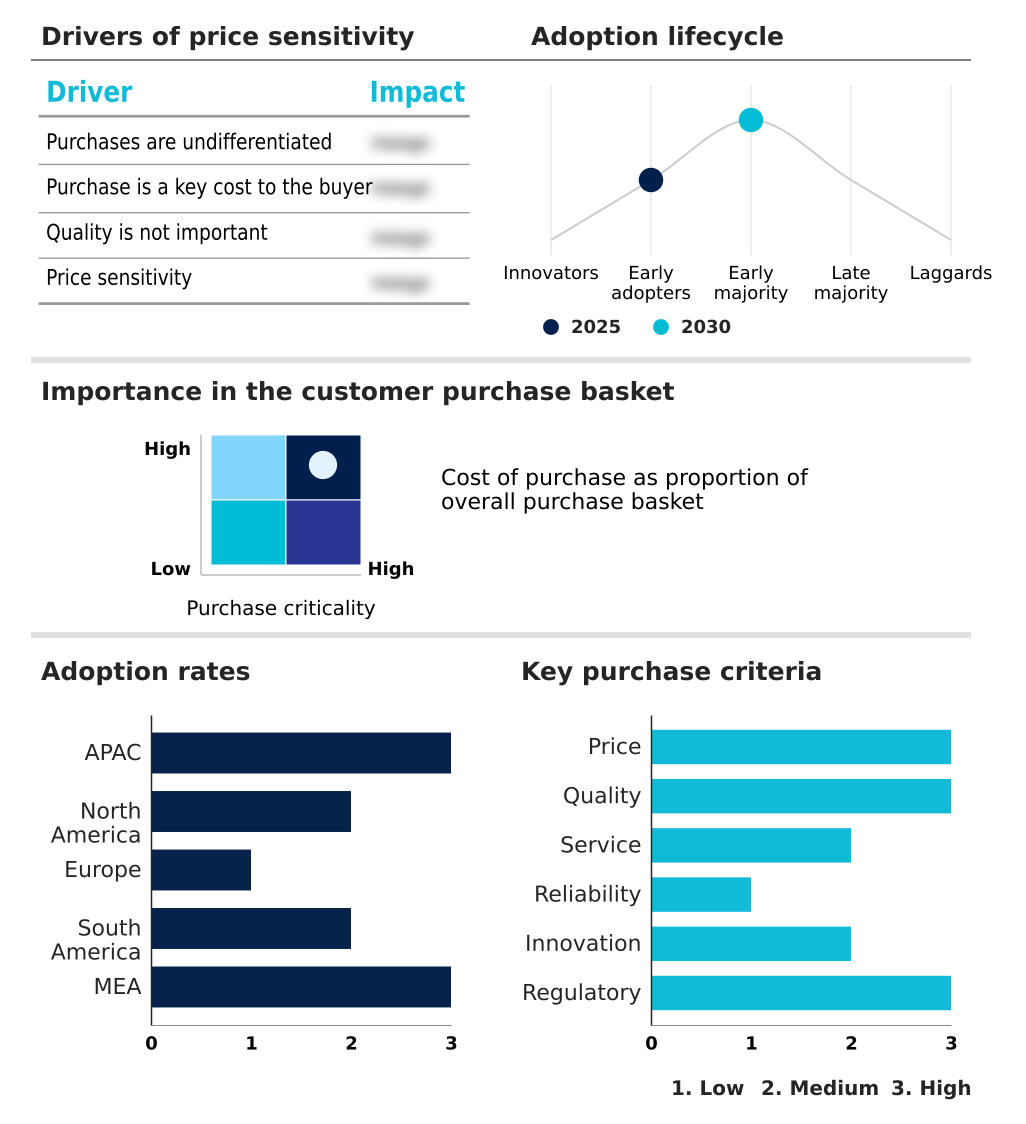
Exclusive Technavio Analysis on Customer Landscape

The hazardous waste handling automation market forecasting report includes the adoption lifecycle of the market, covering from the innovator’s stage to the laggard’s stage. It focuses on adoption rates in different regions based on penetration. Furthermore, the hazardous waste handling automation market report also includes key purchase criteria and drivers of price sensitivity to help companies evaluate and develop their market growth analysis strategies.

Customer Landscape of Hazardous Waste Handling Automation Industry

Competitive Landscape

Companies are implementing various strategies, such as strategic alliances, hazardous waste handling automation market forecast, partnerships, mergers and acquisitions, geographical expansion, and product/service launches, to enhance their presence in the industry.

ABB Ltd. - Delivering advanced industrial robots and integrated automation systems engineered for high-risk environments, enhancing safety and operational efficiency in specialized material handling applications.

The industry research and growth report includes detailed analyses of the competitive landscape of the market and information about key companies, including:

  • ABB Ltd.
  • Action Construction Equipment Ltd.
  • Clean Harbors Inc.
  • Hiab Corp.
  • Hosokawa Micron Corp.
  • Kawasaki Heavy Industries Ltd.
  • Konecranes
  • KUKA AG
  • Mitsubishi Electric Corp.
  • PaR Systems LLC
  • Penz crane GmbH
  • Recology Inc.
  • Siemens AG
  • Stericycle Inc.
  • Terex Corp.
  • Veolia Environment SA
  • Yaskawa Electric Corp.

Qualitative and quantitative analysis of companies has been conducted to help clients understand the wider business environment as well as the strengths and weaknesses of key industry players. Data is qualitatively analyzed to categorize companies as pure play, category-focused, industry-focused, and diversified; it is quantitatively analyzed to categorize companies as dominant, leading, strong, tentative, and weak.

Recent Development and News in Hazardous waste handling automation market

  • In October, 2024, Stericycle Inc. expanded its infrastructure by opening a new hospital, medical, and infectious waste incinerator in McCarran, Nevada, which integrates advanced engineering to safely manage regulated waste streams.
  • In October, 2024, ABB Ltd. formed a collaboration with startup Molg to develop robotic microfactories that utilize automation for the disassembly and recycling of data center electronic waste, aiming to recover valuable materials.
  • In November, 2024, Clean Harbors Inc. successfully completed tests of new incineration methods designed to destroy per- and polyfluoroalkyl substances (PFAS) to a level that meets stringent new environmental standards.
  • In March, 2025, Sellafield Ltd, in partnership with AtkinsRealis, achieved an industry first by successfully operating a quadrupedal robot on a nuclear-licensed site from a completely separate off-site location, demonstrating the viability of long-distance remote handling.

Dive into Technavio’s robust research methodology, blending expert interviews, extensive data synthesis, and validated models for unparalleled Hazardous Waste Handling Automation Market insights. See full methodology.

Market Scope
Page number 310
Base year 2025
Historic period 2020-2024
Forecast period 2026-2030
Growth momentum & CAGR Accelerate at a CAGR of 7.7%
Market growth 2026-2030 USD 9436.7 million
Market structure Fragmented
YoY growth 2025-2026(%) 7.2%
Key countries China, India, Japan, South Korea, Australia, Indonesia, US, Canada, Mexico, Germany, UK, France, Italy, Spain, The Netherlands, Brazil, Argentina, Chile, Saudi Arabia, UAE, South Africa, Israel and Turkey
Competitive landscape Leading Companies, Market Positioning of Companies, Competitive Strategies, and Industry Risks

Request Free Sample

Research Analyst Overview

  • The hazardous waste handling automation market is evolving beyond simple machinery to fully integrated, intelligent ecosystems designed to eliminate human risk. Boardroom decisions increasingly center on the capital investment in autonomous systems versus the long-term liabilities of manual processing. The deployment of automated decontamination robots has been shown to accelerate cleanup timelines by as much as 40%.
  • The technological core includes robotic sorting arms and tele-operated manipulators enhanced with haptic feedback systems. Central to this evolution are AI-powered analytics and machine vision systems, which enable computer vision for waste identification and power AI-driven sorting systems. These technologies are integrated into autonomous mobile robots, automated guided vehicles (AGVs), and even unmanned aerial vehicles (UAVs) for comprehensive site management.
  • Hardware, such as radiation-hardened sensors and robotic end-effectors, is crucial for nuclear decommissioning robotics and handling biohazard containment automation. The ecosystem relies on robotic cell integration, digital twin interfaces, and predictive maintenance algorithms to ensure reliability. Software advancements like blockchain-based recordkeeping secure the data chain of custody, while laser-based material identification and chemical resistant robotics handle diverse waste streams.
  • From automated drum conveyance to robotic waste compaction and automated autoclaving systems, every stage is being transformed by smart waste infrastructure, automated material recovery, and autonomous sorting and segregation capabilities.

What are the Key Data Covered in this Hazardous Waste Handling Automation Market Research and Growth Report?

  • What is the expected growth of the Hazardous Waste Handling Automation Market between 2026 and 2030?

    • USD 9.44 billion, at a CAGR of 7.7%

  • What segmentation does the market report cover?

    • The report is segmented by Application (Industries, and Agriculture), Component (Hardware, Software, and Service), Category (Solid, Liquid, and Gaseous), Product (Manipulator arms, Cranes, Trusses, and Others) and Geography (APAC, North America, Europe, South America, Middle East and Africa)

  • Which regions are analyzed in the report?

    • APAC, North America, Europe, South America and Middle East and Africa

  • What are the key growth drivers and market challenges?

    • Technological advancements in automation and AI, High initial investment and setup cost

  • Who are the major players in the Hazardous Waste Handling Automation Market?

    • ABB Ltd., Action Construction Equipment Ltd., Clean Harbors Inc., Hiab Corp., Hosokawa Micron Corp., Kawasaki Heavy Industries Ltd., Konecranes, KUKA AG, Mitsubishi Electric Corp., PaR Systems LLC, Penz crane GmbH, Recology Inc., Siemens AG, Stericycle Inc., Terex Corp., Veolia Environment SA and Yaskawa Electric Corp.

Market Research Insights

  • The market dynamics are shaped by a strong emphasis on toxic material management and environmental compliance automation. Organizations are achieving significant operational gains; for instance, facilities that implement real-time waste monitoring and secure data sharing for waste improve their regulatory reporting accuracy by over 95%.
  • Similarly, the adoption of automated pollution control measures and automated safety protocols in closed-loop waste systems reduces cross-contamination events by up to 40%. This push for data-driven waste tracking and waste stream optimization is compelling businesses to invest in advanced technologies.
  • The focus on labor dependency reduction through automation provides a clear path to enhancing both safety and profitability in high-risk material handling and pharmaceutical waste automation.

We can help! Our analysts can customize this hazardous waste handling automation market research report to meet your requirements.

Get in touch

1. Executive Summary

1.1 Market overview

Executive Summary - Chart on Market Overview
Executive Summary - Data Table on Market Overview
Executive Summary - Chart on Global Market Characteristics
Executive Summary - Chart on Market by Geography
Executive Summary - Chart on Market Segmentation by Application
Executive Summary - Chart on Market Segmentation by Component
Executive Summary - Chart on Market Segmentation by Category
Executive Summary - Chart on Market Segmentation by Product
Executive Summary - Chart on Incremental Growth
Executive Summary - Data Table on Incremental Growth
Executive Summary - Chart on Company Market Positioning

2. Technavio Analysis

2.1 Analysis of price sensitivity, lifecycle, customer purchase basket, adoption rates, and purchase criteria

2.2 Criticality of inputs and Factors of differentiation

Chart on Overview on criticality of inputs and factors of differentiation

2.3 Factors of disruption

Chart on Overview on factors of disruption

2.4 Impact of drivers and challenges

Chart on Impact of drivers and challenges in 2025 and 2030

3. Market Landscape

3.1 Market ecosystem

Chart on Parent Market
Data Table on - Parent Market

3.2 Market characteristics

Chart on Market characteristics analysis

3.3 Value chain analysis

Chart on Value chain analysis

4. Market Sizing

4.1 Market definition

Data Table on Offerings of companies included in the market definition

4.2 Market segment analysis

Market segments

4.3 Market size 2025

4.4 Market outlook: Forecast for 2025-2030

Chart on Global - Market size and forecast 2025-2030 ($ million)
Data Table on Global - Market size and forecast 2025-2030 ($ million)
Chart on Global Market: Year-over-year growth 2025-2030 (%)
Data Table on Global Market: Year-over-year growth 2025-2030 (%)

5. Historic Market Size

5.1 Global Hazardous Waste Handling Automation Market 2020 - 2024

Historic Market Size - Data Table on Global Hazardous Waste Handling Automation Market 2020 - 2024 ($ million)

5.2 Application segment analysis 2020 - 2024

Historic Market Size - Application Segment 2020 - 2024 ($ million)

5.3 Component segment analysis 2020 - 2024

Historic Market Size - Component Segment 2020 - 2024 ($ million)

5.4 Category segment analysis 2020 - 2024

Historic Market Size - Category Segment 2020 - 2024 ($ million)

5.5 Product segment analysis 2020 - 2024

Historic Market Size - Product Segment 2020 - 2024 ($ million)

5.6 Geography segment analysis 2020 - 2024

Historic Market Size - Geography Segment 2020 - 2024 ($ million)

5.7 Country segment analysis 2020 - 2024

Historic Market Size - Country Segment 2020 - 2024 ($ million)

6. Qualitative Analysis

6.1 Impact of AI on Global Hazardous Waste Handling Automation Market

7. Five Forces Analysis

7.1 Five forces summary

Five forces analysis - Comparison between 2025 and 2030

7.2 Bargaining power of buyers

Bargaining power of buyers - Impact of key factors 2025 and 2030

7.3 Bargaining power of suppliers

Bargaining power of suppliers - Impact of key factors in 2025 and 2030

7.4 Threat of new entrants

Threat of new entrants - Impact of key factors in 2025 and 2030

7.5 Threat of substitutes

Threat of substitutes - Impact of key factors in 2025 and 2030

7.6 Threat of rivalry

Threat of rivalry - Impact of key factors in 2025 and 2030

7.7 Market condition

Chart on Market condition - Five forces 2025 and 2030

8. Market Segmentation by Application

8.1 Market segments

Chart on Application - Market share 2025-2030 (%)
Data Table on Application - Market share 2025-2030 (%)

8.2 Comparison by Application

Chart on Comparison by Application
Data Table on Comparison by Application

8.3 Industries - Market size and forecast 2025-2030

Chart on Industries - Market size and forecast 2025-2030 ($ million)
Data Table on Industries - Market size and forecast 2025-2030 ($ million)
Chart on Industries - Year-over-year growth 2025-2030 (%)
Data Table on Industries - Year-over-year growth 2025-2030 (%)

8.4 Agriculture - Market size and forecast 2025-2030

Chart on Agriculture - Market size and forecast 2025-2030 ($ million)
Data Table on Agriculture - Market size and forecast 2025-2030 ($ million)
Chart on Agriculture - Year-over-year growth 2025-2030 (%)
Data Table on Agriculture - Year-over-year growth 2025-2030 (%)

8.5 Market opportunity by Application

Market opportunity by Application ($ million)
Data Table on Market opportunity by Application ($ million)

9. Market Segmentation by Component

9.1 Market segments

Chart on Component - Market share 2025-2030 (%)
Data Table on Component - Market share 2025-2030 (%)

9.2 Comparison by Component

Chart on Comparison by Component
Data Table on Comparison by Component

9.3 Hardware - Market size and forecast 2025-2030

Chart on Hardware - Market size and forecast 2025-2030 ($ million)
Data Table on Hardware - Market size and forecast 2025-2030 ($ million)
Chart on Hardware - Year-over-year growth 2025-2030 (%)
Data Table on Hardware - Year-over-year growth 2025-2030 (%)

9.4 Software - Market size and forecast 2025-2030

Chart on Software - Market size and forecast 2025-2030 ($ million)
Data Table on Software - Market size and forecast 2025-2030 ($ million)
Chart on Software - Year-over-year growth 2025-2030 (%)
Data Table on Software - Year-over-year growth 2025-2030 (%)

9.5 Services - Market size and forecast 2025-2030

Chart on Services - Market size and forecast 2025-2030 ($ million)
Data Table on Services - Market size and forecast 2025-2030 ($ million)
Chart on Services - Year-over-year growth 2025-2030 (%)
Data Table on Services - Year-over-year growth 2025-2030 (%)

9.6 Market opportunity by Component

Market opportunity by Component ($ million)
Data Table on Market opportunity by Component ($ million)

10. Market Segmentation by Category

10.1 Market segments

Chart on Market Segmentation by Category - Market share 2025-2030 (%)
Data Table on Market Segmentation by Category - Market share 2025-2030 (%)

10.2 Comparison by Market Segmentation by Category

Chart on Comparison by Market Segmentation by Category
Data Table on Comparison by Market Segmentation by Category

10.3 Solid - Market size and forecast 2025-2030

Chart on Solid - Market size and forecast 2025-2030 ($ million)
Data Table on Solid - Market size and forecast 2025-2030 ($ million)
Chart on Solid - Year-over-year growth 2025-2030 (%)
Data Table on Solid - Year-over-year growth 2025-2030 (%)

10.4 Liquid - Market size and forecast 2025-2030

Chart on Liquid - Market size and forecast 2025-2030 ($ million)
Data Table on Liquid - Market size and forecast 2025-2030 ($ million)
Chart on Liquid - Year-over-year growth 2025-2030 (%)
Data Table on Liquid - Year-over-year growth 2025-2030 (%)

10.5 Gaseous - Market size and forecast 2025-2030

Chart on Gaseous - Market size and forecast 2025-2030 ($ million)
Data Table on Gaseous - Market size and forecast 2025-2030 ($ million)
Chart on Gaseous - Year-over-year growth 2025-2030 (%)
Data Table on Gaseous - Year-over-year growth 2025-2030 (%)

10.6 Market opportunity by Market Segmentation by Category

Market opportunity by Market Segmentation by Category ($ million)
Data Table on Market opportunity by Market Segmentation by Category ($ million)

11. Market Segmentation by Product

11.1 Market segments

Chart on Product - Market share 2025-2030 (%)
Data Table on Product - Market share 2025-2030 (%)

11.2 Comparison by Product

Chart on Comparison by Product
Data Table on Comparison by Product

11.3 Manipulator arms - Market size and forecast 2025-2030

Chart on Manipulator arms - Market size and forecast 2025-2030 ($ million)
Data Table on Manipulator arms - Market size and forecast 2025-2030 ($ million)
Chart on Manipulator arms - Year-over-year growth 2025-2030 (%)
Data Table on Manipulator arms - Year-over-year growth 2025-2030 (%)

11.4 Cranes - Market size and forecast 2025-2030

Chart on Cranes - Market size and forecast 2025-2030 ($ million)
Data Table on Cranes - Market size and forecast 2025-2030 ($ million)
Chart on Cranes - Year-over-year growth 2025-2030 (%)
Data Table on Cranes - Year-over-year growth 2025-2030 (%)

11.5 Trusses - Market size and forecast 2025-2030

Chart on Trusses - Market size and forecast 2025-2030 ($ million)
Data Table on Trusses - Market size and forecast 2025-2030 ($ million)
Chart on Trusses - Year-over-year growth 2025-2030 (%)
Data Table on Trusses - Year-over-year growth 2025-2030 (%)

11.6 Others - Market size and forecast 2025-2030

Chart on Others - Market size and forecast 2025-2030 ($ million)
Data Table on Others - Market size and forecast 2025-2030 ($ million)
Chart on Others - Year-over-year growth 2025-2030 (%)
Data Table on Others - Year-over-year growth 2025-2030 (%)

11.7 Market opportunity by Product

Market opportunity by Product ($ million)
Data Table on Market opportunity by Product ($ million)

12. Customer Landscape

12.1 Customer landscape overview

Analysis of price sensitivity, lifecycle, customer purchase basket, adoption rates, and purchase criteria

13. Geographic Landscape

13.1 Geographic segmentation

Chart on Market share by geography 2025-2030 (%)
Data Table on Market share by geography 2025-2030 (%)

13.2 Geographic comparison

Chart on Geographic comparison
Data Table on Geographic comparison

13.3 APAC - Market size and forecast 2025-2030

Chart on APAC - Market size and forecast 2025-2030 ($ million)
Data Table on APAC - Market size and forecast 2025-2030 ($ million)
Chart on APAC - Year-over-year growth 2025-2030 (%)
Data Table on APAC - Year-over-year growth 2025-2030 (%)
Chart on Regional Comparison - APAC
Data Table on Regional Comparison - APAC

13.3.1 China - Market size and forecast 2025-2030

Chart on China - Market size and forecast 2025-2030 ($ million)
Data Table on China - Market size and forecast 2025-2030 ($ million)
Chart on China - Year-over-year growth 2025-2030 (%)
Data Table on China - Year-over-year growth 2025-2030 (%)

13.3.2 India - Market size and forecast 2025-2030

Chart on India - Market size and forecast 2025-2030 ($ million)
Data Table on India - Market size and forecast 2025-2030 ($ million)
Chart on India - Year-over-year growth 2025-2030 (%)
Data Table on India - Year-over-year growth 2025-2030 (%)

13.3.3 Japan - Market size and forecast 2025-2030

Chart on Japan - Market size and forecast 2025-2030 ($ million)
Data Table on Japan - Market size and forecast 2025-2030 ($ million)
Chart on Japan - Year-over-year growth 2025-2030 (%)
Data Table on Japan - Year-over-year growth 2025-2030 (%)

13.3.4 South Korea - Market size and forecast 2025-2030

Chart on South Korea - Market size and forecast 2025-2030 ($ million)
Data Table on South Korea - Market size and forecast 2025-2030 ($ million)
Chart on South Korea - Year-over-year growth 2025-2030 (%)
Data Table on South Korea - Year-over-year growth 2025-2030 (%)

13.3.5 Australia - Market size and forecast 2025-2030

Chart on Australia - Market size and forecast 2025-2030 ($ million)
Data Table on Australia - Market size and forecast 2025-2030 ($ million)
Chart on Australia - Year-over-year growth 2025-2030 (%)
Data Table on Australia - Year-over-year growth 2025-2030 (%)

13.3.6 Indonesia - Market size and forecast 2025-2030

Chart on Indonesia - Market size and forecast 2025-2030 ($ million)
Data Table on Indonesia - Market size and forecast 2025-2030 ($ million)
Chart on Indonesia - Year-over-year growth 2025-2030 (%)
Data Table on Indonesia - Year-over-year growth 2025-2030 (%)

13.4 North America - Market size and forecast 2025-2030

Chart on North America - Market size and forecast 2025-2030 ($ million)
Data Table on North America - Market size and forecast 2025-2030 ($ million)
Chart on North America - Year-over-year growth 2025-2030 (%)
Data Table on North America - Year-over-year growth 2025-2030 (%)
Chart on Regional Comparison - North America
Data Table on Regional Comparison - North America

13.4.1 US - Market size and forecast 2025-2030

Chart on US - Market size and forecast 2025-2030 ($ million)
Data Table on US - Market size and forecast 2025-2030 ($ million)
Chart on US - Year-over-year growth 2025-2030 (%)
Data Table on US - Year-over-year growth 2025-2030 (%)

13.4.2 Canada - Market size and forecast 2025-2030

Chart on Canada - Market size and forecast 2025-2030 ($ million)
Data Table on Canada - Market size and forecast 2025-2030 ($ million)
Chart on Canada - Year-over-year growth 2025-2030 (%)
Data Table on Canada - Year-over-year growth 2025-2030 (%)

13.4.3 Mexico - Market size and forecast 2025-2030

Chart on Mexico - Market size and forecast 2025-2030 ($ million)
Data Table on Mexico - Market size and forecast 2025-2030 ($ million)
Chart on Mexico - Year-over-year growth 2025-2030 (%)
Data Table on Mexico - Year-over-year growth 2025-2030 (%)

13.5 Europe - Market size and forecast 2025-2030

Chart on Europe - Market size and forecast 2025-2030 ($ million)
Data Table on Europe - Market size and forecast 2025-2030 ($ million)
Chart on Europe - Year-over-year growth 2025-2030 (%)
Data Table on Europe - Year-over-year growth 2025-2030 (%)
Chart on Regional Comparison - Europe
Data Table on Regional Comparison - Europe

13.5.1 Germany - Market size and forecast 2025-2030

Chart on Germany - Market size and forecast 2025-2030 ($ million)
Data Table on Germany - Market size and forecast 2025-2030 ($ million)
Chart on Germany - Year-over-year growth 2025-2030 (%)
Data Table on Germany - Year-over-year growth 2025-2030 (%)

13.5.2 UK - Market size and forecast 2025-2030

Chart on UK - Market size and forecast 2025-2030 ($ million)
Data Table on UK - Market size and forecast 2025-2030 ($ million)
Chart on UK - Year-over-year growth 2025-2030 (%)
Data Table on UK - Year-over-year growth 2025-2030 (%)

13.5.3 France - Market size and forecast 2025-2030

Chart on France - Market size and forecast 2025-2030 ($ million)
Data Table on France - Market size and forecast 2025-2030 ($ million)
Chart on France - Year-over-year growth 2025-2030 (%)
Data Table on France - Year-over-year growth 2025-2030 (%)

13.5.4 Italy - Market size and forecast 2025-2030

Chart on Italy - Market size and forecast 2025-2030 ($ million)
Data Table on Italy - Market size and forecast 2025-2030 ($ million)
Chart on Italy - Year-over-year growth 2025-2030 (%)
Data Table on Italy - Year-over-year growth 2025-2030 (%)

13.5.5 Spain - Market size and forecast 2025-2030

Chart on Spain - Market size and forecast 2025-2030 ($ million)
Data Table on Spain - Market size and forecast 2025-2030 ($ million)
Chart on Spain - Year-over-year growth 2025-2030 (%)
Data Table on Spain - Year-over-year growth 2025-2030 (%)

13.5.6 The Netherlands - Market size and forecast 2025-2030

Chart on The Netherlands - Market size and forecast 2025-2030 ($ million)
Data Table on The Netherlands - Market size and forecast 2025-2030 ($ million)
Chart on The Netherlands - Year-over-year growth 2025-2030 (%)
Data Table on The Netherlands - Year-over-year growth 2025-2030 (%)

13.6 South America - Market size and forecast 2025-2030

Chart on South America - Market size and forecast 2025-2030 ($ million)
Data Table on South America - Market size and forecast 2025-2030 ($ million)
Chart on South America - Year-over-year growth 2025-2030 (%)
Data Table on South America - Year-over-year growth 2025-2030 (%)
Chart on Regional Comparison - South America
Data Table on Regional Comparison - South America

13.6.1 Brazil - Market size and forecast 2025-2030

Chart on Brazil - Market size and forecast 2025-2030 ($ million)
Data Table on Brazil - Market size and forecast 2025-2030 ($ million)
Chart on Brazil - Year-over-year growth 2025-2030 (%)
Data Table on Brazil - Year-over-year growth 2025-2030 (%)

13.6.2 Argentina - Market size and forecast 2025-2030

Chart on Argentina - Market size and forecast 2025-2030 ($ million)
Data Table on Argentina - Market size and forecast 2025-2030 ($ million)
Chart on Argentina - Year-over-year growth 2025-2030 (%)
Data Table on Argentina - Year-over-year growth 2025-2030 (%)

13.6.3 Chile - Market size and forecast 2025-2030

Chart on Chile - Market size and forecast 2025-2030 ($ million)
Data Table on Chile - Market size and forecast 2025-2030 ($ million)
Chart on Chile - Year-over-year growth 2025-2030 (%)
Data Table on Chile - Year-over-year growth 2025-2030 (%)

13.7 Middle East and Africa - Market size and forecast 2025-2030

Chart on Middle East and Africa - Market size and forecast 2025-2030 ($ million)
Data Table on Middle East and Africa - Market size and forecast 2025-2030 ($ million)
Chart on Middle East and Africa - Year-over-year growth 2025-2030 (%)
Data Table on Middle East and Africa - Year-over-year growth 2025-2030 (%)
Chart on Regional Comparison - Middle East and Africa
Data Table on Regional Comparison - Middle East and Africa

13.7.1 Saudi Arabia - Market size and forecast 2025-2030

Chart on Saudi Arabia - Market size and forecast 2025-2030 ($ million)
Data Table on Saudi Arabia - Market size and forecast 2025-2030 ($ million)
Chart on Saudi Arabia - Year-over-year growth 2025-2030 (%)
Data Table on Saudi Arabia - Year-over-year growth 2025-2030 (%)

13.7.2 UAE - Market size and forecast 2025-2030

Chart on UAE - Market size and forecast 2025-2030 ($ million)
Data Table on UAE - Market size and forecast 2025-2030 ($ million)
Chart on UAE - Year-over-year growth 2025-2030 (%)
Data Table on UAE - Year-over-year growth 2025-2030 (%)

13.7.3 South Africa - Market size and forecast 2025-2030

Chart on South Africa - Market size and forecast 2025-2030 ($ million)
Data Table on South Africa - Market size and forecast 2025-2030 ($ million)
Chart on South Africa - Year-over-year growth 2025-2030 (%)
Data Table on South Africa - Year-over-year growth 2025-2030 (%)

13.7.4 Israel - Market size and forecast 2025-2030

Chart on Israel - Market size and forecast 2025-2030 ($ million)
Data Table on Israel - Market size and forecast 2025-2030 ($ million)
Chart on Israel - Year-over-year growth 2025-2030 (%)
Data Table on Israel - Year-over-year growth 2025-2030 (%)

13.7.5 Turkey - Market size and forecast 2025-2030

Chart on Turkey - Market size and forecast 2025-2030 ($ million)
Data Table on Turkey - Market size and forecast 2025-2030 ($ million)
Chart on Turkey - Year-over-year growth 2025-2030 (%)
Data Table on Turkey - Year-over-year growth 2025-2030 (%)

13.8 Market opportunity by geography

Market opportunity by geography ($ million)
Data Tables on Market opportunity by geography ($ million)

14. Drivers, Challenges, and Opportunity

14.1 Market drivers

Technological advancements in automation and AI
Government incentives for sustainable waste management
Cost-saving benefits of automated waste systems

14.2 Market challenges

High initial investment and setup cost
Complex regulatory compliance across regions
High maintenance and operational downtime risk

14.3 Impact of drivers and challenges

Impact of drivers and challenges in 2025 and 2030

14.4 Market opportunities

Cloud-based hazardous waste tracking platforms
Development of modular automation solutions
Increased focus on circular economy practices

15. Competitive Landscape

15.1 Overview

15.2

Overview on criticality of inputs and factors of differentiation

15.3 Landscape disruption

Overview on factors of disruption

15.4 Industry risks

Impact of key risks on business

16. Competitive Analysis

16.1 Companies profiled

Companies covered

16.2 Company ranking index

16.3 Market positioning of companies

Matrix on companies position and classification

16.4 ABB Ltd.

ABB Ltd. - Overview
ABB Ltd. - Business segments
ABB Ltd. - Key news
ABB Ltd. - Key offerings
ABB Ltd. - Segment focus
SWOT

16.5 Clean Harbors Inc.

Clean Harbors Inc. - Overview
Clean Harbors Inc. - Business segments
Clean Harbors Inc. - Key news
Clean Harbors Inc. - Key offerings
Clean Harbors Inc. - Segment focus
SWOT

16.6 Hiab Corp.

Hiab Corp. - Overview
Hiab Corp. - Business segments
Hiab Corp. - Key offerings
Hiab Corp. - Segment focus
SWOT

16.7 Hosokawa Micron Corp.

Hosokawa Micron Corp. - Overview
Hosokawa Micron Corp. - Business segments
Hosokawa Micron Corp. - Key offerings
Hosokawa Micron Corp. - Segment focus
SWOT

16.8 Kawasaki Heavy Industries Ltd.

Kawasaki Heavy Industries Ltd. - Overview
Kawasaki Heavy Industries Ltd. - Business segments
Kawasaki Heavy Industries Ltd. - Key news
Kawasaki Heavy Industries Ltd. - Key offerings
Kawasaki Heavy Industries Ltd. - Segment focus
SWOT

16.9 Konecranes

Konecranes - Overview
Konecranes - Business segments
Konecranes - Key news
Konecranes - Key offerings
Konecranes - Segment focus
SWOT

16.10 KUKA AG

KUKA AG - Overview
KUKA AG - Business segments
KUKA AG - Key offerings
KUKA AG - Segment focus
SWOT

16.11 Mitsubishi Electric Corp.

Mitsubishi Electric Corp. - Overview
Mitsubishi Electric Corp. - Business segments
Mitsubishi Electric Corp. - Key offerings
Mitsubishi Electric Corp. - Segment focus
SWOT

16.12 PaR Systems LLC

PaR Systems LLC - Overview
PaR Systems LLC - Product / Service
PaR Systems LLC - Key offerings
SWOT

16.13 Penz crane GmbH

Penz crane GmbH - Overview
Penz crane GmbH - Product / Service
Penz crane GmbH - Key offerings
SWOT

16.14 Siemens AG

Siemens AG - Overview
Siemens AG - Business segments
Siemens AG - Key news
Siemens AG - Key offerings
Siemens AG - Segment focus
SWOT

16.15 Stericycle Inc.

Stericycle Inc. - Overview
Stericycle Inc. - Business segments
Stericycle Inc. - Key offerings
Stericycle Inc. - Segment focus
SWOT

16.16 Terex Corp.

Terex Corp. - Overview
Terex Corp. - Business segments
Terex Corp. - Key news
Terex Corp. - Key offerings
Terex Corp. - Segment focus
SWOT

16.17 Veolia Environment SA

Veolia Environment SA - Overview
Veolia Environment SA - Business segments
Veolia Environment SA - Key offerings
Veolia Environment SA - Segment focus
SWOT

16.18 Yaskawa Electric Corp.

Yaskawa Electric Corp. - Overview
Yaskawa Electric Corp. - Business segments
Yaskawa Electric Corp. - Key news
Yaskawa Electric Corp. - Key offerings
Yaskawa Electric Corp. - Segment focus
SWOT

17. Appendix

17.1 Scope of the report

Market definition
Objectives
Notes and caveats

17.2 Inclusions and exclusions checklist

Inclusions checklist
Exclusions checklist

17.3 Currency conversion rates for US$

17.4 Research methodology

17.5 Data procurement

Information sources

17.6 Data validation

17.7 Validation techniques employed for market sizing

17.8 Data synthesis

17.9 360 degree market analysis

17.10 List of abbreviations

Research Methodology

Technavio presents a detailed picture of the market by way of study, synthesis, and summation of data from multiple sources. The analysts have presented the various facets of the market with a particular focus on identifying the key industry influencers. The data thus presented is comprehensive, reliable, and the result of extensive research, both primary and secondary.

INFORMATION SOURCES

Primary sources

  • Manufacturers and suppliers
  • Channel partners
  • Industry experts
  • Strategic decision makers

Secondary sources

  • Industry journals and periodicals
  • Government data
  • Financial reports of key industry players
  • Historical data
  • Press releases

DATA ANALYSIS

Data Synthesis

  • Collation of data
  • Estimation of key figures
  • Analysis of derived insights

Data Validation

  • Triangulation with data models
  • Reference against proprietary databases
  • Corroboration with industry experts

REPORT WRITING

Qualitative

  • Market drivers
  • Market challenges
  • Market trends
  • Five forces analysis

Quantitative

  • Market size and forecast
  • Market segmentation
  • Geographical insights
  • Competitive landscape

Interested in this report?

Get your sample now to see our research methodology and insights!

Download Now

Frequently Asked Questions

Hazardous Waste Handling Automation market growth will increase by USD 9436.7 million during 2026-2030.

The Hazardous Waste Handling Automation market is expected to grow at a CAGR of 7.7% during 2026-2030.

Hazardous Waste Handling Automation market is segmented by Application (Industries, Agriculture) Component (Hardware, Software, Services) Category (Solid, Liquid, Gaseous) Product (Manipulator arms, Cranes, Trusses, Others)

ABB Ltd., Action Construction Equipment Ltd., Clean Harbors Inc., Hiab Corp., Hosokawa Micron Corp., Kawasaki Heavy Industries Ltd., Konecranes, KUKA AG, Mitsubishi Electric Corp., PaR Systems LLC, Penz crane GmbH, Recology Inc., Siemens AG, Stericycle Inc., Terex Corp., Veolia Environment SA, Yaskawa Electric Corp. are a few of the key vendors in the Hazardous Waste Handling Automation market.

APAC will register the highest growth rate of 48.6% among the other regions. Therefore, the Hazardous Waste Handling Automation market in APAC is expected to garner significant business opportunities for the vendors during the forecast period.

China, India, Japan, South Korea, Australia, Indonesia, US, Canada, Mexico, Germany, UK, France, Italy, Spain, The Netherlands, Brazil, Argentina, Chile, Saudi Arabia, UAE, South Africa, Israel, Turkey

  • Technological advancements in automation and AI is the driving factor this market.

The Hazardous Waste Handling Automation market vendors should focus on grabbing business opportunities from the Application segment as it accounted for the largest market share in the base year.