Heat Stress Meter Market Analysis North America, Europe, APAC, South America, Middle East and Africa - China, US, Germany, France, India, Japan - Size and Forecast 2024-2028

Heat Stress Meter Market Analysis North America, Europe, APAC, South America, Middle East and Africa - China, US, Germany, France, India, Japan - Size and Forecast 2024-2028

Published: Jul 2024 199 Pages SKU: IRTNTR80067

Market Overview at a Glance

$24.09 K
Market Opportunity
7.3%
CAGR
6.78
YoY growth 2023-2024(%)

Heat Stress Meter Market Size 2024-2028 

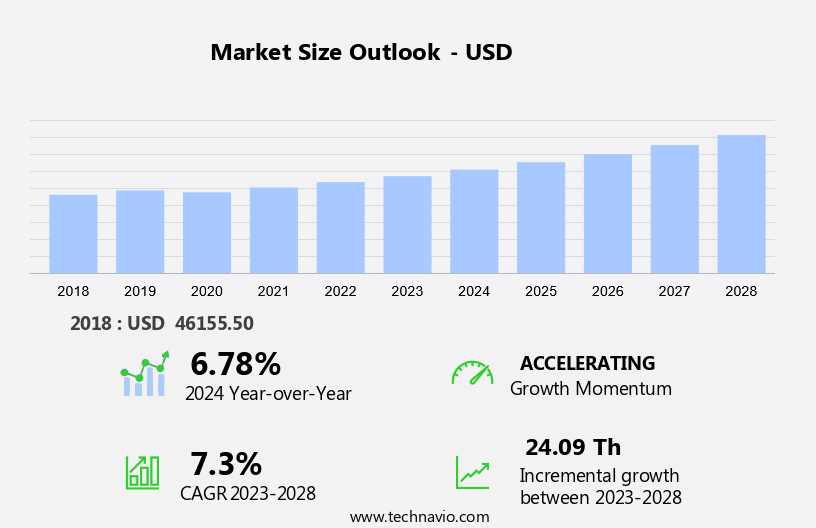
The heat stress meter market size is forecast to increase by USD 24.09 thousand at a CAGR of 7.3% between 2023 and 2028. The heat stress market is experiencing significant growth due to rising global temperatures and the increasing importance of animal comfort in various industries, particularly in calf management, feeding management, milk harvesting, and reproduction management. Smart heat stress meters, which provide real-time data and alerts, are gaining popularity among veterinarians and farmers for effective temperature monitoring. These advanced heat stress meters are also seeing applications in sports medicine, where temperature and environmental factors play a key role in the well-being and performance of athletes. However, the high cost of these advanced monitoring systems remains a challenge for smaller farms and operations. By implementing heat stress monitoring solutions, farmers can optimize their operations, improve animal welfare, and increase productivity.

What will be the Size of the Market During the Forecast Period?

Heat Stress Meter Market Size

 Request Free Sample

The heat stress meter market is expanding, driven by the growing demand for monitoring environmental factors that impact both human and animal health. In industrial production and athletics, heat stress monitors, including handheld and wearable types, are essential for ensuring safety during high-temperature operations. PCE instruments are widely used to measure heat stress levels, with AI and IoT platforms enabling real-time data collection and analysis. In agriculture, heat stress meters play a vital role in livestock monitoring products, particularly in dairy farms and animal husbandry, where temperature extremes can affect livestock health and productivity. With the rise of wearable monitoring equipment and the integration of sensors like heat monitors, the market is poised to grow across various sectors, improving safety and efficiency in both human and animal environments.

Market Segmentation

The market research report provides comprehensive data (region-wise segment analysis), with forecasts and estimates in "USD thousand" for the period 2024-2028, as well as historical data from 2018-2022 for the following segments.

  • Application
    • Military
    • Oil and gas/mining
    • Manufacturing plants
    • Athletics/sports
    • Others
  • Product
    • Handheld
    • Fix/portable
  • Geography
    • North America
      • US
    • Europe
      • Germany
      • France
    • APAC
      • China
      • India
      • Japan
    • South America
    • Middle East and Africa

By Application Insights

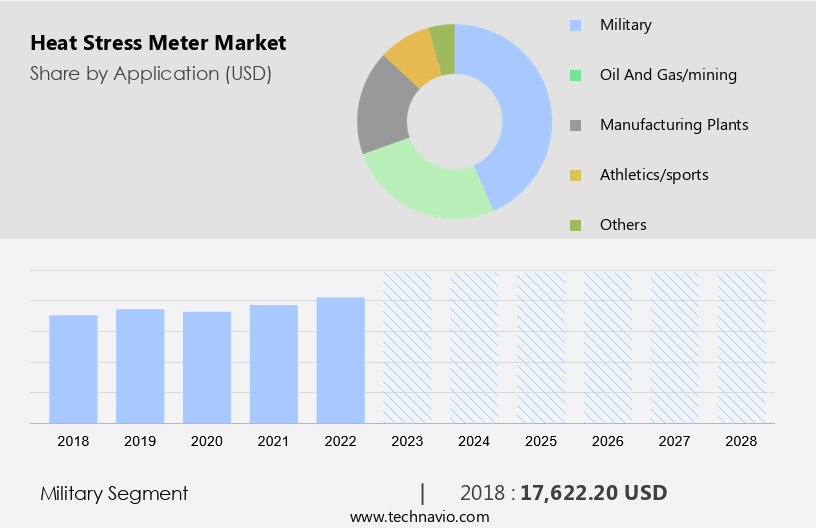
The military segment is estimated to witness significant growth during the forecast period. In the international market, the military sector plays a significant role in ensuring the safety of personnel in demanding environments. These meters are crucial for assessing heat stress risks by measuring factors such as temperature, humidity, and Wet Bulb Globe Temperature (WBGT). This information is vital for managing workloads, scheduling rest breaks, and promoting hydration and recovery in various settings, including deserts, jungles, and high altitudes. Military applications necessitate heat stress meters that are rugged, dependable, and able to function effectively under challenging conditions.

Further, handheld and portable models are highly sought after due to their real-time data capabilities and mobility, making them ideal for field operations, training exercises, and combat situations. These devices enable military personnel to make informed decisions regarding workload management and personal safety in extreme temperatures.

Heat Stress Meter Market Size

Get a glance at the market share of various segments Request Free Sample

The military segment accounted for USD 17,622.20 in 2018 and showed a gradual increase during the forecast period.

Regional Insights

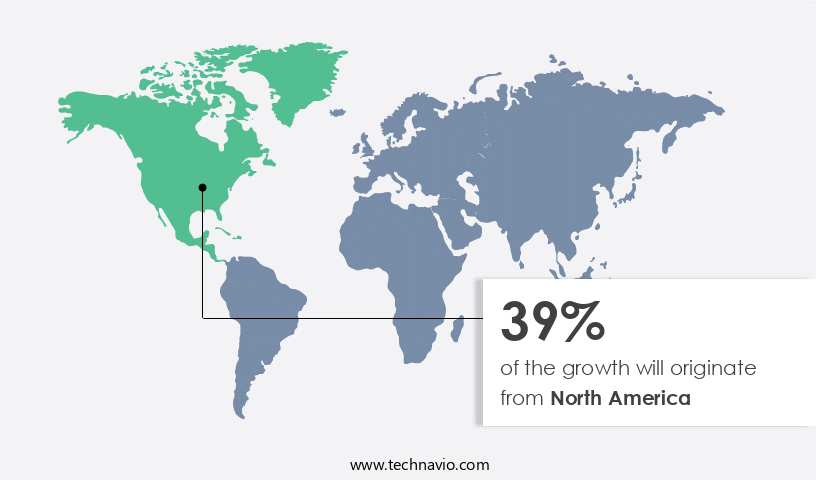
North America is estimated to contribute 39% to the growth of the global market during the forecast period. Technavio's analysts have elaborately explained the regional trends and drivers that shape the market during the forecast period.

Heat Stress Meter Market Share by Geography

For more insights on the market share of various regions Request Free Sample

The North American market for heat stress meters is witnessing notable expansion, with the United States and Canada being key contributors. In the US, the Occupational Safety and Health Administration (OSHA) has established regulations to manage heat stress, leading industries to adopt heat stress monitoring devices to ensure worker safety and adherence to regulations. The Centers for Disease Control and Prevention (CDC) in the US also advocates for heat illness prevention, emphasizing the importance of environmental monitoring. In Canada, the Canadian Centre for Occupational Health and Safety (CCOHS) offers resources and guidelines for managing workplace heat stress. These initiatives underline the significance of employing heat stress meters to identify and mitigate elevated temperature risks, particularly in sectors such as construction, manufacturing, and agriculture.

Sports activities and athletic training in the US and Canada are also increasingly utilizing heat stress monitors to ensure the health and safety of athletes and sports medicine personnel, as well as coaches and parents. These tools enable real-time monitoring of temperature conditions and hydration levels, ensuring optimal performance and well-being.

Our researchers analyzed the data with 2023 as the base year, along with the key drivers, trends, and challenges. A holistic analysis of drivers will help companies refine their marketing strategies to gain a competitive advantage.

Market Driver

Increasing global temperatures is notably driving market growth. Heat stress monitors play a crucial role in measuring and mitigating the effects of environmental factors on human health and productivity. These devices use sensor readings to assess heat stress levels, taking into account individual variability. Wearable devices, such as smartwatches and safety vests, equipped with heat stress monitors have gained popularity in various sectors.

Moreover, wireless connectivity enables real-time data transmission to centralized systems and cloud-based platforms for condition monitoring. Heat stress monitors find extensive applications in industrial production, military, athletics and sports, agriculture, mining, oil and gas, transportation and logistics, and other industries. Thus, such factors are driving the growth of the market during the forecast period.

Market Trends

Growing adoption of smart heat stress meters is the key trend in the market. Heat stress monitors play a crucial role in measuring and mitigating the effects of environmental factors on human health and productivity. These devices provide sensor readings that help assess the risk of heat stress, enabling preventive measures. Calibration is essential to ensure the accuracy of heat stress monitor readings, considering individual variability.

Moreover, wearable devices, such as smartwatches and safety vests, are increasingly being used for personal heat stress monitoring. Wireless connectivity and centralized systems with cloud-based platforms facilitate condition monitoring and data analysis. Heat stress monitors find extensive applications in various industries, including industrial production, military, athletics and sports, agriculture, mining, oil and gas, transportation and logistics, and construction. Thus, such trends will shape the growth of the market during the forecast period.

Market Challenge

High cost of heat stress meters is the major challenge that affects the growth of the market. Heat stress monitors are essential tools used to measure and mitigate the effects of environmental factors on human health and productivity. These devices provide sensor readings to assess the level of heat stress, enabling preventive measures against potential harm.

Moreover, calibration is crucial to ensure accurate readings, considering individual variability. Wearable devices, such as smartwatches and safety vests, equipped with heat stress monitors have gained popularity due to their convenience and wireless connectivity. Centralized systems and cloud-based platforms facilitate condition monitoring, allowing for real-time analysis and intervention. Heat stress monitors are not only essential in industrial production settings, where operational losses due to heat-related illnesses can be substantial, but also in military applications, athletics and sports, agriculture, mining, oil and gas, transportation and logistics, and various other industries. Hence, the above factors will impede the growth of the market during the forecast period.

Exclusive Customer Landscape

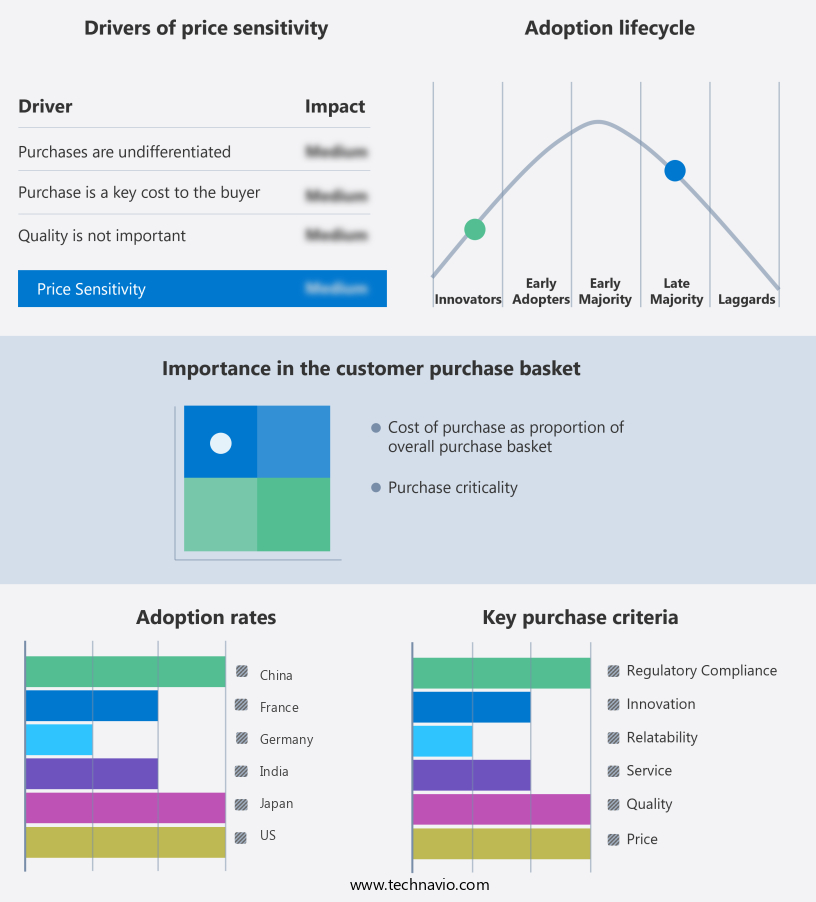
The market forecasting report includes the adoption lifecycle of the market, covering from the innovator's stage to the laggard's stage. It focuses on adoption rates in different regions based on penetration. Furthermore, the report also includes key purchase criteria and drivers of price sensitivity to help companies evaluate and develop their market growth analysis strategies.

Heat Stress Meter Market Share by Geography

 Customer Landscape

Key Companies & Market Insights

Companies are implementing various strategies, such as strategic alliances, partnerships, mergers and acquisitions, geographical expansion, and product/service launches, to enhance their presence in the market.

Accutron Instruments Inc: The company offers Heat Stress Meter products such as Accutron WBGT heat stress sensor and others.

The market research and growth report includes detailed analyses of the competitive landscape of the market and information about key companies, including:

  • Air-Met Scientific Pty Ltd.
  • Ambient LLC
  • Anaum Measuring Equipment LLC
  • Besantek Corp.
  • GEA Group AG
  • General Tools and Instruments LLC
  • Inova Design Solutions Ltd.
  • MISUMI India Pvt Ltd.
  • Nielsen-Kellerman Co.
  • PCE Holding GmbH
  • REED Instruments
  • Romteck
  • Run Rite Electronics Pty Ltd.
  • SATO Holdings Corp.
  • Sensidyne LP
  • Sper Scientific Ltd.
  • Teledyne FLIR LLC
  • TSI Inc.
  • Triplett Test Equipment and Tools

Qualitative and quantitative analysis of companies has been conducted to help clients understand the wider business environment as well as the strengths and weaknesses of key market players. Data is qualitatively analyzed to categorize companies as pure play, category-focused, industry-focused, and diversified; it is quantitatively analyzed to categorize companies as dominant, leading, strong, tentative, and weak.

Research Analyst Overview

The market encompasses a range of technologies designed to measure and monitor environmental conditions that can lead to heat stress in various industries and applications. Sensor readings play a crucial role in these systems, providing real-time data on temperature, humidity, and other relevant factors. Calibration is an essential aspect of ensuring accurate readings, with individual variability requiring regular adjustments. Wearable devices, such as smartwatches and safety vests, are increasingly being used in the market for individual monitoring. Wireless connectivity and centralized systems enable remote monitoring and cloud-based platforms facilitate condition monitoring and data analysis. Heat stress monitors are used extensively in industries like manufacturing, where operational losses due to heat stress can be significant.

Further, the military also utilizes these technologies to ensure the safety and well-being of personnel in harsh environments. In the realm of sports and athletics, heat stress monitors help athletes, coaches, parents, and sports medicine personnel optimize training and hydration. Agriculture, mining, oil and gas, transportation and logistics, and livestock monitoring are other sectors that benefit from heat stress monitoring technologies. Wearable sensors, aftermarket components, consulting services, and various sensor types cater to the diverse needs of these industries. Globe thermometers and reed instruments are traditional alternatives, but AI-driven solutions are gaining traction for their advanced capabilities. Heat stress monitors are also used in sports and athletics for animal comfort, calf management, feeding management, milk harvesting, and reproduction management. Veterinarians and livestock farmers use these tools to ensure animal welfare and productivity.

Market Scope

Report Coverage

Details

Page number

199

Base year

2023

Historic period

2018-2022

Forecast period

2024-2028

Growth momentum & CAGR

Accelerate at a CAGR of 7.3%

Market growth 2024-2028

USD 24.09 thousand

Market structure

Fragmented

YoY growth 2023-2024(%)

6.78

Regional analysis

North America, Europe, APAC, South America, and Middle East and Africa

Performing market contribution

North America at 39%

Key countries

China, US, Germany, France, India, and Japan

Competitive landscape

Leading Companies, Market Positioning of Companies, Competitive Strategies, and Industry Risks

Key companies profiled

Accutron Instruments Inc., Air-Met Scientific Pty Ltd., Ambient LLC, Anaum Measuring Equipment LLC, Besantek Corp., GEA Group AG, General Tools and Instruments LLC, Inova Design Solutions Ltd., MISUMI India Pvt Ltd., Nielsen-Kellerman Co., PCE Holding GmbH, REED Instruments, Romteck, Run Rite Electronics Pty Ltd., SATO Holdings Corp., Sensidyne LP, Sper Scientific Ltd., Teledyne FLIR LLC, TSI Inc., and Triplett Test Equipment and Tools

Market dynamics

Parent market analysis, market growth inducers and obstacles, market forecast, fast-growing and slow-growing segment analysis, COVID-19 impact and recovery analysis and future consumer dynamics, market condition analysis for the forecast period

Customization purview

If our market report has not included the data that you are looking for, you can reach out to our analysts and get segments customized.

Request Free Sample

What are the Key Data Covered in this Market Research and Growth Report?

  • CAGR of the market during the forecast period
  • Detailed information on factors that will drive the market growth and forecasting between 2024 and 2028
  • Precise estimation of the size of the market  and its contribution of the market in focus to the parent market
  • Accurate predictions about upcoming market growth and trends and changes in consumer behaviour
  • Growth of the market across North America, Europe, APAC, South America, and Middle East and Africa
  • Thorough analysis of the market's competitive landscape and detailed information about companies
  • Comprehensive analysis of factors that will challenge the growth of market companies

We can help! Our analysts can customize this market research report to meet your requirements. Get in touch

1 Executive Summary

  • 1.1 Market overview
    • Executive Summary - Chart on Market Overview
    • Executive Summary - Data Table on Market Overview
    • Executive Summary - Chart on Global Market Characteristics
    • Executive Summary - Chart on Market by Geography
    • Executive Summary - Chart on Market Segmentation by Application
    • Executive Summary - Chart on Market Segmentation by Product
    • Executive Summary - Chart on Incremental Growth
    • Executive Summary - Data Table on Incremental Growth
    • Executive Summary - Chart on Company Market Positioning

2 Technavio Analysis

  • 2.1 Analysis of price sensitivity, lifecycle, customer purchase basket, adoption rates, and purchase criteria
    • Analysis of price sensitivity, lifecycle, customer purchase basket, adoption rates, and purchase criteria
  • 2.2 Criticality of inputs and Factors of differentiation
    • Overview on criticality of inputs and factors of differentiation
  • 2.3 Factors of disruption
    • Overview on factors of disruption
  • 2.4 Impact of drivers and challenges
    • Impact of drivers and challenges in 2023 and 2028

3 Market Landscape

  • 3.1 Market ecosystem
    • Parent Market
    • Data Table on - Parent Market
  • 3.2 Market characteristics
    • Market characteristics analysis
  • 3.3 Value chain analysis
    • Value Chain Analysis

4 Market Sizing

  • 4.1 Market definition
    • Offerings of companies included in the market definition
  • 4.2 Market segment analysis
    • Market segments
  • 4.3 Market size 2023
    • 4.4 Market outlook: Forecast for 2023-2028
      • Chart on Global - Market size and forecast 2023-2028 ($ thousand)
      • Data Table on Global - Market size and forecast 2023-2028 ($ thousand)
      • Chart on Global Market: Year-over-year growth 2023-2028 (%)
      • Data Table on Global Market: Year-over-year growth 2023-2028 (%)

    5 Historic Market Size

    • 5.1 Global Heat Stress Meter Market 2018 - 2022
      • Historic Market Size - Data Table on Global Heat Stress Meter Market 2018 - 2022 ($ thousand)
    • 5.2 Application segment analysis 2018 - 2022
      • Historic Market Size - Application Segment 2018 - 2022 ($ thousand)
    • 5.3 Product segment analysis 2018 - 2022
      • Historic Market Size - Product Segment 2018 - 2022 ($ thousand)
    • 5.4 Geography segment analysis 2018 - 2022
      • Historic Market Size - Geography Segment 2018 - 2022 ($ thousand)
    • 5.5 Country segment analysis 2018 - 2022
      • Historic Market Size - Country Segment 2018 - 2022 ($ thousand)

    6 Additional Value/Volume Data

    • 6.1 Global heat stress meter market by country 2023 - 2028 ($ million)
      • Market Size (value) - Data Table on Global heat stress meter market by Country 2023 - 2028 ($ million)

    7 Five Forces Analysis

    • 7.1 Five forces summary
      • Five forces analysis - Comparison between 2023 and 2028
    • 7.2 Bargaining power of buyers
      • Bargaining power of buyers - Impact of key factors 2023 and 2028
    • 7.3 Bargaining power of suppliers
      • Bargaining power of suppliers - Impact of key factors in 2023 and 2028
    • 7.4 Threat of new entrants
      • Threat of new entrants - Impact of key factors in 2023 and 2028
    • 7.5 Threat of substitutes
      • Threat of substitutes - Impact of key factors in 2023 and 2028
    • 7.6 Threat of rivalry
      • Threat of rivalry - Impact of key factors in 2023 and 2028
    • 7.7 Market condition
      • Chart on Market condition - Five forces 2023 and 2028

    8 Market Segmentation by Application

    • 8.1 Market segments
      • Chart on Application - Market share 2023-2028 (%)
      • Data Table on Application - Market share 2023-2028 (%)
    • 8.2 Comparison by Application
      • Chart on Comparison by Application
      • Data Table on Comparison by Application
    • 8.3 Military - Market size and forecast 2023-2028
      • Chart on Military - Market size and forecast 2023-2028 ($ thousand)
      • Data Table on Military - Market size and forecast 2023-2028 ($ thousand)
      • Chart on Military - Year-over-year growth 2023-2028 (%)
      • Data Table on Military - Year-over-year growth 2023-2028 (%)
    • 8.4 Oil and gas/mining - Market size and forecast 2023-2028
      • Chart on Oil and gas/mining - Market size and forecast 2023-2028 ($ thousand)
      • Data Table on Oil and gas/mining - Market size and forecast 2023-2028 ($ thousand)
      • Chart on Oil and gas/mining - Year-over-year growth 2023-2028 (%)
      • Data Table on Oil and gas/mining - Year-over-year growth 2023-2028 (%)
    • 8.5 Manufacturing plants - Market size and forecast 2023-2028
      • Chart on Manufacturing plants - Market size and forecast 2023-2028 ($ thousand)
      • Data Table on Manufacturing plants - Market size and forecast 2023-2028 ($ thousand)
      • Chart on Manufacturing plants - Year-over-year growth 2023-2028 (%)
      • Data Table on Manufacturing plants - Year-over-year growth 2023-2028 (%)
    • 8.6 Athletics/sports - Market size and forecast 2023-2028
      • Chart on Athletics/sports - Market size and forecast 2023-2028 ($ thousand)
      • Data Table on Athletics/sports - Market size and forecast 2023-2028 ($ thousand)
      • Chart on Athletics/sports - Year-over-year growth 2023-2028 (%)
      • Data Table on Athletics/sports - Year-over-year growth 2023-2028 (%)
    • 8.7 Others - Market size and forecast 2023-2028
      • Chart on Others - Market size and forecast 2023-2028 ($ thousand)
      • Data Table on Others - Market size and forecast 2023-2028 ($ thousand)
      • Chart on Others - Year-over-year growth 2023-2028 (%)
      • Data Table on Others - Year-over-year growth 2023-2028 (%)
    • 8.8 Market opportunity by Application
      • Market opportunity by Application ($ thousand)
      • Data Table on Market opportunity by Application ($ thousand)

    9 Market Segmentation by Product

    • 9.1 Market segments
      • Chart on Product - Market share 2023-2028 (%)
      • Data Table on Product - Market share 2023-2028 (%)
    • 9.2 Comparison by Product
      • Chart on Comparison by Product
      • Data Table on Comparison by Product
    • 9.3 Handheld - Market size and forecast 2023-2028
      • Chart on Handheld - Market size and forecast 2023-2028 ($ thousand)
      • Data Table on Handheld - Market size and forecast 2023-2028 ($ thousand)
      • Chart on Handheld - Year-over-year growth 2023-2028 (%)
      • Data Table on Handheld - Year-over-year growth 2023-2028 (%)
    • 9.4 Fix/portable - Market size and forecast 2023-2028
      • Chart on Fix/portable - Market size and forecast 2023-2028 ($ thousand)
      • Data Table on Fix/portable - Market size and forecast 2023-2028 ($ thousand)
      • Chart on Fix/portable - Year-over-year growth 2023-2028 (%)
      • Data Table on Fix/portable - Year-over-year growth 2023-2028 (%)
    • 9.5 Market opportunity by Product
      • Market opportunity by Product ($ thousand)
      • Data Table on Market opportunity by Product ($ thousand)

    10 Customer Landscape

    • 10.1 Customer landscape overview
      • Analysis of price sensitivity, lifecycle, customer purchase basket, adoption rates, and purchase criteria

    11 Geographic Landscape

    • 11.1 Geographic segmentation
      • Chart on Market share by geography 2023-2028 (%)
      • Data Table on Market share by geography 2023-2028 (%)
    • 11.2 Geographic comparison
      • Chart on Geographic comparison
      • Data Table on Geographic comparison
    • 11.3 North America - Market size and forecast 2023-2028
      • Chart on North America - Market size and forecast 2023-2028 ($ thousand)
      • Data Table on North America - Market size and forecast 2023-2028 ($ thousand)
      • Chart on North America - Year-over-year growth 2023-2028 (%)
      • Data Table on North America - Year-over-year growth 2023-2028 (%)
    • 11.4 Europe - Market size and forecast 2023-2028
      • Chart on Europe - Market size and forecast 2023-2028 ($ thousand)
      • Data Table on Europe - Market size and forecast 2023-2028 ($ thousand)
      • Chart on Europe - Year-over-year growth 2023-2028 (%)
      • Data Table on Europe - Year-over-year growth 2023-2028 (%)
    • 11.5 APAC - Market size and forecast 2023-2028
      • Chart on APAC - Market size and forecast 2023-2028 ($ thousand)
      • Data Table on APAC - Market size and forecast 2023-2028 ($ thousand)
      • Chart on APAC - Year-over-year growth 2023-2028 (%)
      • Data Table on APAC - Year-over-year growth 2023-2028 (%)
    • 11.6 South America - Market size and forecast 2023-2028
      • Chart on South America - Market size and forecast 2023-2028 ($ thousand)
      • Data Table on South America - Market size and forecast 2023-2028 ($ thousand)
      • Chart on South America - Year-over-year growth 2023-2028 (%)
      • Data Table on South America - Year-over-year growth 2023-2028 (%)
    • 11.7 Middle East and Africa - Market size and forecast 2023-2028
      • Chart on Middle East and Africa - Market size and forecast 2023-2028 ($ thousand)
      • Data Table on Middle East and Africa - Market size and forecast 2023-2028 ($ thousand)
      • Chart on Middle East and Africa - Year-over-year growth 2023-2028 (%)
      • Data Table on Middle East and Africa - Year-over-year growth 2023-2028 (%)
    • 11.8 China - Market size and forecast 2023-2028
      • Chart on China - Market size and forecast 2023-2028 ($ thousand)
      • Data Table on China - Market size and forecast 2023-2028 ($ thousand)
      • Chart on China - Year-over-year growth 2023-2028 (%)
      • Data Table on China - Year-over-year growth 2023-2028 (%)
    • 11.9 US - Market size and forecast 2023-2028
      • Chart on US - Market size and forecast 2023-2028 ($ thousand)
      • Data Table on US - Market size and forecast 2023-2028 ($ thousand)
      • Chart on US - Year-over-year growth 2023-2028 (%)
      • Data Table on US - Year-over-year growth 2023-2028 (%)
    • 11.10 Germany - Market size and forecast 2023-2028
      • Chart on Germany - Market size and forecast 2023-2028 ($ thousand)
      • Data Table on Germany - Market size and forecast 2023-2028 ($ thousand)
      • Chart on Germany - Year-over-year growth 2023-2028 (%)
      • Data Table on Germany - Year-over-year growth 2023-2028 (%)
    • 11.11 France - Market size and forecast 2023-2028
      • Chart on France - Market size and forecast 2023-2028 ($ thousand)
      • Data Table on France - Market size and forecast 2023-2028 ($ thousand)
      • Chart on France - Year-over-year growth 2023-2028 (%)
      • Data Table on France - Year-over-year growth 2023-2028 (%)
    • 11.12 India - Market size and forecast 2023-2028
      • Chart on India - Market size and forecast 2023-2028 ($ thousand)
      • Data Table on India - Market size and forecast 2023-2028 ($ thousand)
      • Chart on India - Year-over-year growth 2023-2028 (%)
      • Data Table on India - Year-over-year growth 2023-2028 (%)
    • 11.13 Japan - Market size and forecast 2023-2028
      • Chart on Japan - Market size and forecast 2023-2028 ($ thousand)
      • Data Table on Japan - Market size and forecast 2023-2028 ($ thousand)
      • Chart on Japan - Year-over-year growth 2023-2028 (%)
      • Data Table on Japan - Year-over-year growth 2023-2028 (%)
    • 11.14 Market opportunity by geography
      • Market opportunity by geography ($ thousand)
      • Data Tables on Market opportunity by geography ($ thousand)

    12 Drivers, Challenges, and Opportunity/Restraints

    • 12.1 Market drivers
      • 12.2 Market challenges
        • 12.3 Impact of drivers and challenges
          • Impact of drivers and challenges in 2023 and 2028
        • 12.4 Market opportunities/restraints

          13 Competitive Landscape

          • 13.1 Overview
            • 13.2 Competitive Landscape
              • Overview on criticality of inputs and factors of differentiation
            • 13.3 Landscape disruption
              • Overview on factors of disruption
            • 13.4 Industry risks
              • Impact of key risks on business

            14 Competitive Analysis

            • 14.1 Companies profiled
              • Companies covered
            • 14.2 Company ranking index
              • Company ranking index
            • 14.3 Market positioning of companies
              • Matrix on companies position and classification
            • 14.4 Accutron Instruments Inc.
              • Accutron Instruments Inc. - Overview
              • Accutron Instruments Inc. - Product / Service
              • Accutron Instruments Inc. - Key offerings
              • SWOT
            • 14.5 Air-Met Scientific Pty Ltd.
              • Air-Met Scientific Pty Ltd. - Overview
              • Air-Met Scientific Pty Ltd. - Product / Service
              • Air-Met Scientific Pty Ltd. - Key offerings
              • SWOT
            • 14.6 Anaum Measuring Equipment LLC
              • Anaum Measuring Equipment LLC - Overview
              • Anaum Measuring Equipment LLC - Product / Service
              • Anaum Measuring Equipment LLC - Key offerings
              • SWOT
            • 14.7 Besantek Corp.
              • Besantek Corp. - Overview
              • Besantek Corp. - Product / Service
              • Besantek Corp. - Key offerings
              • SWOT
            • 14.8 GEA Group AG
              • GEA Group AG - Overview
              • GEA Group AG - Business segments
              • GEA Group AG - Key news
              • GEA Group AG - Key offerings
              • GEA Group AG - Segment focus
              • SWOT
            • 14.9 Nielsen-Kellerman Co.
              • Nielsen-Kellerman Co. - Overview
              • Nielsen-Kellerman Co. - Product / Service
              • Nielsen-Kellerman Co. - Key offerings
              • SWOT
            • 14.10 PCE Holding GmbH
              • PCE Holding GmbH - Overview
              • PCE Holding GmbH - Product / Service
              • PCE Holding GmbH - Key offerings
              • SWOT
            • 14.11 REED Instruments
              • REED Instruments - Overview
              • REED Instruments - Product / Service
              • REED Instruments - Key offerings
              • SWOT
            • 14.12 Romteck
              • Romteck - Overview
              • Romteck - Product / Service
              • Romteck - Key offerings
              • SWOT
            • 14.13 Run Rite Electronics Pty Ltd.
              • Run Rite Electronics Pty Ltd. - Overview
              • Run Rite Electronics Pty Ltd. - Product / Service
              • Run Rite Electronics Pty Ltd. - Key offerings
              • SWOT
            • 14.14 SATO Holdings Corp.
              • SATO Holdings Corp. - Overview
              • SATO Holdings Corp. - Business segments
              • SATO Holdings Corp. - Key news
              • SATO Holdings Corp. - Key offerings
              • SATO Holdings Corp. - Segment focus
              • SWOT
            • 14.15 Sensidyne LP
              • Sensidyne LP - Overview
              • Sensidyne LP - Product / Service
              • Sensidyne LP - Key offerings
              • SWOT
            • 14.16 Sper Scientific Ltd.
              • Sper Scientific Ltd. - Overview
              • Sper Scientific Ltd. - Product / Service
              • Sper Scientific Ltd. - Key offerings
              • SWOT
            • 14.17 Teledyne FLIR LLC
              • Teledyne FLIR LLC - Overview
              • Teledyne FLIR LLC - Product / Service
              • Teledyne FLIR LLC - Key offerings
              • SWOT
            • 14.18 TSI Inc.
              • TSI Inc. - Overview
              • TSI Inc. - Product / Service
              • TSI Inc. - Key offerings
              • SWOT

            15 Appendix

            • 15.1 Scope of the report
              • 15.2 Inclusions and exclusions checklist
                • Inclusions checklist
                • Exclusions checklist
              • 15.3 Currency conversion rates for US$
                • Currency conversion rates for US$
              • 15.4 Research methodology
                • Research methodology
              • 15.5 Data procurement
                • Information sources
              • 15.6 Data validation
                • Data validation
              • 15.7 Validation techniques employed for market sizing
                • Validation techniques employed for market sizing
              • 15.8 Data synthesis
                • Data synthesis
              • 15.9 360 degree market analysis
                • 360 degree market analysis
              • 15.10 List of abbreviations
                • List of abbreviations

              Research Methodology

              Technavio presents a detailed picture of the market by way of study, synthesis, and summation of data from multiple sources. The analysts have presented the various facets of the market with a particular focus on identifying the key industry influencers. The data thus presented is comprehensive, reliable, and the result of extensive research, both primary and secondary.

              INFORMATION SOURCES

              Primary sources

              • Manufacturers and suppliers
              • Channel partners
              • Industry experts
              • Strategic decision makers

              Secondary sources

              • Industry journals and periodicals
              • Government data
              • Financial reports of key industry players
              • Historical data
              • Press releases

              DATA ANALYSIS

              Data Synthesis

              • Collation of data
              • Estimation of key figures
              • Analysis of derived insights

              Data Validation

              • Triangulation with data models
              • Reference against proprietary databases
              • Corroboration with industry experts

              REPORT WRITING

              Qualitative

              • Market drivers
              • Market challenges
              • Market trends
              • Five forces analysis

              Quantitative

              • Market size and forecast
              • Market segmentation
              • Geographical insights
              • Competitive landscape

              Interested in this report?

              Get your sample now to see our research methodology and insights!

              Download Now

              Frequently Asked Questions

              Heat Stress Meter market growth will increase by $ 24.09 th during 2024-2028.

              The Heat Stress Meter market is expected to grow at a CAGR of 7.3% during 2024-2028.

              Heat Stress Meter market is segmented by Application( Military, Oil and gas/mining, Manufacturing plants, Athletics/sports, Others) Product( Handheld, Fix/portable)

              Accutron Instruments Inc., Air-Met Scientific Pty Ltd., Ambient LLC, Anaum Measuring Equipment LLC, Besantek Corp., GEA Group AG, General Tools and Instruments LLC, Inova Design Solutions Ltd., MISUMI INDIA Pvt Ltd., Nielsen-Kellerman Co., PCE Holding GmbH, REED Instruments, Romteck, Run Rite Electronics Pty Ltd., SATO Holdings Corp., Sensidyne LP, Sper Scientific Ltd., Teledyne FLIR LLC, TSI Inc., Triplett Test Equipment and Tools are a few of the key vendors in the Heat Stress Meter market.

              North America will register the highest growth rate of 39% among the other regions. Therefore, the Heat Stress Meter market in North America is expected to garner significant business opportunities for the vendors during the forecast period.

              China, US, Germany, France, India, Japan

              • Increasing global temperatures is the driving factor this market.

              The Heat Stress Meter market vendors should focus on grabbing business opportunities from the Military segment as it accounted for the largest market share in the base year.