Europe Heavy-Duty Trucks Market Size 2025-2029
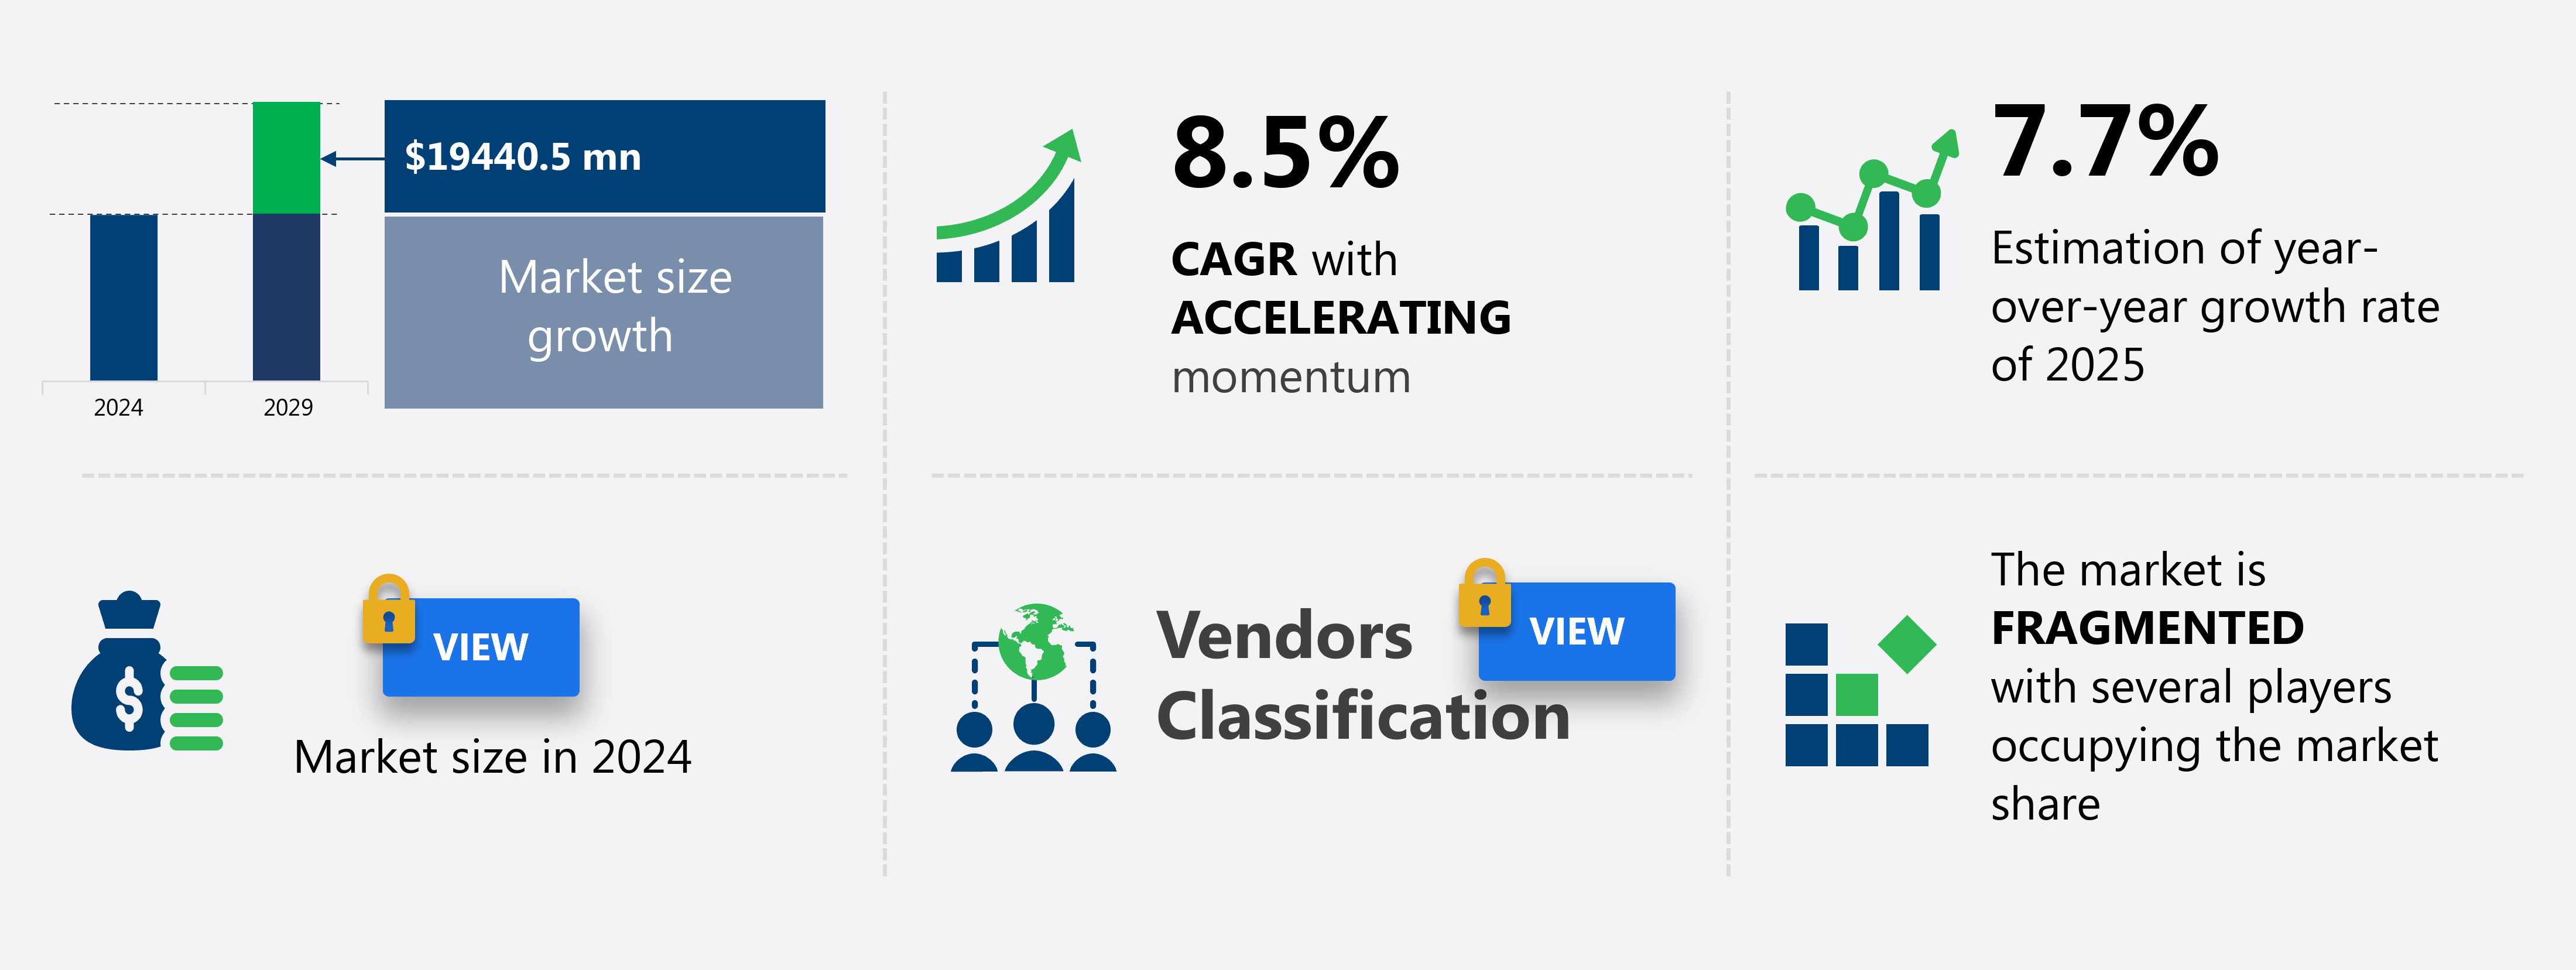
The heavy-duty trucks market in Europe size is forecast to increase by USD 19.44 billion billion at a CAGR of 8.5% between 2024 and 2029.
-
The market specifically for heavy-duty trucks, is experiencing significant growth in various regions, with a notable increase in demand in Eastern Europe. A key trend driving this growth is the shift towards alternative fuels, such as hydrogen and electric trucks, to reduce emissions and promote sustainability. However, the high cost of heavy-duty trucks remains a challenge for many buyers, leading to the rise of truck rental services and fleet management solutions. In the US and North America, the construction, logistics, and e-commerce industries are major consumers of heavy-duty trucks. These industries are increasingly adopting smart city technologies, such as LED lighting and stainless steel bodies, to enhance efficiency and durability.
-
Additionally, the demand for specialized trucks, such as dump trucks and SPAs, continues to grow in the construction sector. Overall, the heavy-duty truck market is expected to witness continued growth, driven by these trends and challenges, and the adoption of advanced technologies to improve fuel efficiency and reduce emissions.
What will be the Size of the market During the Forecast Period?
-
The heavy-duty trucks market encompasses the production and sale of commercial vehicles designed for long-distance transportation and extreme situations. These vehicles, including heavy commercial vehicles and trailers, exhibit strong construction and powerful engines, enabling them to carry significant weight and traverse various terrains. The market caters to diverse industries such as long-distance freight transportation, mining operations, and industrial activities. Sustainability goals are increasingly influencing market trends, with a growing emphasis on alternative fuel vehicles and fleet modernization. Autonomous heavy-duty trucks are gaining traction as a potential solution for increased efficiency and reduced operational costs. Regulatory pressure to reduce emissions is another significant factor driving market evolution. The market is a dynamic and evolving sector, continually adapting to meet the demands of various industries and societal expectations.
How is this market segmented and which is the largest segment?
The market research report provides comprehensive data (region-wise segment analysis), with forecasts and estimates in "USD million" for the period 2025-2029, as well as historical data from 2019-2023 for the following segments.
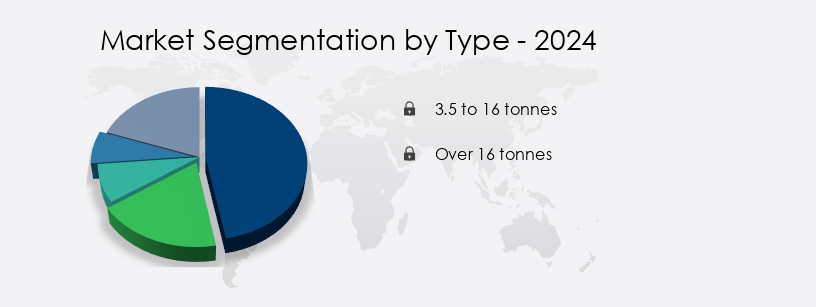
- Type
- 3.5 to 16 tonnes
- Over 16 tonnes
- Fuel Type
- Diesel powered
- Gasoline powered
- Electric powered
- Solar powered
- Propulsion
- Internal combustion engine (ICE)
- Hybrid and electric vehicles (HEV and BEV)
- Geography
- Europe
- France
- Germany
- Italy
- UK
- Europe
By Type Insights
- The 3.5 to 16 tonnes segment is estimated to witness significant growth during the forecast period.
Heavy-duty trucks, with weight capacities ranging from 3.5 to 16 tonnes, play a pivotal role in various industries and applications due to their adaptability. These trucks are ideal for local and regional transport tasks, including food distribution, parcel delivery, and construction projects. Their smaller size and maneuverability enable efficient navigation in urban and suburban environments. In the construction industry, HD trucks are utilized for transporting materials within a city or region. The Asia Pacific region, driven by emerging economies and smart city initiatives, presents significant growth opportunities for commercial vehicles, including HD trucks. Additionally, the e-commerce industry's wave in demand for last-mile delivery solutions further bolsters the market for HD trucks.
In the mining sector, dump trucks and mining vehicles are essential for resource extraction and industrial activities. Advanced driver-assistance systems, load-carrying capacities, and safety features are crucial considerations for HD trucks. The adoption of green technologies, such as battery-powered trucks, hydrogen trucks, and alternative fuel trucks, is on the rise due to environmental regulations and sustainability initiatives. Fleet management systems, real-time tracking, and tracing solutions are also increasingly important for optimizing operations and reducing costs. The global market for heavy-duty trucks is expected to grow significantly due to economic expansion, freight demand, and infrastructure projects in industrial zones.
Get a glance at the market report of share of various segments Request Free Sample
Market Dynamics
Our Europe Heavy-Duty Trucks Market researchers analyzed the data with 2024 as the base year, along with the key drivers, trends, and challenges. A holistic analysis of drivers will help companies refine their marketing strategies to gain a competitive advantage.
What are the key market drivers leading to the rise in adoption of Europe Heavy-Duty Trucks Market?
- Increasing demand for HD trucks in Eastern Europe is the key driver of the market. The Heavy Duty Trucks market in Europe is witnessing varying growth rates in different regions. While major markets like Western Europe are projected to experience slower growth during the forecast period, Eastern Europe is anticipated to contribute significantly to the adoption of Heavy Duty Trucks. Factors such as increasing manufacturing activities and improving road infrastructure are fueling the demand for Heavy Duty Trucks in Eastern European countries. Furthermore, these regions are experiencing faster economic growth, which is positively linked to the expanding transportation and logistics sector. Notable countries in Eastern Europe, including Romania, Poland, the Czech Republic, and Hungary, are growing at a relatively faster pace compared to major economies in Western Europe.
-
In the context of market dynamics, the European Heavy Duty Trucks market is influenced by several factors. The increase in industrial activities and the need for efficient long-distance freight transportation are key drivers. Mining operations, industrial activities, and construction projects require Heavy Duty Trucks with strong construction, powerful engines, and high weight-carrying capability. In addition, the E-Commerce industry's growth is leading to an increase in demand for last-mile delivery vehicles. Smart city initiatives, such as the implementation of Advanced driver-assistance systems, smart sensors, charging stations, and Autonomous Mission Kits, are gaining traction in Europe. These technologies are transforming the Heavy Duty Trucks market by enabling the development of Electric trucks, Hydrogen trucks, and Alternative fuel trucks.
What are the market trends shaping the Europe Heavy-Duty Trucks Market?
- The increasing prominence of electric HD trucks is the upcoming trend In the market. The heavy-duty truck market is witnessing significant growth due to the increasing focus on sustainable and efficient transportation solutions. Commercial vehicles, including heavy-duty trucks and commercial trailers, play a crucial role in long-distance freight transportation and industrial activities such as mining operations and concrete mixing. In emerging economies, the expansion of road networks and smart city initiatives are driving the demand for heavy commercial vehicles. E-commerce industry growth and the need for last-mile delivery have led to an increased focus on alternative fuel trucks, such as battery-powered and hydrogen trucks, and autonomous driving technology. Advanced driver-assistance systems, smart sensors, charging stations, and autonomous mission kits are becoming increasingly important for heavy-duty trucks.
-
The Asia Pacific region is a significant market for heavy-duty trucks due to the high demand for mining vehicles, construction trucks, and dump trucks. Safety features, fleet management, and autonomous trucks are essential for fleet modernization and sustainability goals. However, initial purchase costs, budget constraints, and environmental concerns are key challenges for the adoption of electric heavy-duty trucks and alternative-fuel vehicles. Connected truck technologies, such as telematics systems, real-time tracking, and tracing solutions, are essential for fleet management and optimizing fuel efficiency. The transportation infrastructure, intermodal connections, and trade routes are critical factors impacting the market.
What challenges European heavy-duty Trucks Market face during the growth?
- The high cost associated with HD trucks is a key challenge affecting the market growth. Heavy-duty trucks play a crucial role in long-distance freight transportation and industrial activities, including mining operations and construction sites. The manufacturing process for these vehicles involves the use of high-precision components and raw materials, such as stainless steel, hardened steel, cast iron, and metal alloys. The increasing cost of these raw materials has led to a rise in manufacturing expenses, narrowing profit margins for Original Equipment Manufacturers (OEMs). Moreover, the total cost of ownership for heavy-duty trucks is substantial due to the continuous need for maintenance and repairs. The emergence of advanced technologies, such as smart sensors, charging stations for battery-powered trucks, and autonomous mission kits, is transforming the heavy commercial vehicle sector.
-
In the Asia Pacific region, the e-commerce industry's growth and the development of smart city initiatives are driving the demand for heavy-duty trucks, particularly commercial trailers, concrete mixers, and dump trucks. The mining industry's resource extraction activities also require heavy-duty trucks with strong construction, powerful engines, and high load-carrying capacities. Environmental regulations and sustainability initiatives are influencing the shift towards cleaner vehicles, including electric trucks, hydrogen trucks, and alternative fuel trucks. Pollution rules and legislative settings are also driving the adoption of advanced driver-assistance systems and fleet management systems to improve fuel efficiency and reduce carbon footprints. The heavy-duty truck market faces challenges from supply chain disruptions, trade disputes, and raw material shortages.
Exclusive Customer Landscape
The market forecasting report includes the adoption lifecycle of the market, covering from the innovator's stage to the laggard's stage. It focuses on adoption rates in different regions based on penetration. Furthermore, the market report also includes key purchase criteria and drivers of price sensitivity to help companies evaluate and develop their market growth analysis strategies.

Customer Landscape
Key Companies & Market Insights
Companies are implementing various strategies, such as strategic alliances, market forecast , partnerships, mergers and acquisitions, geographical expansion, and product/service launches, to enhance their presence In the market.
AB Volvo - The company offers heavy-duty trucks such as Volvo FH16, Volvo FH, and Volvo FM, and also offers heavy-duty trucks such as Volvo FH16, Volvo FH, and Volvo FM.The company offers heavy duty trucks such as Volvo FH16, Volvo FH, and Volvo FM.
The market research and growth report includes detailed analyses of the competitive landscape of the market and information about key companies, including:
- AB Volvo
- Ashok Leyland Ltd.
- BYD Co. Ltd.
- Daimler Truck AG
- China Dong Feng Motor Industry Imp. and Exp. Co. Ltd.
- Eicher Motors Ltd.
- Ford Motor Co.
- General Motors Co.
- Hindustan Motors Ltd.
- Isuzu Motors Ltd.
- Iveco SpA
- Mahindra and Mahindra Ltd.
- Oshkosh Corp.
- PACCAR Inc.
- Scania AB
- Sinotruk Hong Kong Ltd.
- Tata Motors Ltd.
- Tesla Inc.
- Toyota Motor Corp.
- Volkswagen AG
Qualitative and quantitative analysis of companies has been conducted to help clients understand the wider business environment as well as the strengths and weaknesses of key market players. Data is qualitatively analyzed to categorize companies as pure play, category-focused, industry-focused, and diversified; it is quantitatively analyzed to categorize companies as dominant, leading, strong, tentative, and weak.
Research Analyst Overview
The market encompasses a broad range of commercial vehicles designed for transporting heavy loads over long distances and in extreme situations. These vehicles play a crucial role in various industries, including mining operations, construction, industrial activities, and long-distance freight transportation. The market is witnessing significant growth due to the increasing demand for efficient and sustainable transportation solutions. Heavy commercial vehicles, such as dump trucks and concrete mixers, are essential for resource extraction and economic development in emerging economies. The expansion of road networks and smart city initiatives In these regions is driving the demand for heavy-duty trucks. The e-commerce industry's growth is also contributing to the market's growth, as the need for efficient last-mile delivery solutions increases.
Advancements in technology are transforming the heavy-duty trucks market. Battery-powered trucks and hydrogen trucks are gaining popularity due to their cleaner and more sustainable fuel options. Automated trucks equipped with smart sensors and autonomous mission kits are being developed to improve safety and efficiency in mining and industrial applications. The market for heavy-duty trucks is subject to various market dynamics. Economic expansion and freight demand are key drivers, while supply chain disruptions, trade disputes, and raw material shortages can negatively impact the market. Regulatory factors, such as emission regulations and legislative settings, also influence the market's direction. The market for heavy-duty trucks is diverse, with various types of vehicles catering to different industries and applications.
Commercial trailers, logistics vehicles, and truck chassis are essential components of the market. Powertrain systems, telematics systems, and fuel efficiency technologies are critical areas of focus for truck manufacturers. Fleet management systems and real-time tracking solutions are becoming increasingly important In the heavy-duty trucks market. Autonomous driving technology and connectivity technologies are transforming the industry, enabling more efficient and cost-effective transportation solutions. The market for heavy-duty trucks is subject to various challenges, including initial purchase costs, budget constraints, and environmental concerns. Alternative fuel vehicles, such as electric heavy-duty trucks, are gaining popularity due to their lower carbon footprints and improved fuel efficiency.
The market for heavy-duty trucks is dynamic and complex, with various players and stakeholders influencing its direction. The market's growth is driven by the need for efficient and sustainable transportation solutions, as well as regulatory and technological advancements. The market's future looks promising, with numerous opportunities for innovation and growth.
|
Market Scope |
|
|
Report Coverage |
Details |
|
Page number |
203 |
|
Base year |
2024 |
|
Historic period |
2019-2023 |
|
Forecast period |
2025-2029 |
|
Growth momentum & CAGR |
Accelerate at a CAGR of 8.5% |
|
Market growth 2025-2029 |
USD 19.44 billion |
|
Market structure |
Fragmented |
|
YoY growth 2024-2025(%) |
7.7 |
|
Key countries |
Germany, UK, France, Italy, and Rest of Europe |
|
Competitive landscape |
Leading Companies, Market Positioning of Companies, Competitive Strategies, and Industry Risks |
What are the Key Data Covered in this Market Research and Growth Report?
- CAGR of the market during the forecast period
- Detailed information on factors that will drive the market growth and forecasting between 2025 and 2029
- Precise estimation of the size of the market and its contribution of the market in focus to the parent market
- Accurate predictions about upcoming market growth and trends and changes in consumer behaviour
- Growth of the market across Europe
- Thorough analysis of the market's competitive landscape and detailed information about companies
- Comprehensive analysis of factors that will challenge the growth of market companies
We can help! Our analysts can customize this market research report to meet your requirements. Get in touch
 RIA -
RIA - 
