Hemostasis Valve Market Size 2024-2028
The hemostasis valve market size is forecast to increase by USD 77.9 million at a CAGR of 6.6% between 2023 and 2028.
- The market is experiencing significant growth due to the increasing number of cardiovascular surgeries and angioplasty procedures. These medical interventions often result in substantial blood loss, leading to a need for effective hemostasis valves to reduce pain and minimize stainless steel or titanium valve-related complications. Collaborations between market players and healthcare institutions are also driving market growth, as they aim to lower healthcare costs and improve patient outcomes. Stringent regulations ensure the quality and safety of hemostasis valves, further boosting market confidence. The collaboration between medical device companies and healthcare systems to develop advanced hemostasis valves, such as one-handed valves and y-connectors, is also driving market growth. The adoption of advanced five-part hematology systems is another trend contributing to market expansion. Remote patient monitoring, telemedicine, and personalized healthcare are emerging trends in the healthcare sector, driving the need for advanced bleeding control solutions. In summary, the market is witnessing strong growth due to the rising demand for minimally invasive procedures, the need for effective blood management solutions, and collaborative efforts to improve patient care and reduce costs.
What will be the Size of the Market During the Forecast Period?
- The market is a significant segment within the healthcare industry, focusing on devices designed to control and manage bleeding during medical procedures. These devices play a crucial role in various interventions, including endovascular repair, atherosclerosis treatment, and peripheral artery disease management. Hemostasis valves are essential in percutaneous interventions, enabling precise blood flow control during minimally invasive procedures. They are also used in heart valve replacement surgeries and stroke prevention measures. The market is driven by the increasing prevalence of cardiovascular diseases, such as coronary artery disease and heart failure, which necessitate surgical interventions. The demand for hemostasis valves is influenced by healthcare policy and innovation. Surgical robotics and vascular stents have also led to increased utilization of hemostasis valves in complex procedures.
How is this market segmented and which is the largest segment?
The market research report provides comprehensive data (region-wise segment analysis), with forecasts and estimates in "USD million" for the period 2024-2028, as well as historical data from 2018-2022 for the following segments.
- Application
- Angiography
- Angioplasty
- Geography
- North America
- Canada
- US
- Asia
- China
- India
- Europe
- Germany
- Rest of World (ROW)
- North America
By Application Insights
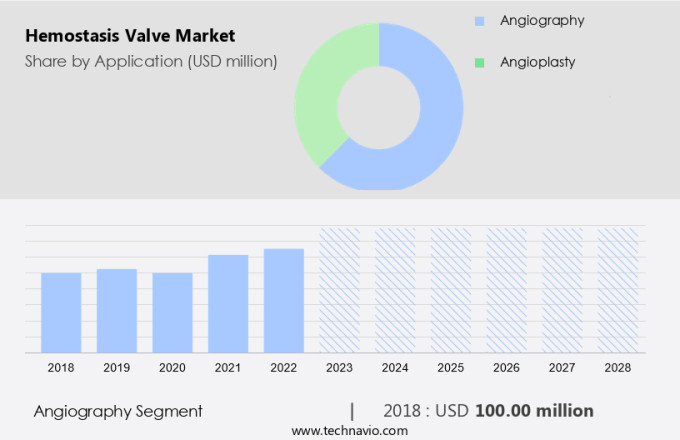
- The angiography segment is estimated to witness significant growth during the forecast period.
The market is primarily driven by the large-scale utilization of these valves in angiography procedures to minimize blood loss. Angiography, a diagnostic medical imaging technique, involves the insertion of a catheter into the blood vessels to examine their internal structure. Hemostasis valves play a crucial role in this process by sealing the puncture site and preventing excessive blood loss.
Further, the market is witnessing several collaborations between key players to innovate and improve the design of hemostasis valves, leading to reduced pain and lower healthcare costs for patients undergoing cardiovascular surgeries such as angioplasty. The increasing prevalence of cardiovascular diseases in the US necessitates the need for effective hemostasis solutions. Advanced hemostasis valve technologies, including enhanced sealing mechanisms and materials that minimize leakage, are contributing to market growth. These technological advancements aim to provide better patient outcomes while reducing the overall cost of healthcare.
Get a glance at the market report of share of various segments Request Free Sample
The angiography segment was valued at USD 100.00 million in 2018 and showed a gradual increase during the forecast period.
Regional Analysis
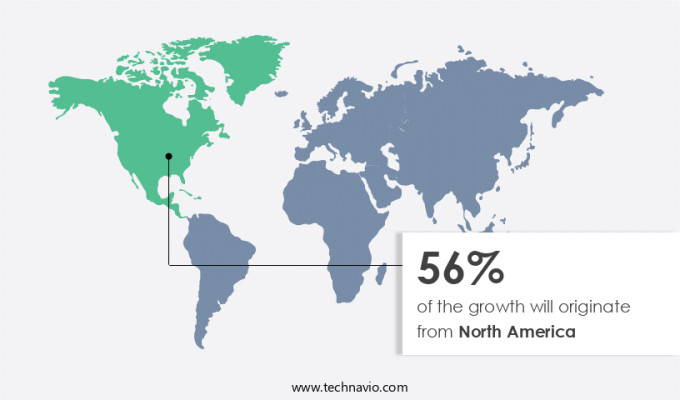
- North America is estimated to contribute 56% to the growth of the global market during the forecast period.
Technavio's analysts have elaborately explained the regional trends and drivers that shape the market during the forecast period.
For more insights on the market share of various regions Request Free Sample
The market in North America is experiencing notable expansion due to substantial investments in healthcare research and testing within the United States. The established distribution network of hemostasis valve manufacturers in countries like the US and Canada, along with their focus on delivering comprehensive hematology solutions, such as automated analyzers, to hospitals and diagnostic centers, is fueling the market's growth. Furthermore, the escalating prevalence of cardiovascular diseases and an aging population in North America are driving the demand for sophisticated medical devices, including hemostasis valves, which play a crucial role in ensuring patient safety during surgical procedures. One-handed hemostasis valves and y-connectors are gaining popularity due to their ease of use and effectiveness in minimizing blood loss during surgeries.
Market Dynamics
Our researchers analyzed the data with 2023 as the base year, along with the key drivers, trends, and challenges. A holistic analysis of drivers will help companies refine their marketing strategies to gain a competitive advantage.
What are the key market drivers leading to the rise in adoption of Hemostasis Valve Market ?
High growth potential in emerging countries is the key driver of the market.
- In the realm of cardiology, hemostasis valves have gained significant traction due to their role in improving patient outcomes during angiographic procedures. Chronic diseases, such as coronary artery disease, continue to pose a considerable health concern in the US, leading to a rise in the number of surgical interventions. This trend is driving the demand for hemostasis valves and tissue sealants, which ensure accessibility to effective solutions for managing bleeding risks. companies are focusing on enhancing the durability of these products to cater to the evolving needs of the medical community. Technological advancements in polymers and other materials have played a pivotal role in the development of next-generation hemostasis valves.
- As the US population ages and the incidence of chronic conditions rises, the need for advanced hemostatic solutions will continue to increase. Infection control remains a critical concern in healthcare settings, further emphasizing the importance of hemostasis valves in ensuring optimal patient care. To cater to the diverse needs of the market, companies are expanding their footprint in emerging economies, including the US, where there is a significant untapped demand for hemostatic agents. The improving healthcare infrastructure and the rising disposable income of consumers are expected to drive demand for these products in the coming years.
What are the market trends shaping the Hemostasis Valve Market?
Increasing adoption of five-part hematology systems is the upcoming trend in the market.
- In the healthcare industry, advanced diagnostic tools play a crucial role in identifying and treating various medical conditions, particularly cardiovascular diseases and minimally invasive surgeries. One such diagnostic instrument is the hemostasis valve, which is used to prevent bleeding during medical procedures. These valves are available in different materials, including polyethylene and polycarbonate. Hospitals and medical centers are significant consumers of hemostasis valves due to the increasing number of surgeries and treatments. A sedentary lifestyle and aging population further contribute to the demand for these valves. Diaphragm valves, a type of hemostasis valve, are widely used due to their reliability and ease of use.
- Five-part hematology analyzers, which use hemostasis valves, provide more comprehensive information on blood composition than three-part analyzers. These instruments differentiate white blood cells into five parts: neutrophils, lymphocytes, basophils, eosinophils, and monocytes. This detailed information is essential for accurate diagnosis and treatment, particularly in oncology and allergy clinics. Three-part instruments are cost-effective and require low maintenance, making them a popular choice for many healthcare facilities. However, the increasing demand for more detailed diagnostic information will drive the growth of the five-part hematology analyzer market during the forecast period. It is important for healthcare providers to consider both cost and diagnostic accuracy when selecting hemostasis valves and analyzers.
What challenges does Hemostasis Valve Market face during the growth?
Stringent regulations is a key challenge affecting the market growth.
- Absorbable hemostatic agents are essential components in catheter-based interventions for preventing thrombosis. These agents are designed to remain in the body after achieving hemostasis, eliminating the need for removal. In the healthcare industry, combining absorbable hemostats with human biologics can enhance their therapeutic efficacy. However, due to the intricacy of these agents and their use with biologics, absorbable hemostats are subjected to stringent regulatory oversight to ensure safety and efficacy.
- In the US, these agents are classified as Class-III medical devices, necessitating a more rigorous and costly approval process, including clinical trials known as premarket approvals (PMAs), before they can be marketed and sold. The importance of patient convenience and sealing capabilities in healthcare systems necessitates the continued innovation and development of advanced absorbable hemostatic agents and coatings.
Exclusive Customer Landscape
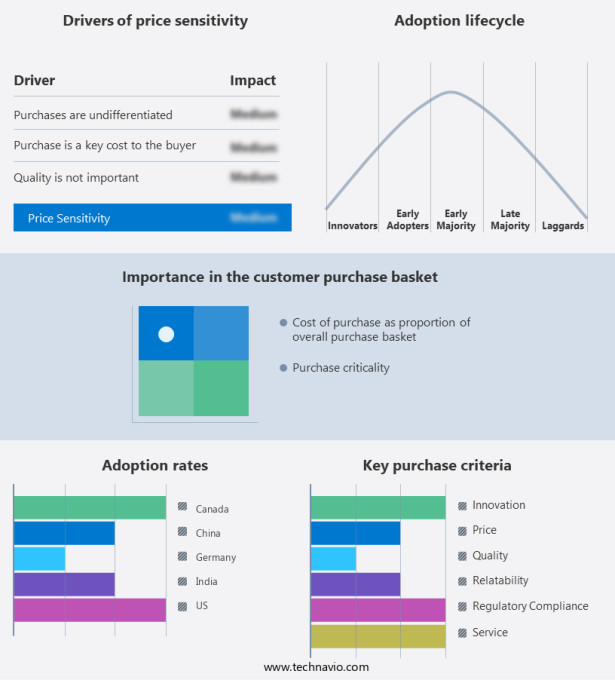
The market forecasting report includes the adoption lifecycle of the market, covering from the innovator's stage to the laggard's stage. It focuses on adoption rates in different regions based on penetration. Furthermore, the market report also includes key purchase criteria and drivers of price sensitivity to help companies evaluate and develop their market growth analysis strategies.
Customer Landscape
Key Companies & Market Insights
Companies are implementing various strategies, such as strategic alliances, market forecast , partnerships, mergers and acquisitions, geographical expansion, and product/service launches, to enhance their presence in the market. The market research and growth report includes detailed analyses of the competitive landscape of the market and information about key companies, including:
- Abbott Laboratories
- Advanced Lifesciences Pvt. Ltd.
- Argon Medical Devices Inc.
- B.Braun SE
- Boston Scientific Corp.
- DeRoyal Industries Inc.
- Freudenberg and Co. KG
- Galt Medical Corp.
- Isla Lab Products LLC
- Lepu Medical Technology Beijing Co. Ltd.
- Merit Medical Systems Inc.
- Qosina Corp.
- Scitech Medical Products SA
- SCW Medicath Ltd.
- Shenzhen Antmed Co. Ltd.
- Suru International Pvt. Ltd.
- Teleflex Inc.
- Terumo Corp.
- Transhealthcare India Pvt. Ltd.
Qualitative and quantitative analysis of companies has been conducted to help clients understand the wider business environment as well as the strengths and weaknesses of key market players. Data is qualitatively analyzed to categorize companies as pure play, category-focused, industry-focused, and diversified; it is quantitatively analyzed to categorize companies as dominant, leading, strong, tentative, and weak.
Research Analyst Overview
The market is witnessing significant growth due to the increasing prevalence of cardiovascular diseases (CVDs) and the rising number of minimally invasive surgeries and treatments. The use of hemostasis valves in cardiovascular surgeries, such as angioplasty and catheterization procedures, helps reduce blood loss and ensure faster recovery times. These valves are made from various materials, including polycarbonate, stainless steel, and titanium, to ensure durability and accessibility. The aging population, sedentary lifestyle, unhealthy diet, and obesity are major factors contributing to the growth of this market. The collaboration between medical device companies and healthcare systems to develop advanced hemostasis valves, such as one-handed valves and y-connectors, is also driving market growth.
Further, technological advancements, such as coatings and polymers, are being used to enhance the sealing capabilities and prevent complications like air embolism and infection. The use of hemostasis valves in surgical procedures, such as endoscopy and cardiac catheterization, is expected to lead to shorter hospital stays and lower healthcare costs. The market is expected to grow further due to the early diagnosis and treatment of CVDs and the increasing demand for patient convenience in medical procedures.
|
Market Scope |
|
|
Report Coverage |
Details |
|
Page number |
157 |
|
Base year |
2023 |
|
Historic period |
2018-2022 |
|
Forecast period |
2024-2028 |
|
Growth momentum & CAGR |
Accelerate at a CAGR of 6.6% |
|
Market Growth 2024-2028 |
USD 77.9 million |
|
Market structure |
Fragmented |
|
YoY growth 2023-2024(%) |
6.1 |
|
Key countries |
US, China, India, Germany, and Canada |
|
Competitive landscape |
Leading Companies, Market Positioning of Companies, Competitive Strategies, and Industry Risks |
What are the Key Data Covered in this Market Research and Growth Report?
- CAGR of the market during the forecast period
- Detailed information on factors that will drive the market growth and forecasting between 2024 and 2028
- Precise estimation of the size of the market and its contribution of the market in focus to the parent market
- Accurate predictions about upcoming market growth and trends and changes in consumer behaviour
- Growth of the market across North America, Asia, Europe, and Rest of World (ROW)
- Thorough analysis of the market's competitive landscape and detailed information about companies
- Comprehensive analysis of factors that will challenge the growth of market companies
We can help! Our analysts can customize this market research report to meet your requirements. Get in touch


