Herbal Medicine Market Size 2026-2030
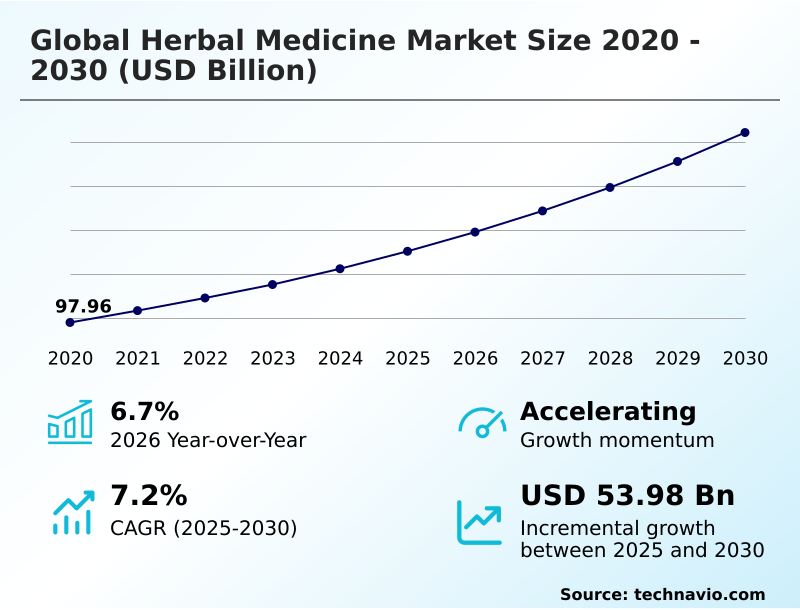
The herbal medicine market size is valued to increase by USD 53.98 billion, at a CAGR of 7.2% from 2025 to 2030. Increasing consumer preference for natural and preventive healthcare will drive the herbal medicine market.
Major Market Trends & Insights
- Asia dominated the market and accounted for a 43.2% growth during the forecast period.
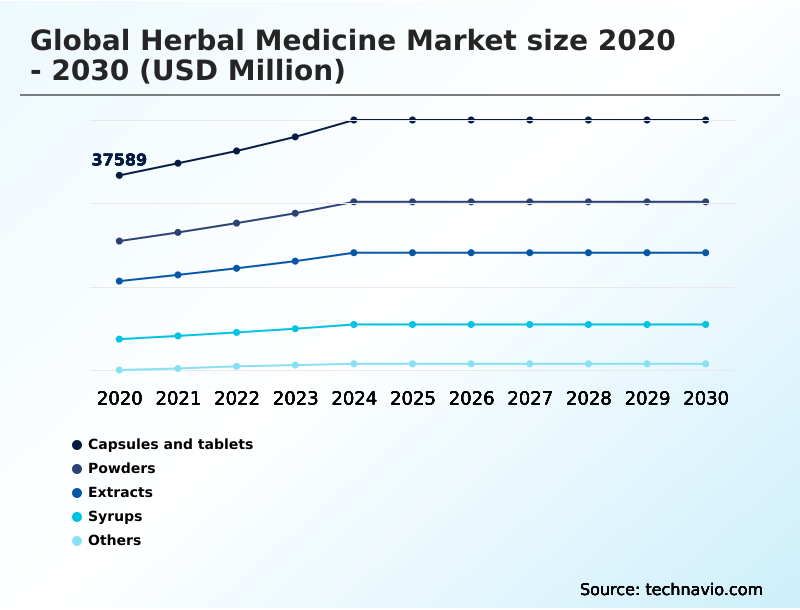
- By Product - Capsules and tablets segment was valued at USD 46.99 billion in 2024
- By Distribution Channel - Hospitals and retail pharmacies segment accounted for the largest market revenue share in 2024
Market Size & Forecast
- Market Opportunities: USD 86.35 billion
- Market Future Opportunities: USD 53.98 billion
- CAGR from 2025 to 2030 : 7.2%
Market Summary
- The herbal medicine market is undergoing a significant evolution, moving beyond traditional medicine systems toward a model that emphasizes clinical trial validation and evidence-based herbalism. This shift is driven by consumer demand for plant-based therapeutics and preventive healthcare solutions that offer a natural remedy efficacy.
- The industry is increasingly focused on herbal supplement manufacturing that adheres to stringent herbal quality control, ensuring product safety and consistency. A key aspect involves the integration of ethnobotanical research with modern science to develop effective herbal immunomodulators and other targeted treatments. However, challenges in botanical ingredient authentication and managing potential herbal drug interactions persist.
- For instance, a typical operational scenario involves implementing a robust botanical raw material sourcing protocol that uses advanced analytical techniques to verify authenticity and screen for contaminants, which is crucial for maintaining brand integrity and meeting phytomedicine regulation standards. This commitment to quality underpins the growing acceptance of phytotherapy for chronic conditions within the broader framework of integrative medicine practice.
What will be the Size of the Herbal Medicine Market during the forecast period?
Get Key Insights on Market Forecast (PDF) Get Free Sample
How is the Herbal Medicine Market Segmented?
The herbal medicine industry research report provides comprehensive data (region-wise segment analysis), with forecasts and estimates in "USD million" for the period 2026-2030, as well as historical data from 2020-2024 for the following segments.
- Product
- Capsules and tablets
- Powders
- Extracts
- Syrups
- Others
- Distribution channel
- Hospitals and retail pharmacies
- E-commerce
- Source
- Leaves
- Roots
- Barks
- Others
- Application
- Pharmaceutical and nutraceutical
- Food and beverages
- Personal care and beauty products
- Variant
- General wellness
- Cardiovascular health
- Gut and digestive health
- Cognitive health
- Others
- Geography
- Asia
- North America
- US
- Canada
- Mexico
- Europe
- Germany
- France
- UK
- Rest of World (ROW)
By Product Insights
The capsules and tablets segment is estimated to witness significant growth during the forecast period.
The capsules and tablets segment is foundational to the herbal medicine market, favored for precision dosing and stability, which are critical for effective herbal pharmacokinetics.
This format supports the integration of standardized herbal extracts into mainstream wellness, meeting consumer demand for convenience and reliability. Innovations in herbal formulation technology, such as enteric coatings for bioavailability enhancement, are advancing the segment.
Firms leveraging these technologies report that the active constituent analysis shows up to a 15% improvement in absorption rates.
This focus on evidence-based herbalism and herbal quality assurance addresses the needs of a discerning public seeking preventive healthcare solutions, solidifying the role of solid dosage forms in both nutraceutical product formulation and integrative medicine practice.
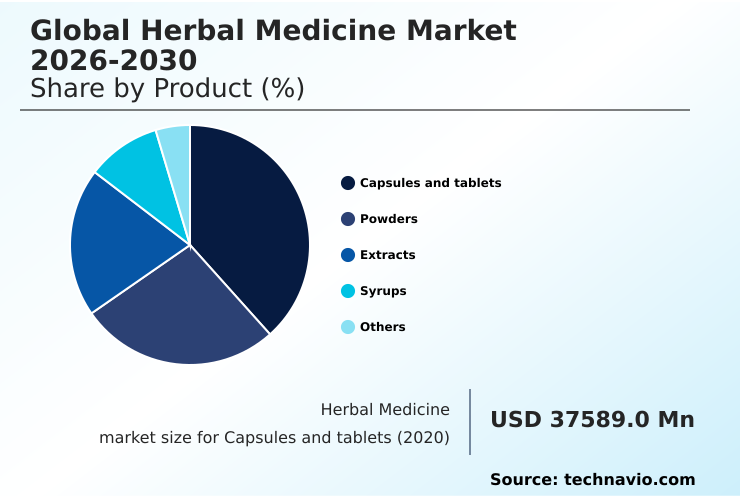
The Capsules and tablets segment was valued at USD 46.99 billion in 2024 and showed a gradual increase during the forecast period.
Regional Analysis
Asia is estimated to contribute 43.2% to the growth of the global market during the forecast period.Technavio’s analysts have elaborately explained the regional trends and drivers that shape the market during the forecast period.

See How Herbal Medicine Market Demand is Rising in Asia Get Free Sample
The geographic landscape of the herbal medicine market is led by Asia, which accounts for over 43% of the incremental growth, largely due to deep-rooted traditional medicine systems and supportive government policies fostering medicinal plant cultivation.
North America follows, contributing over 30%, driven by consumer demand for therapeutic herbal products and a robust retail environment for dietary supplements. Europe is characterized by stringent phytomedicine regulation, which promotes high-quality evidence-based phytotherapy.
Across these regions, the emphasis on herbal product stability testing and a holistic wellness approach is universal.
Successful market entry often depends on navigating regulatory compliance for botanicals and establishing a transparent herbal medicine supply chain, ensuring product safety and meeting consumer expectations for natural remedy efficacy.
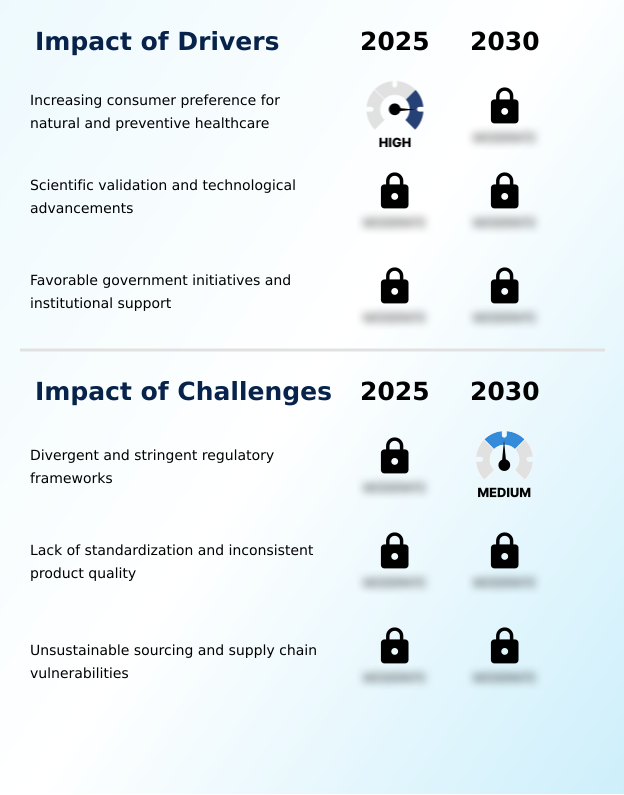
Market Dynamics
Our researchers analyzed the data with 2025 as the base year, along with the key drivers, trends, and challenges. A holistic analysis of drivers will help companies refine their marketing strategies to gain a competitive advantage.
- The growing body of research into the clinical applications of herbal medicine is broadening its scope and credibility. Studies on the efficacy of curcumin for inflammation and the benefits of ginkgo biloba for cognitive enhancement are paving the way for more targeted therapeutic uses.
- Similarly, the standardization of botanical dietary supplements is crucial for products like saw palmetto for prostate wellness and black cohosh for menopausal symptoms, ensuring consistent dosage and effect. The market is also addressing specific wellness needs, with valerian root extract for sleep and milk thistle for liver detoxification gaining mainstream acceptance.
- Research into the ashwagandha extract impact on cortisol levels highlights the role of herbal adaptogens and stress response management. However, understanding potential st. john's wort drug interactions and the pharmacokinetics of plant-based compounds remains a critical area for patient safety. The focus on quality control in herbal manufacturing, including validating turmeric bioavailability with piperine, is paramount.
- Companies investing in clinical trials on botanical medicines for conditions like digestive health, supported by sustainable harvesting of medicinal plants, see over a 50% greater acceptance rate from healthcare practitioners. The use of echinacea purpurea for immune support and exploring bioactive compounds in green tea continue to be popular areas.
- Furthermore, the regulatory pathways for herbal drugs are evolving, influencing strategies for everything from herbal medicine in integrative oncology to the commercialization of new plant-based remedies.
What are the key market drivers leading to the rise in the adoption of Herbal Medicine Industry?
- A significant driver for the market is the increasing consumer preference for natural products and a proactive, preventive approach to healthcare.
- Market growth is significantly driven by a consumer shift toward preventive healthcare solutions and increasing scientific validation of plant-derived active ingredients.
- The demand for natural remedy efficacy is compelling manufacturers to invest in clinical trial validation, with products backed by robust data seeing a 50% higher adoption rate in professional channels.
- Government support, particularly through favorable phytomedicine regulation, is also a critical catalyst, in some cases reducing time-to-market by over six months. This environment fosters innovation in areas like herbal immunomodulators and adaptogens for stress.
- The focus on active constituent analysis and standardized herbal extracts is enhancing product credibility, bridging the gap between traditional medicine systems and modern healthcare demands for effective plant-based therapeutics and ethnomedicine.
What are the market trends shaping the Herbal Medicine Industry?
- The rise of hyper-personalization, driven by digital integration, is an influential upcoming market trend. This shift moves the industry toward data-driven, individualized wellness solutions.
- Key trends are reshaping the market, led by hyper-personalization and supply chain transparency. The integration of AI for personalized herbal nutrition is enabling the development of bespoke herbal anti-inflammatory agents and botanical nootropics, with platforms reporting up to a 40% higher customer retention rate.
- Concurrently, the use of blockchain for the herbal medicine supply chain provides immutable proof of sustainable sourcing practices and authenticity, reducing verification costs by over 20%. This push for evidence-based herbalism is also driving the mainstreaming of phytotherapy for chronic conditions.
- These advancements in herbal formulation technology are critical for producing effective, consumer-trusted products that align with the demand for a holistic wellness approach and clean label ingredients.
What challenges does the Herbal Medicine Industry face during its growth?
- The presence of divergent and stringent regulatory frameworks across various geographies poses a key challenge to industry growth and international trade.
- Significant challenges constrain the market, primarily stemming from inconsistent regulatory frameworks and a lack of product standardization. Navigating the disparate requirements for regulatory compliance for botanicals across regions can add an average of 18 months to international launch timelines.
- The absence of universal herbal monographs for herbal safety assessment contributes to batch-to-batch potency variations of up to 30%, undermining consumer trust and complicating herbal drug interaction screenings. Furthermore, unsustainable botanical raw material sourcing and wildcrafting sustainability issues pose long-term risks to the supply of plant-derived active compounds.
- Addressing these hurdles through harmonized herbal pharmacokinetics testing and robust botanical ingredient authentication is crucial for future growth.
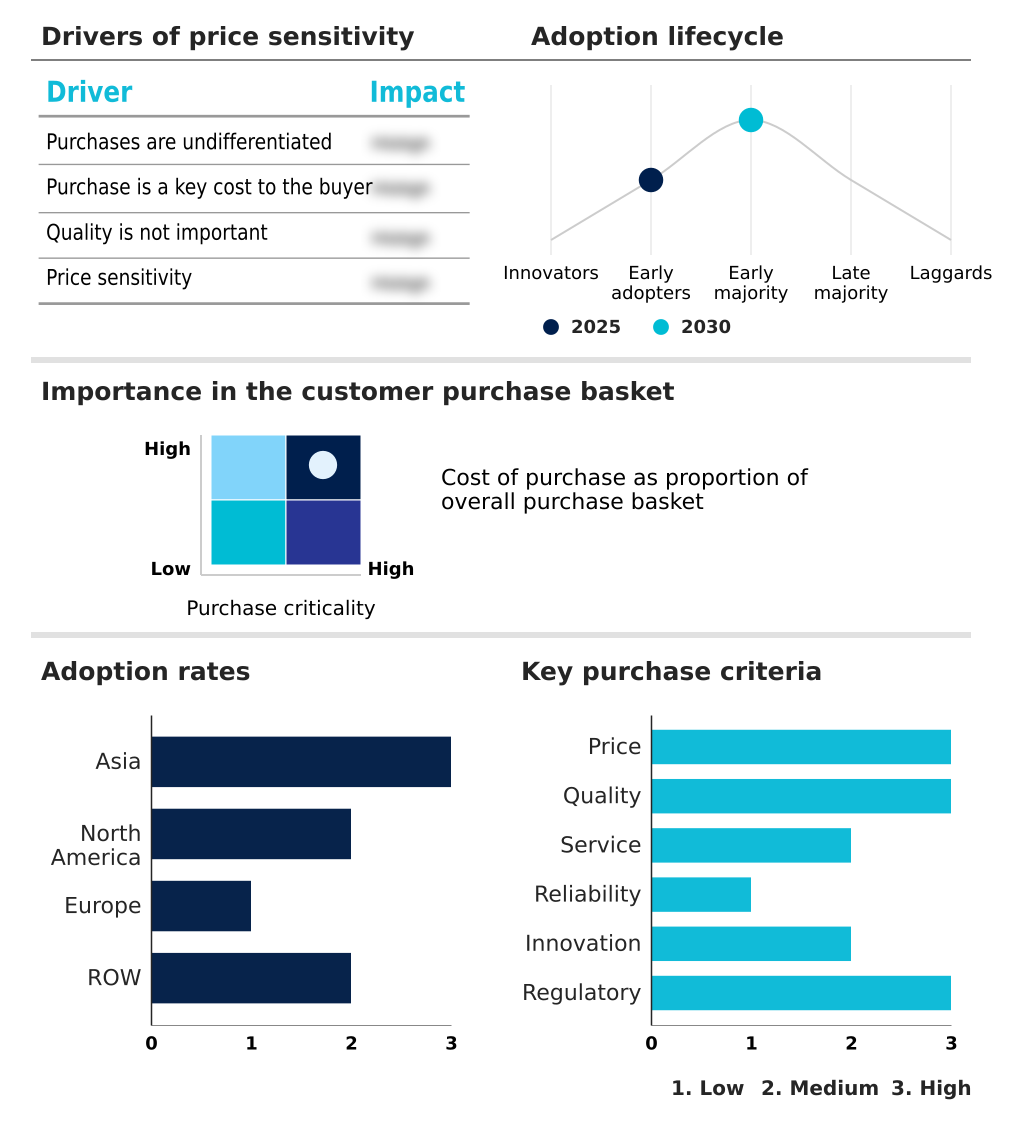
Exclusive Technavio Analysis on Customer Landscape
The herbal medicine market forecasting report includes the adoption lifecycle of the market, covering from the innovator’s stage to the laggard’s stage. It focuses on adoption rates in different regions based on penetration. Furthermore, the herbal medicine market report also includes key purchase criteria and drivers of price sensitivity to help companies evaluate and develop their market growth analysis strategies.
Customer Landscape of Herbal Medicine Industry
Competitive Landscape
Companies are implementing various strategies, such as strategic alliances, herbal medicine market forecast, partnerships, mergers and acquisitions, geographical expansion, and product/service launches, to enhance their presence in the industry.
A Vogel AG - Core offerings include phytopharmaceutical drugs, standardized herbal extracts for targeted therapies, and traditional remedies like Ayurvedic and TCM formulations for holistic wellness.
The industry research and growth report includes detailed analyses of the competitive landscape of the market and information about key companies, including:
- A Vogel AG
- Bionorica SE
- Blackmores Ltd.
- Charak Pharma Pvt. Ltd.
- Dabur India Ltd.
- Gaia Herbs Inc.
- Hamdard Laboratories India
- Herbalife International Inc.
- Hishimo Pharmaceuticals
- MediHerb Pty Ltd
- Patanjali Ayurved Ltd.
- Ricola Group AG
- Sanofi SA
- Sido Muncul
- The Himalaya Drug Co.
- Traditional Medicinals
- Tsumura and Co.
- Weleda
- Willmar Schwabe GmbH and Co. KG
- ZeinPharma Germany GmbH
Qualitative and quantitative analysis of companies has been conducted to help clients understand the wider business environment as well as the strengths and weaknesses of key industry players. Data is qualitatively analyzed to categorize companies as pure play, category-focused, industry-focused, and diversified; it is quantitatively analyzed to categorize companies as dominant, leading, strong, tentative, and weak.
Recent Development and News in Herbal medicine market
- In January 2025, Himalaya Wellness Company introduced a new line of standardized botanical extracts specifically formulated to support cardiovascular and metabolic health, marking a strategic move toward targeted therapeutic applications.
- In March 2025, Danone S.A. launched a new line of functional beverages infused with adaptogenic herbs, such as ashwagandha and rhodiola, targeting mainstream retail channels in North America and Europe.
- In July 2025, the U.S. National Center for Complementary and Integrative Health, in partnership with the Mayo Clinic, announced the initiation of a large-scale, multi-year clinical trial to investigate the efficacy of a standardized curcumin extract for adjunctive arthritis management.
- In September 2025, Kaiser Permanente announced a pilot program across its California clinics to formally incorporate a select formulary of TGA-approved herbal products into its pain management and mental wellness pathways.
Dive into Technavio’s robust research methodology, blending expert interviews, extensive data synthesis, and validated models for unparalleled Herbal Medicine Market insights. See full methodology.
| Market Scope | |
|---|---|
| Page number | 337 |
| Base year | 2025 |
| Historic period | 2020-2024 |
| Forecast period | 2026-2030 |
| Growth momentum & CAGR | Accelerate at a CAGR of 7.2% |
| Market growth 2026-2030 | USD 53982.7 million |
| Market structure | Fragmented |
| YoY growth 2025-2026(%) | 6.7% |
| Key countries | China, India, Japan, South Korea, Thailand, Indonesia, US, Canada, Mexico, Germany, France, UK, Spain, Italy, The Netherlands, Brazil, South Africa, Argentina, UAE, Colombia, Turkey, Saudi Arabia and Israel |
| Competitive landscape | Leading Companies, Market Positioning of Companies, Competitive Strategies, and Industry Risks |
Research Analyst Overview
- The herbal medicine market is defined by a strategic shift from traditional ethnopharmacology toward rigorous scientific validation. Central to this evolution is the implementation of phytochemical standardization and advanced herbal formulation technology to ensure consistent product efficacy.
- The industry prioritizes botanical ingredient authentication, using methods like high-performance liquid chromatography (hplc) and dna barcoding for botanicals, which is essential for herbal product quality control and mitigating risks. This focus on quality is a key boardroom consideration, as investment in clinical trial validation and herbal toxicology studies directly impacts market access under tightening phytomedicine regulation.
- For instance, companies adopting good agricultural practices (gap) for medicinal plant cultivation have achieved a 25% improvement in raw material consistency. The development of plant-based therapeutics now involves sophisticated techniques such as supercritical fluid extraction and nano-encapsulation of extracts for bioavailability enhancement. Understanding herbal pharmacokinetics, herbal pharmacodynamics, and potential herbal drug interactions is critical for herbal safety assessment.
- This convergence of traditional chinese medicine (tcm), ayurvedic formulation principles, and evidence-based phytotherapy is creating a new paradigm in healthcare, supported by detailed herbal monographs and a commitment to wildcrafting sustainability and the sourcing of plant-derived active compounds.
What are the Key Data Covered in this Herbal Medicine Market Research and Growth Report?
-
What is the expected growth of the Herbal Medicine Market between 2026 and 2030?
-
USD 53.98 billion, at a CAGR of 7.2%
-
-
What segmentation does the market report cover?
-
The report is segmented by Product (Capsules and tablets, Powders, Extracts, Syrups, and Others), Distribution Channel (Hospitals and retail pharmacies, and E-commerce), Source (Leaves, Roots, Barks, and Others), Application (Pharmaceutical and nutraceutical, Food and beverages, and Personal care and beauty products), Variant (General wellness, Cardiovascular health, Gut and digestive health, Cognitive health, and Others) and Geography (Asia, North America, Europe, Rest of World (ROW))
-
-
Which regions are analyzed in the report?
-
Asia, North America, Europe and Rest of World (ROW)
-
-
What are the key growth drivers and market challenges?
-
Increasing consumer preference for natural and preventive healthcare, Divergent and stringent regulatory frameworks
-
-
Who are the major players in the Herbal Medicine Market?
-
A Vogel AG, Bionorica SE, Blackmores Ltd., Charak Pharma Pvt. Ltd., Dabur India Ltd., Gaia Herbs Inc., Hamdard Laboratories India, Herbalife International Inc., Hishimo Pharmaceuticals, MediHerb Pty Ltd, Patanjali Ayurved Ltd., Ricola Group AG, Sanofi SA, Sido Muncul, The Himalaya Drug Co., Traditional Medicinals, Tsumura and Co., Weleda, Willmar Schwabe GmbH and Co. KG and ZeinPharma Germany GmbH
-
Market Research Insights
- The market's dynamism is driven by a pronounced shift toward a holistic wellness approach, where consumer wellness trends increasingly favor clean label ingredients. This pivot toward natural products is reshaping nutraceutical product formulation and functional food fortification.
- For example, firms that have achieved non-gmo project verified status for their organic herbal supplements report a 20% higher rate of consumer trust and repeat purchases compared to non-verified competitors. Furthermore, the integration of therapeutic herbal products into mainstream channels is accelerating, with online platforms that provide robust herbal quality assurance seeing 30% greater sales growth than those without.
- This focus on transparency and quality is essential for navigating dietary supplement regulation and capturing market share.
We can help! Our analysts can customize this herbal medicine market research report to meet your requirements.
 RIA -
RIA - 
