Herring Market Size 2024-2028
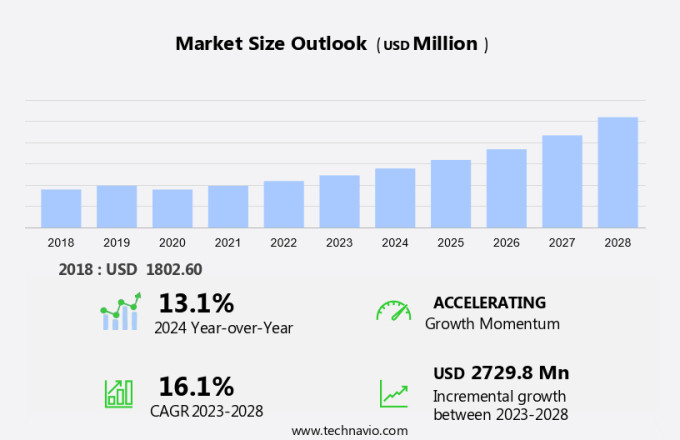
The herring market size is forecast to increase by USD 2.73 billion at a CAGR of 16.1% between 2023 and 2028.
- The market is experiencing significant growth due to increasing consumer interest in preservative-free, nutrient-rich seafood options. This trend is particularly noticeable among athletes and bodybuilders, who value the omega-3 fatty acids found in herring for their role in muscle recovery and overall health. Flexitarianism, a dietary trend that focuses reducing meat consumption without eliminating it entirely, is also driving demand for herring and other sustainable seafood choices. Restaurants and hotels are responding to this trend by offering more herring dishes, including sushi and smoked herring. Online sales of seafood are also on the rise, making it easier for consumers to access herring regardless of their location.
- Moreover, the market is influenced by price fluctuations, with sustainable fishing practices becoming increasingly important to maintain a stable supply and meet consumer demand. Key players in the market are focusing on sustainable fishing practices and innovative processing techniques to meet the evolving needs of consumers. Herring roe, a delicacy in many cuisines, is also gaining popularity due to its unique taste and nutritional benefits. Overall, the market is poised for continued growth as consumers seek out healthy, sustainable seafood options.
What will be the Size of the Market During the Forecast Period?
- The market is a significant segment of the global seafood industry, known for its rich nutritional value and versatility. Herring is a popular fish species consumed in various forms, including fresh, canned, smoked, and pickled. This article provides an in-depth analysis of the market, focusing on its trends, health benefits, and industry developments. Herring is a valuable source of Omega-3 fatty acids, which are essential nutrients for maintaining a healthy lifestyle. Consumption of herring has been linked to reduced triglyceride levels and improved heart health.
- Furthermore, herring is an excellent option for children, as it provides essential nutrients for their growth and development. The market is witnessing several trends, including the increasing demand for sustainable seafood choices and the growing popularity of online fish shopping. Seafood industry trends indicate that consumers are becoming more conscious of the health benefits of seafood and are looking for ways to reduce mercury intake. As a result, herring, with its low mercury content, is gaining popularity. The production of herring feed is another significant aspect of the market. The use of sustainable and eco-friendly feed sources is becoming increasingly important to meet the growing demand for sustainable seafood.
- Additionally, advancements in seafood packaging technology are ensuring that herring remains fresh during transportation and storage, thereby enhancing its shelf life. The health benefits of herring extend beyond human consumption. It is also used as bait in fishing and is an essential ingredient in various healthy seafood recipes. Herring oil is also used as a dietary supplement, providing numerous health benefits, including improved brain function and reduced inflammation. The market is also witnessing technological advancements in seafood processing and safety. Seafood safety tips are becoming increasingly important to ensure the safety and quality of herring products. Moreover, seafood sustainability certification is gaining importance to ensure that herring is sourced responsibly and sustainably.
- In conclusion, the market is an essential segment of the global seafood industry, offering numerous health benefits and diverse applications. The market is witnessing several trends, including the increasing demand for sustainable seafood choices and the growing popularity of online fish shopping. Furthermore, advancements in seafood processing and safety, as well as the use of sustainable feed sources, are enhancing the market's growth prospects.
How is this market segmented and which is the largest segment?
The market research report provides comprehensive data (region-wise segment analysis), with forecasts and estimates in "USD billion" for the period 2024-2028, as well as historical data from 2018-2022 for the following segments.
- Type
- Atlantic herring
- Pacific herring
- Others
- Geography
- Europe
- Norway
- Denmark
- North America
- Canada
- US
- APAC
- China
- India
- Japan
- South Korea
- South America
- Middle East and Africa
- Europe
By Type Insights
- The Atlantic herring segment is estimated to witness significant growth during the forecast period.
Atlantic herring, an abundant fish species, inhabits various North Atlantic water bodies including the Gulf of Maine, the Gulf of St. Lawrence, the Bay of Fundy, and others. The fishing season for this species is generally year-round. Key buyers in the market consist of exporters, processors, aquaculture owners, fishmeal manufacturers, and restaurants. However, regulatory interventions such as reduced catch limits pose a challenge to the market. The nutritional value of herring, rich in omega-3 fatty acids, makes it a popular choice among athletes, bodybuilders, and individuals following flexitarian or seafood-inclined diets. Herring roe, or caviar, is a delicacy enjoyed in high-end restaurants and hotels.
Similarly, sustainable fishing practices are increasingly important to consumers, leading to a growing demand for herring sourced from environmentally responsible fisheries. Smoked herring and herring used in sushi are popular prepared forms of this fish. The market for herring is diverse, with applications ranging from food to industrial uses. Exporters play a significant role in the market, supplying herring to various international markets. The market's growth is driven by increasing consumer awareness of the health benefits of omega-3 fatty acids and the growing popularity of seafood in the US diet. In conclusion, the Atlantic the market is a dynamic and diverse industry, with a focus on sustainable fishing practices and meeting the growing demand for nutritious seafood options. Key players in the market include processors, exporters, and restaurants, all working to provide consumers with high-quality, sustainably sourced herring products.
Get a glance at the market report of share of various segments Request Free Sample
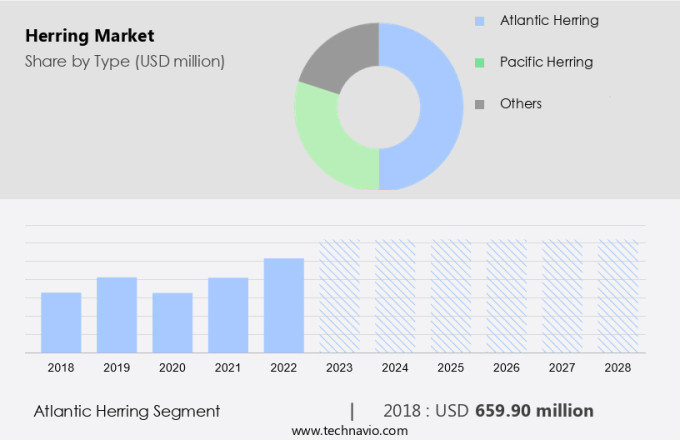
The Atlantic herring segment was valued at USD 659.90 million in 2018 and showed a gradual increase during the forecast period.
Regional Analysis
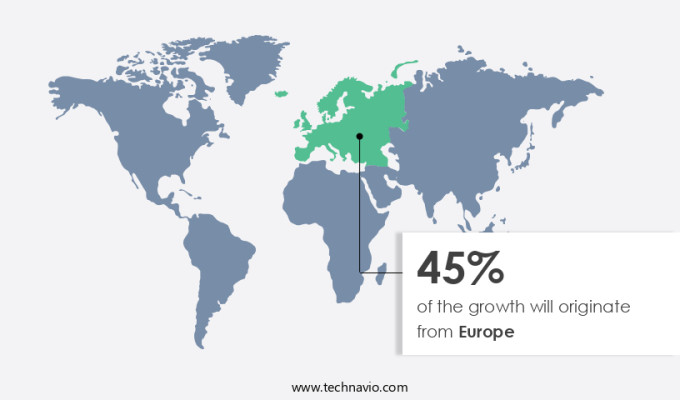
- Europe is estimated to contribute 45% to the growth of the global market during the forecast period.
Technavio's analysts have elaborately explained the regional trends and drivers that shape the market during the forecast period.
For more insights on the market share of various regions Request Free Sample
Herring fish, a rich source of lean protein and essential minerals, is extensively consumed in Europe, particularly in the North Atlantic, Baltic, and North Sea regions. With an abundance of herring in these waters, Europeans have incorporated this fish into their diets for over 2000 years. The Baltic Sea, North Sea, and West Coast of Scotland are the primary areas of herring fish production in Europe. The demand for herring has grown due to its health benefits, leading to an increase in the price of ready-to-eat herring products. Consumers in Europe have shown a preference for sustainable seafood, leading to a growing market for herring.
However, it is essential to ensure the safety of herring products, as mercury accumulation can pose a health risk. To promote sales, coupons and discounts are often offered for ready-to-eat herring products, sauces, and gravies. E-commerce platforms have made it convenient for consumers to purchase herring online, ensuring easy access to this nutritious fish. Selenium, a vital mineral found in herring, helps reduce VLDL levels, making it an excellent choice for those looking to maintain a healthy lifestyle. With its numerous health benefits, the market in Europe is expected to continue its growth trajectory.
Market Dynamics
Our researchers analyzed the data with 2023 as the base year, along with the key drivers, trends, and challenges. A holistic analysis of drivers will help companies refine their marketing strategies to gain a competitive advantage.
What are the key market drivers leading to the rise in adoption of Herring Market?
Rising demand for low-value fish in developing countries is the key driver of the market.
- The global population has reached 8.2 billion by mid-2024, leading to an anticipated doubling of food consumption by 2050. With the availability of arable land decreasing, there is a growing reliance on animal-based foods, including fish, meat, and poultry. The market is poised for significant growth, particularly in developing countries, due to this trend. As health consciousness increases among consumers, there is a greater demand for nutritious and sustainable food sources. Herring, with its high levels of heart-healthy omega-3 fatty acids, vitamins, including Vitamin D, and low mercury levels, is an attractive option. Freezing technologies have made it possible to preserve these nutrients, making herring an ideal choice for health-conscious consumers.
- Moreover, environmental concerns have also influenced consumer preferences, leading to a demand for responsible fishing practices. The use of preservatives in herring processing is a topic of ongoing debate, with some arguing that they can negatively impact the health benefits of the fish. However, many online fish merchants offer herring that is sustainably sourced and minimally processed, ensuring that consumers receive a high-quality product. The health benefits of herring extend beyond its nutritional value. Consumption of herring has been linked to increased levels of HDL, or "good" cholesterol, and a reduced risk of heart disease. As such, the market is expected to continue growing, providing consumers with a delicious and healthy food source.
What are the market trends shaping the Herring Market?
Rising online sales of fish globally is the upcoming trend in the market.
- In the food industry, particularly in the market, the use of enzymes plays a crucial role in extending the shelf life of fresh and marinated herring. Body tissues in herring undergo natural biochemical changes during processing and storage, which can affect the product's quality and safety. To mitigate these challenges, producers employ enzyme treatments to maintain the protein structure and preserve the delicate flavor and texture of the herring. Culinary applications of herring, such as in salads and marinated dishes, have gained popularity due to growing health consciousness among consumers. Hormones naturally present in herring contribute to its nutritional value, making it a sought-after delicacy in various cuisines.
- Further, fishing methods, such as pelagic trawls, ensure the catch is fresh and of high quality. Packaging solutions are essential in maintaining the quality and freshness of herring products. Food service establishments increasingly rely on convenient, ready-to-use options, making it essential for producers to offer marinated and processed herring in attractive and functional packaging. Enzymes play a vital role in the processing and preservation of herring, ensuring the highest quality and safety standards for consumers.
What challenges does Herring Market face during the growth?
Price fluctuations in the global herring market are key challenges affecting the market growth.
- The market in the United States is influenced by various factors, including the prices of raw herring and the demand for sustainably sourced seafood. Small-scale fishermen and aquaculture producers supply a significant portion of the raw herring, while fish manufacturers and online retailers distribute processed varieties. Consumers value herring for its nutritional benefits, such as vitamin D, antioxidants, minerals, and high levels of HDL, making it a popular choice for maintaining bone health. Freezing technology plays a crucial role in preserving the quality and freshness of herring.
- However, despite price fluctuations in raw herring, the market for processed herring has remained stable due to increasing consumer awareness and demand for healthy, sustainably sourced seafood. The size of the herring fish also impacts its market value, with larger fish commanding higher prices. Overall, the market in the US continues to grow, driven by consumer preferences for nutritious, sustainable seafood options.
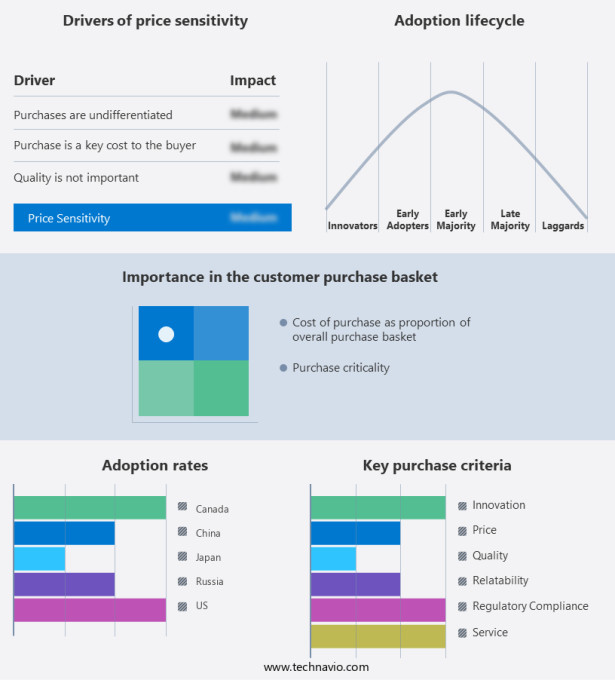
Exclusive Customer Landscape
The market forecasting report includes the adoption lifecycle of the market, covering from the innovator's stage to the laggard's stage. It focuses on adoption rates in different regions based on penetration. Furthermore, the market report also includes key purchase criteria and drivers of price sensitivity to help companies evaluate and develop their market growth analysis strategies.
Customer Landscape
Key Companies & Market Insights
Companies are implementing various strategies, such as strategic alliances, market forecast, partnerships, mergers and acquisitions, geographical expansion, and product/service launches, to enhance their presence in the market.
The market research and growth report includes detailed analyses of the competitive landscape of the market and information about key companies, including:
- AS KURSA
- Barry Group Inc.
- Channel Fish Co. Inc.
- Cornelis Vrolijk
- Denholm Seafoods Ltd.
- Domstein AS
- Esser Haringgroothandel en Rokerij BV
- Haringhandel A. Hoek BV
- Iceland Seafood International
- Kattegat Seafood APS
- Maruha Nichiro Corp.
- Nergard AS
- Nordic Group AS
- NOREBO Holding
- Northbay Pelagic Ltd.
- OSTBALTFISH Ltd.
- Saare Fishexport OU
Qualitative and quantitative analysis of companies has been conducted to help clients understand the wider business environment as well as the strengths and weaknesses of key market players. Data is qualitatively analyzed to categorize companies as pure play, category-focused, industry-focused, and diversified; it is quantitatively analyzed to categorize companies as dominant, leading, strong, tentative, and weak.
Research Analyst Overview
Herring is a popular fish species known for its nutritional value and versatility in various culinary applications. Fresh herring is often used in salads and as a source of lean protein for bodybuilders and athletes. Marinated herring is a delicacy in many European countries and is commonly consumed in restaurants and food service establishments. The preservation of herring is crucial for its long shelf life, with methods including salting, smoking, and freezing. Processing innovations have led to the creation of value-added products such as ready-to-eat herring and flavorful sauces. Health consciousness is a significant consumer value, leading to a growing demand for sustainable fishing practices and low mercury levels in seafood.
In summary, herring is a sustainable seafood option, with pelagic trawls and purse seines being common fishing methods. The nutritional value of herring is notable, with high levels of omega-3 fatty acids, essential minerals, and vitamins such as Vitamin B12 and Vitamin D. These nutrients contribute to heart health, bone health, and antioxidant properties. Packaging solutions and e-commerce platforms have made it convenient for consumers to purchase herring and other seafood online, with discounts and coupons available for added value. Consumer preferences for healthy eating habits and environmental concerns continue to drive the market for herring and other sustainably sourced seafood.
|
Market Scope |
|
|
Report Coverage |
Details |
|
Page number |
173 |
|
Base year |
2023 |
|
Historic period |
2018-2022 |
|
Forecast period |
2024-2028 |
|
Growth momentum & CAGR |
Accelerate at a CAGR of 16.1% |
|
Market growth 2024-2028 |
USD 2.73 billion |
|
Market structure |
Fragmented |
|
YoY growth 2023-2024(%) |
13.1 |
|
Key countries |
US, China, Japan, Canada, Russia, India, Norway, South Korea, Denmark, and The Netherlands |
|
Competitive landscape |
Leading Companies, Market Positioning of Companies, Competitive Strategies, and Industry Risks |
What are the Key Data Covered in this Market Research and Growth Report?
- CAGR of the market during the forecast period
- Detailed information on factors that will drive the market growth and forecasting between 2024 and 2028
- Precise estimation of the size of the market and its contribution of the market in focus to the parent market
- Accurate predictions about upcoming market growth and trends and changes in consumer behaviour
- Growth of the market across Europe, North America, APAC, South America, and Middle East and Africa
- Thorough analysis of the market's competitive landscape and detailed information about companies
- Comprehensive analysis of factors that will challenge the growth of market companies
We can help! Our analysts can customize this market research report to meet your requirements. Get in touch


