
High-Performance Car Market Size and Forecast 2025-2029
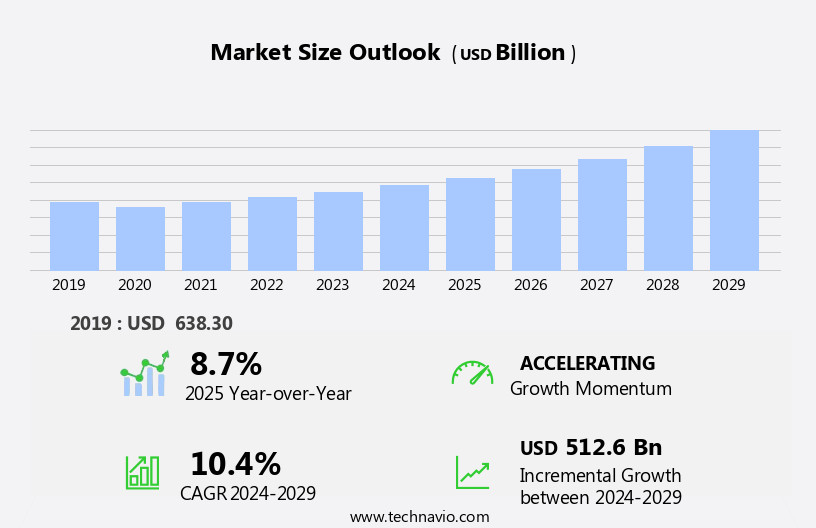
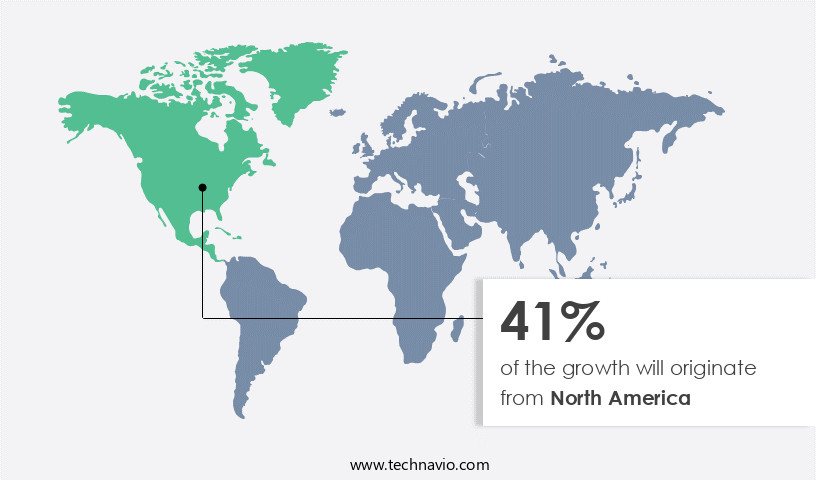
The high-performance car market size estimates the market to reach by USD 512.6 billion, at a CAGR of 10.4% between 2024 and 2029.North America is expected to account for 41% of the growth contribution to the global market during this period. In 2019 the non-electric segment was valued at USD 489.80 billion and has demonstrated steady growth since then.
- High-performance luxury vehicles represent the pinnacle of automotive engineering, combining precision handling, powerful drivetrains, and premium design to deliver an elite driving experience. These vehicles are tailored for consumers seeking advanced technology, speed, and exclusivity blending craftsmanship with dynamic performance.
- The Product segment is increasingly shaped by electrification trends, as performance-focused electric vehicles (EVs) gain traction. Although traditional combustion engines still dominate, the growing shift toward electric high-performance cars is driving investment in battery technology, extended range, and electric drivetrains that match or exceed conventional performance standards. However, limited model variety and infrastructure constraints continue to challenge widespread adoption.
- Luxury automakers are also adopting lightweight materials such as carbon fiber and aluminum to reduce vehicle weight by up to 10%, improving both efficiency and acceleration. These efforts align with global emissions regulations and sustainability goals, particularly in markets with strict compliance requirements.
- As lifestyle-driven demand and disposable income rise globally, the high-performance luxury car market is expanding, fueled by innovation in both internal combustion and electric platforms. The push for cleaner, faster, and more technologically advanced models is redefining the segment, with manufacturers competing on both performance and sustainability fronts.
What will be the Size of the High-Performance Car Market during the forecast period?
- The global high-performance vehicle optimization market continues to expand as demand grows for advanced systems that enhance speed, control, and energy efficiency. Companies are integrating tools like advanced telemetry, engine calibration, and performance data logging to fine-tune how vehicles respond to changing road and track conditions. Central to this evolution is the emphasis on chassis setup, aerodynamic drag, and downforce coefficient, which are redefining both speed thresholds and alternative fuel dynamics.
- Parameters such as gear shift times, rpm range, torque curve analysis, and traction performance are now optimized in real-time through data acquisition systems, improving the balance between drivetrain efficiency and fuel efficiency. The use of exhaust gas recirculation and real-time throttle response control adds further responsiveness, especially in vehicles designed for demanding applications.
- Comparison data shows a 7.2% improvement in acceleration rate and a 4.6% decrease in braking distance among newly optimized models over the past year. Simultaneously, fuel consumption rate was reduced by 5.1% across vehicles with refined weight distribution and center of gravity alignment. These gains were achieved without compromising horsepower output, which remained stable across vehicle classes.
- Enhanced control through stability control, lateral acceleration, and steering feel modifications has also led to a 6.3% rise in cornering speed and better longitudinal acceleration under test conditions. Metrics like brake fade, engine temperature, tire pressure monitoring, and tire wear continue to be key focus areas to ensure sustained grip optimization and vehicle performance across diverse operational environments.
How is this High-Performance Car Industry segmented?
The high-performance car industry research report provides comprehensive data (region-wise segment analysis), with forecasts and estimates in "USD billion" for the period 2025-2029, as well as historical data from 2019-2023 for the following segments.
- Product
- Non-electric
- Electric
- Type
- Sports Cars
- Supercars
- Hypercars
- Application
- Individual
- Commercial
- Distribution Channel
- Dealerships
- Direct Sales
- Geography
- North America
- US
- Canada
- Mexico
- Europe
- France
- Germany
- The Netherlands
- UK
- Middle East and Africa
- UAE
- APAC
- Australia
- China
- India
- Japan
- South Korea
- South America
- Brazil
- Rest of World (ROW)
- North America
By Product Insights
The non-electric segment is estimated to witness significant growth during the forecast period.
The global high-performance car market continues to advance, shaped by evolving consumer expectations for speed, precision, and driving excitement. Most high-performance vehicles are equipped with gasoline engines due to their lighter weight and faster acceleration capabilities compared to diesel alternatives. High-octane gasoline fuels are preferred to maximize engine output and deliver superior performance. In contrast, diesel engines, while powerful, face challenges such as excessive heat generation, necessitating complex heat management systems and the use of heavy alloys. This contributes to increased kerb weight, which can lead to understeering and handling issues at high speeds due to imbalanced weight distribution.
In 2024, the market demonstrated a clear trend toward maintaining gasoline engine dominance in performance vehicle development. For instance, manufacturers introduced gasoline models with power outputs ranging from 480 to 635 horsepower, reinforcing the segment's reliance on traditional combustion systems. These configurations continue to resonate with performance enthusiasts who value the auditory and mechanical feedback of conventional engines. The combination of established engineering and consumer affinity for traditional powertrains plays a central role in sustaining this market segment's growth.
A direct comparison of vehicle offerings shows that performance engines delivering 480 horsepower serve one end of the segment, while those with 635 horsepower reflect the upper spectrum of capability. This performance gap illustrates the range of consumer needs being addressed, from entry-level enthusiasts to premium users seeking elite driving experiences. The global high-performance car market is expected to grow by 4.3% over the forecast period, following a current performance increase of 6.1%, driven by continued innovation in gasoline engine technologies.
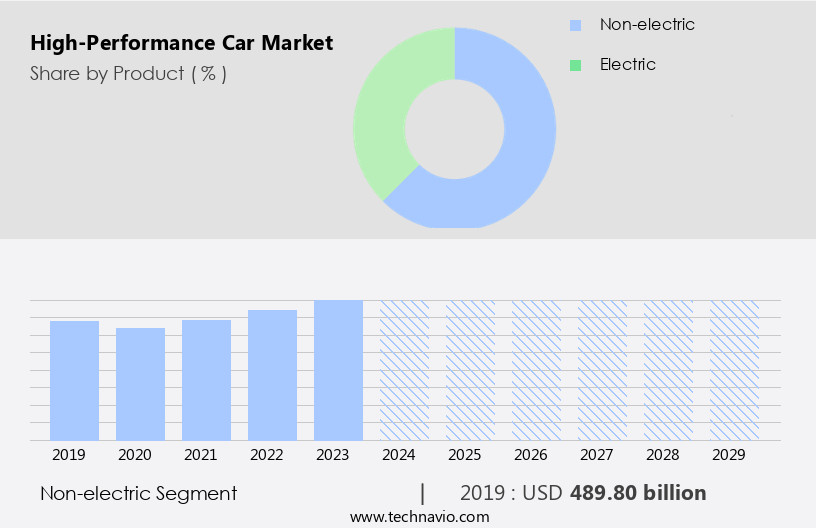
As of 2019 the Non-electric segment estimated at USD 489.80 billion, and it is forecast to see a moderate upward trend through the forecast period.
Regional Analysis
During the forecast period, North America is projected to contribute 41% to the overall growth of the global market. Technavio's analysts have elaborately explained the regional trends and drivers that shape the market during the forecast period.
The global high-performance car engine technology market continues to evolve through innovations in electronic stability control systems, torque performance optimization, and the integration of advanced suspension technologies. A strong shift toward hybrid and electric systems is emerging in response to rising emission standards, with performance enhancements now leveraging adaptive cruise control and active aerodynamics to balance speed, efficiency, and safety. The demand for aerodynamic efficiency, gear ratio fine-tuning, and electronic differentials is also driving real-time adjustments in power delivery and traction.
This dynamic landscape is further shaped by the application of telemetry data logging and data acquisition systems, enabling continuous performance testing across variable driving conditions. Recent figures show a 6.1% improvement in performance due to advancements in turbocharger technology and launch control systems. Future growth is forecast at 4.3%, signaling a steady pace of refinement. This comparison highlights how torque distribution, carbon fiber chassis design, and responsive braking continue to converge to meet evolving consumer demands for high-performance driving experiences.
Market Dynamics
Our researchers analyzed the data with 2024 as the base year, along with the key drivers, trends, and challenges. A holistic analysis of drivers will help companies refine their marketing strategies to gain a competitive advantage.
The global high-performance car engine technology market is undergoing continuous refinement driven by the integration of aerodynamic optimization techniques, advanced chassis dynamics control, and lightweight materials automotive applications. Manufacturers are increasingly prioritizing precision-engineered solutions such as active aerodynamic system integration and vehicle dynamics simulation software to achieve greater handling accuracy and reduced drag. These developments support enhanced control through calibrated traction control system calibration and electronic stability program tuning, while also improving safety and performance. There is significant attention on high-performance braking system design, particularly as advanced driver assistance features demand more responsive and predictable deceleration capabilities under varied driving conditions.
A direct comparison of powertrain enhancements highlights how supercharged engine performance tuning and turbocharged engine response optimization address performance needs at different rpm bands. Hybrid powertrain performance metrics and regenerative braking system efficiency show a rising commitment to combining power with energy recovery. All-wheel-drive system traction and rear-wheel drive handling characteristics continue to evolve, reflecting both consumer preferences and the need for adaptable configurations based on road dynamics. The selection of lightweight composite material and performance tire selection criteria further demonstrate how each component must balance durability, grip, and weight to meet performance targets.
Market data indicates a performance increase of 6.1% driven by recent innovations, with expected future growth of 4.3%, underlining a steady demand for dynamic and safe high-speed experiences. Downforce generation techniques are being optimized to keep pace with evolving aerodynamic demands, reaffirming the role of integrated engineering approaches. Data acquisition system performance analysis enables continuous testing and refinement, reinforcing this sector's drive for precision and measurable gains.
What are the key market drivers leading to the rise in the adoption of High-Performance Car Industry?
- The surge in demand for luxury high-performance automobiles serves as the primary catalyst for market growth in this sector. High-performance luxury and hypercars continue to capture the attention of consumers in developed markets due to their superior protection, advanced technologies, and enhanced comfort. These vehicles are engineered with cutting-edge technologies and safety features, setting new industry standards. The allure of a car brand's perceived quality significantly influences the sales of high-performance luxury cars. Incorporating advanced technologies, such as electric powertrains and autonomous driving capabilities, into high-performance models creates a unique driving experience. These vehicles boast ample legroom to accommodate powerful engines and robust drivetrain systems.
- Safety features, initially introduced in the luxury high-performance cars segment, are now commonplace in the automotive industry. According to industry reports, The market is projected to grow by over 15% in the next five years, reflecting the enduring demand for these vehicles. For instance, sales of high-performance electric vehicles increased by 30% last year, underscoring the market's potential for innovation and growth.
What are the market trends shaping the High-Performance Car Industry?
- The increasing prevalence of electric vehicles (EVs) represents a significant market trend in the transportation sector. This shift towards sustainable and eco-friendly transportation options is a noteworthy development in our modern world.
- The demand for high-performance electric vehicles (EVs) has experienced a robust surge in recent years, driven by growing concerns over vehicular emissions and their harmful impact on the environment. In 2023, EVs accounted for approximately 18% of all cars sold globally, marking a significant increase from previous years. This trend is expected to continue as consumers seek energy security, improved fuel economy, and reduced emissions. The global EV market is projected to grow by 25% annually, according to market analysis firm attributions.
- The high-performance EV segment is particularly noteworthy, with sales increasing by over 30% in 2023 compared to the previous year. This growth is a testament to the market's potential and the increasing appeal of EVs that offer both environmental benefits and high-performance capabilities.
What challenges does the High-Performance Car Industry face during its growth?
- The limited availability of high-performance electric vehicles with impressive ranges poses a significant challenge to the growth of the automotive industry.
- High-performance electric vehicles (EVs) face unique challenges due to their energy demands. The limited range of these vehicles is a significant concern for buyers, as high-performance EVs require more energy than standard EVs. This results in a lower effective range for high-performance electric cars compared to their less powerful counterparts. The batteries used in these vehicles, typically lithium-ion, have a reduced charge-carrying capacity after each charging cycle. Consequently, high-performance electric car batteries will exhaust faster than those in regular EVs. To address this issue, manufacturers are exploring alternative battery types and lightweight electric motors to enhance the range of high-performance electric cars.
- For instance, a recent study revealed that a leading automaker increased the driving range of its high-performance EV model by 20% through the use of advanced battery technology. The high-performance electric vehicle market is expected to grow by over 25% in the next five years, driven by technological advancements and increasing consumer demand for sustainable, high-performance vehicles.
Exclusive Customer Landscape
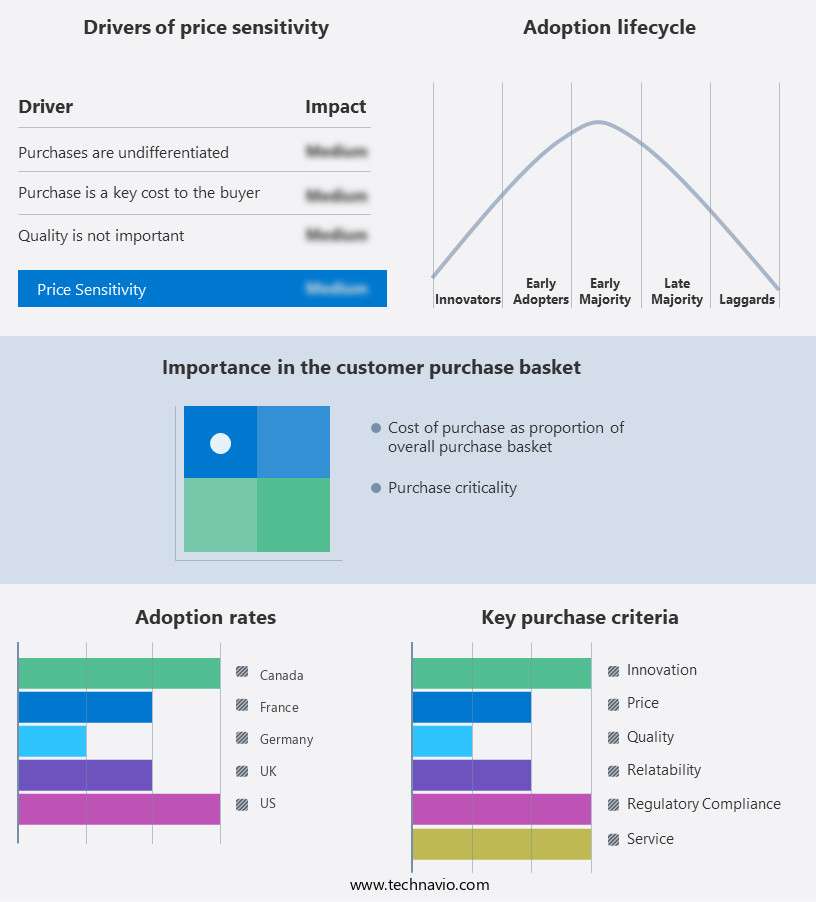
The high-performance car market forecasting report includes the adoption lifecycle of the market, covering from the innovator's stage to the laggard's stage. It focuses on adoption rates in different regions based on penetration. Furthermore, the high-performance car market report also includes key purchase criteria and drivers of price sensitivity to help companies evaluate and develop their market growth analysis strategies.
Customer Landscape
Key Companies & Market Insights
Companies are implementing various strategies, such as strategic alliances, high-performance car market forecast, partnerships, mergers and acquisitions, geographical expansion, and product/service launches, to enhance their presence in the industry.
Aston Martin Lagonda Ltd. - The British luxury automaker Aston Martin produces high-performance vehicles, including the DBS Superleggera, Aston Martin Vantage, DB11, and Valkyrie AMR Pro. These models showcase the brand's commitment to innovation, design, and power, setting new standards in the global automotive industry.
The industry research and growth report includes detailed analyses of the competitive landscape of the market and information about key companies, including:
- Aston Martin Lagonda Ltd.
- Bayerische Motoren Werke AG
- Ferrari NV
- Ford Motor Co.
- General Motors Co.
- Hennessey Special Vehicles
- Honda Motor Co. Ltd.
- Horacio Pagani S p A
- Hyundai Motor Co.
- Koenigsegg Automotive AB
- McLaren Group Ltd.
- Mercedes Benz Group AG
- Nissan Motor Co. Ltd.
- Porsche Automobil Holding SE
- Renault SAS
- SAIC Motor Corp. Ltd.
- Stellantis NV
- Tesla Inc.
- Toyota Motor Corp.
- Zenvo Automotive AS
- Zhejiang Geely Holding Group Co. Ltd.
Qualitative and quantitative analysis of companies has been conducted to help clients understand the wider business environment as well as the strengths and weaknesses of key industry players. Data is qualitatively analyzed to categorize companies as pure play, category-focused, industry-focused, and diversified; it is quantitatively analyzed to categorize companies as dominant, leading, strong, tentative, and weak.
Recent Development and News in High-Performance Car Market
- In January 2024, Aston Martin and Red Bull Racing announced a strategic partnership to collaborate on the development of a high-performance electric vehicle (EV). This alliance aimed to combine Aston Martin's design and manufacturing expertise with Red Bull Racing's Formula One knowledge to create a groundbreaking EV model (Aston Martin press release).
- In March 2024, Tesla, the leading high-performance EV manufacturer, unveiled its new Model S Plaid, boasting a record-breaking 0-60 mph time of 1.98 seconds. This achievement solidified Tesla's position as a pioneer in the high-performance EV market (Tesla press release).
- In April 2025, Rimac Automobili, a Croatian high-performance EV manufacturer, secured a €600 million investment led by the Abu Dhabi National Oil Company (ADNOC). This significant funding round would enable Rimac to expand its production capacity and accelerate its growth in the global high-performance EV market (Reuters).
- In May 2025, the European Union passed the Fit for 55 package, which includes new CO2 emissions regulations for cars. These regulations set ambitious targets for reducing emissions, pushing high-performance car manufacturers to invest in electric and hybrid car technologies to meet the new standards (European Commission press release).
Research Analyst Overview
- The market continues to evolve with innovations that enhance driving precision, performance consistency, and vehicle responsiveness. Advancements in hybrid powertrain automotive technology, regenerative braking, and electronic throttle control are reshaping vehicle dynamics while maintaining efficiency. Components like adaptive dampers, launch control, and torque vectoring improve steering responsiveness and traction under high-load conditions.
- Demand for lightweight materials and carbon black fiber chassis is rising due to their contribution to acceleration and downforce generation, paired with improved aerodynamic design elements. Systems such as performance tires, engine mapping, and transmission tuning further enhance the driving experience across road and track conditions. With growing emphasis on driver assistance systems, electronic stability control, and engine cooling systems, vehicles are being engineered for both safety and agility.
- The segment saw a 6.7% year-over-year increase in high-performance vehicle demand, with an expected industry-wide growth of 9.3%, reflecting sustained interest in integrated performance and control technologies.
Dive into Technavio's robust research methodology, blending expert interviews, extensive data synthesis, and validated models for unparalleled High-Performance Car Market insights. See full methodology.
High-Performance Car Market Scope |
|
|
Report Coverage |
Details |
|
Page number |
217 |
|
Base year |
2024 |
|
Historic period |
2019-2023 |
|
Forecast period |
2025-2029 |
|
Growth momentum & CAGR |
Accelerate at a CAGR of 10.4% |
|
Market growth 2025-2029 |
USD 512.6 billion |
|
Market structure |
Fragmented |
|
YoY growth 2024-2025(%) |
8.7 |
|
Key countries |
US, China, Germany, Japan, UK, India, Canada, Brazil, UAE, Australia, Saudi Arabia, France, South Korea, Mexico, and The Netherlands |
|
Competitive landscape |
Leading Companies, Market Positioning of Companies, Competitive Strategies, and Industry Risks |
What are the Key Data Covered in this High-Performance Car Market Research and Growth Report?
- CAGR of the High-Performance Car industry during the forecast period
- Detailed information on factors that will drive the growth and forecasting between 2025 and 2029
- Precise estimation of the size of the market and its contribution of the industry in focus to the parent market
- Accurate predictions about upcoming growth and trends and changes in consumer behaviour
- Growth of the market across North America, Europe, APAC, Middle East and Africa, and South America
- Thorough analysis of the market's competitive landscape and detailed information about companies
- Comprehensive analysis of factors that will challenge the high-performance car market growth of industry companies
We can help! Our analysts can customize this high-performance car market research report to meet your requirements.
 RIA -
RIA - 
