Home Blood Testing Devices Market Size 2024-2028
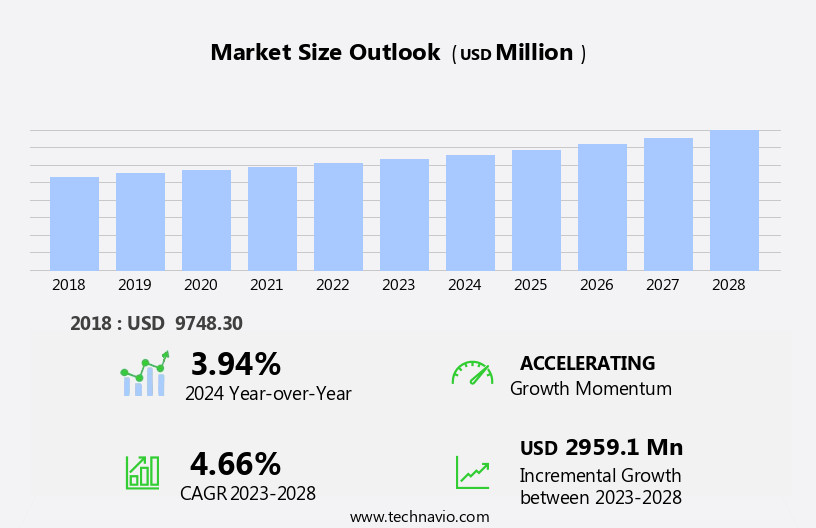
The home blood testing devices market size is forecast to increase by USD 2.96 billion at a CAGR of 4.66% between 2023 and 2028.
- The market is experiencing significant growth due to the increasing prevalence of contagious disease outbreaks and the resulting need for convenient and accessible diagnostic solutions. Technological advancements in home blood testing devices, such as miniaturization, wireless connectivity, and integration of artificial intelligence, are driving innovation and enhancing user experience. However, the market faces a stringent regulatory framework, which requires adherence to rigorous standards for accuracy, safety, and data security. Navigating these regulations can pose a challenge for market entrants, necessitating substantial investment in research and development and regulatory compliance.
- Companies seeking to capitalize on market opportunities must focus on developing user-friendly, accurate, and cost-effective home blood testing devices that meet regulatory requirements and address the evolving needs of consumers and healthcare providers. Effective collaboration with regulatory bodies and strategic partnerships can also help companies streamline the approval process and gain a competitive edge.
What will be the Size of the Home Blood Testing Devices Market during the forecast period?
- The market continues to evolve, driven by advancements in healthcare accessibility and molecular diagnostics. Prescription testing and early detection are key applications, with consumers seeking convenience and control over their health data management. Wearable technology and patient satisfaction are paramount, as diabetes management and patient empowerment gain traction. Infectious disease testing, vitamin D and thyroid testing, pregnancy testing, and fertility testing are common use cases. Regulatory approvals ensure test reliability, while blood coagulation testing and home healthcare expand the market's reach.
- Drug testing, machine learning, remote patient monitoring, and lifestyle modifications are transforming the landscape. Point-of-care diagnostics, mobile health, data analytics, and digital health are integral components, offering personalized medicine and test results interpretation. Artificial intelligence and precision medicine are shaping the future, with test validation, biometric data, test accuracy, and quality assurance ensuring trust and effectiveness. Ongoing clinical trials in consumer healthcare further underscore the market's continuous dynamism.
How is this Home Blood Testing Devices Industry segmented?
The home blood testing devices industry research report provides comprehensive data (region-wise segment analysis), with forecasts and estimates in "USD million" for the period 2024-2028, as well as historical data from 2018-2022 for the following segments.
- Distribution Channel
- Hospital pharmacies
- Online
- Drug stores
- Product Type
- Glucose monitors
- Cholestrol kits
- Coagulation test kits
- Others
- Geography
- North America
- US
- Canada
- Europe
- Germany
- UK
- APAC
- China
- Rest of World (ROW)
- North America
By Distribution Channel Insights
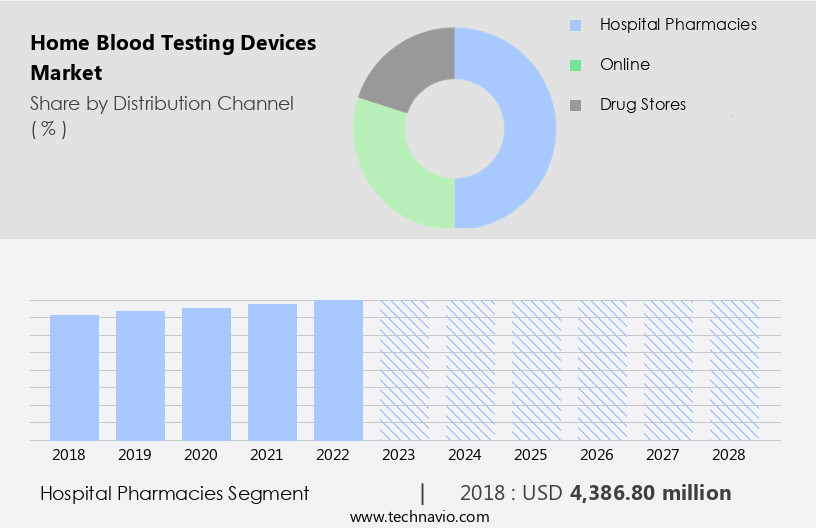
The hospital pharmacies segment is estimated to witness significant growth during the forecast period.
The market is experiencing significant growth due to increased healthcare accessibility and the integration of advanced technologies. Molecular diagnostics and prescription testing enable early detection and disease prevention, while health data management solutions facilitate the efficient organization and analysis of patient information. Wearable technology and remote patient monitoring enable continuous health monitoring, increasing patient satisfaction and empowerment. Infectious disease testing, diabetes management, and thyroid testing are key application areas, with vitamin D, hormone, and cholesterol testing also gaining popularity. Regulatory approvals ensure test reliability and accuracy, allowing for the expansion of point-of-care diagnostics and mobile health solutions.
Machine learning and data analytics enable test results interpretation and personalized medicine, while artificial intelligence and precision medicine drive test validation and test specificity. Blood sample collection and quality assurance are crucial components of the market, ensuring accurate and reliable results. The market is further driven by the integration of biometric data, blood analysis, clinical trials, and consumer healthcare. The hospital pharmacy segment plays a vital role in the market, supplying a range of home blood testing devices and collaborating with healthcare professionals to ensure appropriate testing solutions for patients. The emphasis on disease prevention and patient empowerment is expected to continue driving market growth.
The Hospital pharmacies segment was valued at USD 4.39 billion in 2018 and showed a gradual increase during the forecast period.
Regional Analysis
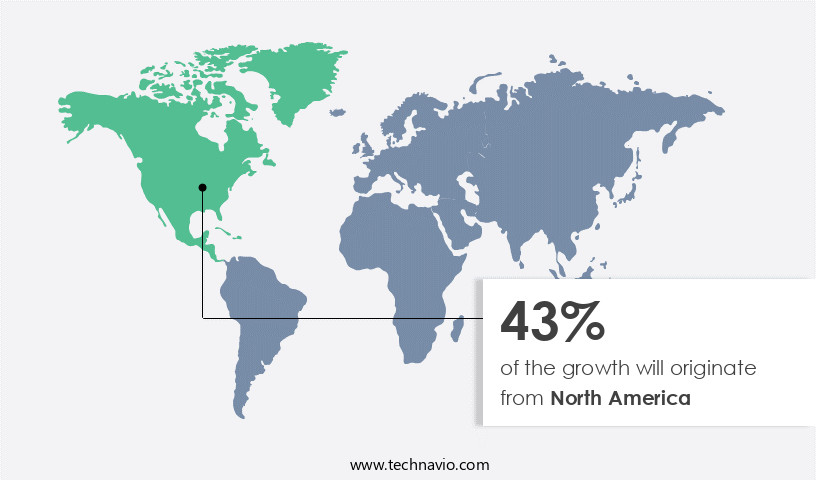
North America is estimated to contribute 43% to the growth of the global market during the forecast period.Technavio’s analysts have elaborately explained the regional trends and drivers that shape the market during the forecast period.
The market in North America is experiencing notable growth due to the increasing prevalence of chronic conditions like diabetes, cardiovascular diseases, and obesity. As of 2023, approximately 37 million Americans are affected by diabetes, driving the demand for home testing solutions for regular health monitoring. Molecular diagnostics and prescription testing play a crucial role in early detection and disease management, especially for chronic conditions. Patient satisfaction is a significant factor influencing market growth, as home testing offers convenience and flexibility. Key players in the region include Bio Rad Laboratories Inc., Danaher Corp., and Thermo Fisher Scientific Inc.
Wearable technology and remote patient monitoring enable continuous health data management, while machine learning and data analytics facilitate test results interpretation and personalized medicine. Regulatory approvals ensure test reliability and accuracy, and home healthcare solutions cater to various testing needs, from infectious disease testing to vitamin D, thyroid, pregnancy, fertility, blood pressure monitoring, and cholesterol testing. Lifestyle modifications and point-of-care diagnostics further enhance disease prevention efforts, while clinical trials and consumer healthcare focus on test validation and sensitivity. Home blood testing devices offer a vital role in healthcare accessibility, empowering patients with their health data and enabling timely intervention for better health outcomes.
Market Dynamics
Our researchers analyzed the data with 2023 as the base year, along with the key drivers, trends, and challenges. A holistic analysis of drivers will help companies refine their marketing strategies to gain a competitive advantage.
What are the key market drivers leading to the rise in the adoption of Home Blood Testing Devices Industry?
- The prevalence of contagious disease outbreaks serves as the primary catalyst for market growth in this sector.
- The market is experiencing significant growth due to the increasing prevalence of disease outbreaks and the subsequent preference for at-home testing. In 2023, several disease outbreaks were reported worldwide, including cholera in countries such as Iraq, Somalia, Sudan, Yemen, and Afghanistan, where around 18,000 cases were reported in Somalia alone. Dengue fever outbreaks were also recorded, with Pakistan reporting over 24,000 cases. Furthermore, there have been numerous cases of Crimean-Congo Hemorrhagic Fever (CCHF) and Marburg virus disease outbreaks. These disease outbreaks have led to a notable shift in patient behavior, with many individuals opting to avoid healthcare facilities due to infection risks.
- Artificial intelligence and precision medicine are playing a crucial role in the advancement of home blood testing devices. These technologies enable test validation, ensuring test accuracy and specificity, even with biometric data collected at home. Home blood testing devices offer quality assurance and health monitoring, making them an attractive alternative to traditional laboratory testing. With the integration of AI and precision medicine, home blood testing devices offer accurate results, convenience, and safety. In conclusion, the increasing number of disease outbreaks and the subsequent preference for at-home testing are driving the growth of the market.
- The integration of artificial intelligence and precision medicine is further enhancing the capabilities of these devices, offering accurate results, convenience, and safety. Home blood testing devices are revolutionizing healthcare by providing individuals with the ability to monitor their health from the comfort of their own homes.
What are the market trends shaping the Home Blood Testing Devices Industry?
- The trend in the home diagnostic market is being driven by technological advancements in home blood testing devices. These innovations enable accurate and convenient health screenings for individuals in the comfort of their own homes.
- Home blood testing devices have gained significant traction in the healthcare industry due to their ability to enhance accessibility and convenience. These devices enable individuals to perform molecular diagnostics, prescription testing, and early detection of various health conditions from the comfort of their homes. The integration of advanced technologies such as AI and machine learning enhances the accuracy of test results, providing users with valuable health data for effective management of chronic conditions like diabetes and thyroid. Moreover, the advent of wearable technology and pregnancy testing kits have further boosted the market's growth. Patient satisfaction is a key driver, as home blood testing empowers individuals to take charge of their health and make informed decisions.
- Infectious disease testing and vitamin D testing are other significant applications of home blood testing devices, offering quick and reliable results. The market's growth is expected to continue as technological advancements make these devices more user-friendly, immersive, and harmonious with digital health platforms.
What challenges does the Home Blood Testing Devices Industry face during its growth?
- The stringent regulatory framework poses a significant challenge to the expansion and growth of the industry.
- The market experiences rigorous regulatory oversight from organizations such as the Food and Drug Administration (FDA) in the US and the European Medicines Agency (EMA) in Europe. These regulatory bodies enforce stringent rules and requirements for medical devices, including home blood testing devices, to ensure safety and efficacy. Manufacturers must conduct extensive clinical trials and studies to secure regulatory approvals, which can be a time-consuming and costly process. Regarding test reliability, regulatory bodies impose strict guidelines. Home blood testing devices must provide accurate and consistent results to be approved for market use. In addition, advancements in technology, such as machine learning and remote patient monitoring, are transforming home healthcare.
- These innovations enable lifestyle modifications, point-of-care diagnostics, and disease prevention through early detection. Furthermore, drug testing applications are gaining popularity in the home setting, offering convenience and privacy. The market dynamics are influenced by the increasing emphasis on disease prevention and the growing trend towards mobile health. These factors contribute to the market's growth and innovation. In conclusion, the regulatory landscape plays a crucial role in shaping the market. Manufacturers must navigate these regulations to bring reliable and effective products to the market while addressing the evolving needs of consumers.
Exclusive Customer Landscape
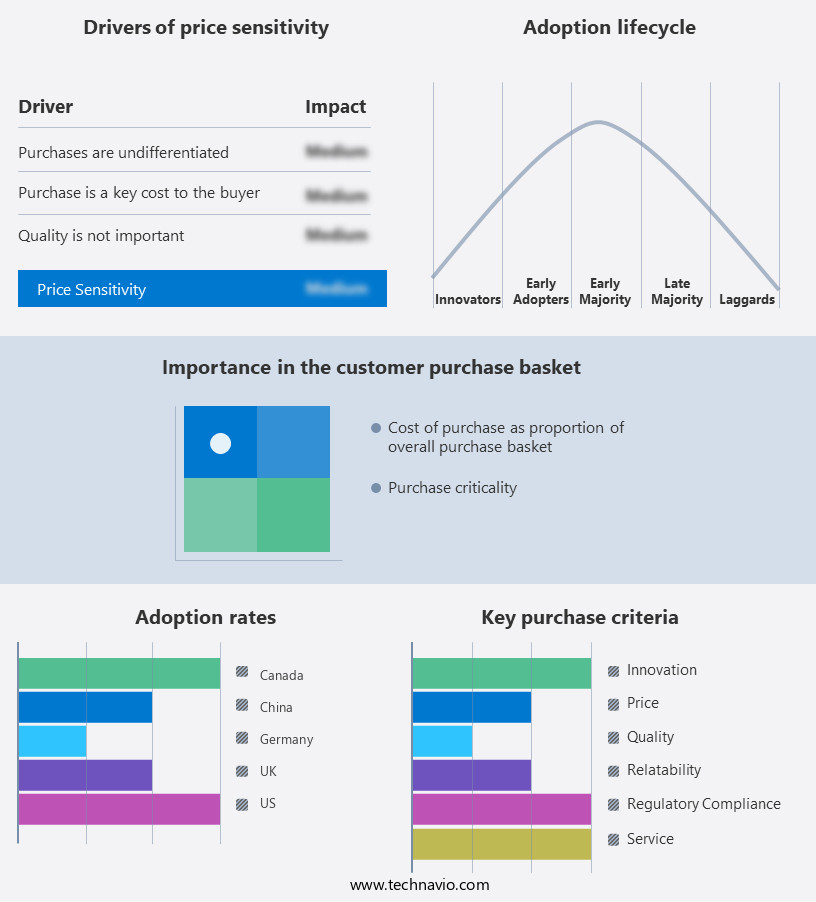
The home blood testing devices market forecasting report includes the adoption lifecycle of the market, covering from the innovator’s stage to the laggard’s stage. It focuses on adoption rates in different regions based on penetration. Furthermore, the home blood testing devices market report also includes key purchase criteria and drivers of price sensitivity to help companies evaluate and develop their market growth analysis strategies.
Customer Landscape
Key Companies & Market Insights
Companies are implementing various strategies, such as strategic alliances, home blood testing devices market forecast, partnerships, mergers and acquisitions, geographical expansion, and product/service launches, to enhance their presence in the industry.
A and D HOLON Holdings Co. Ltd. - The company specializes in providing advanced home blood testing solutions, including the i-STAT Alinity and similar devices. These innovative tools enable users to conduct lab-quality tests from the comfort of their homes, enhancing accessibility and convenience. By leveraging cutting-edge technology, these devices deliver accurate and reliable results, empowering individuals to take charge of their health. With a focus on user-friendliness and ease of use, these home testing solutions contribute significantly to the growing trend of self-diagnostics and telemedicine.
The industry research and growth report includes detailed analyses of the competitive landscape of the market and information about key companies, including:
- A and D HOLON Holdings Co. Ltd.
- Abbott Laboratories
- ARKRAY Inc.
- Becton Dickinson and Co.
- Beurer India Pvt. Ltd.
- Bio Rad Laboratories Inc.
- BioMerieux SA
- Bionime Corp.
- Danaher Corp.
- F. Hoffmann La Roche Ltd.
- i-SENS, Inc.
- LifeScan IP Holdings LLC
- Medaval Ltd
- Microgene Diagnostic Systems Pvt. Ltd.
- Minaris Medical America, Inc.
- Nova Biomedical Corp.
- PixCell Medical Technologies Ltd.
- Thermo Fisher Scientific Inc.
- Trajan Scientific Australia Pty Ltd.
- Truvian Sciences Inc.
Qualitative and quantitative analysis of companies has been conducted to help clients understand the wider business environment as well as the strengths and weaknesses of key industry players. Data is qualitatively analyzed to categorize companies as pure play, category-focused, industry-focused, and diversified; it is quantitatively analyzed to categorize companies as dominant, leading, strong, tentative, and weak.
Recent Development and News in Home Blood Testing Devices Market
- In February 2024, Abbott, a leading healthcare solutions company, introduced the Freestyle Libre Pro Glucose Sensing System, a new home blood testing device for healthcare professionals to monitor their patients' glucose levels more effectively (Abbott, 2024). This innovation offers real-time, continuous glucose monitoring, providing valuable insights for diabetes management.
- In October 2025, Roche Diagnostics and Pfizer entered into a strategic collaboration to develop and commercialize home diagnostic tests for various conditions, including infectious diseases and chronic conditions. This partnership combines Roche's diagnostics expertise with Pfizer's therapeutic offerings, aiming to improve patient care and outcomes through early detection and treatment (Roche Diagnostics, 2025).
- In March 2024, Quidel Corporation, a diagnostic technology company, raised USD130 million in a public offering to fund the expansion of its rapid diagnostic test business, including home blood testing devices. This significant investment will enable Quidel to accelerate product development, increase production capacity, and broaden its market reach (Quidel Corporation, 2024).
- In August 2025, the US Food and Drug Administration (FDA) granted marketing authorization for the Alere Afinion Analyzer, a portable, point-of-care diagnostic device for total testosterone and other analytes. This approval opens up new opportunities for home blood testing, particularly in the area of hormone testing for various conditions, such as hypogonadism and infertility (FDA, 2025).
Research Analyst Overview
The market encompasses a diverse range of products, including drug test kits, allergy test kits, hormone test kits, cholesterol test strips, pregnancy test kits, thyroid test kits, and blood glucose meters. This sector is experiencing significant innovation, driven by the future of healthcare and patient-centric approaches. Self-management tools, such as wearable health trackers and smartphone apps, enable individuals to monitor their health and receive personalized health recommendations. Patient support groups and online retailers are increasingly offering home laboratory testing for various conditions, making testing more accessible. Reimbursement policies and insurance coverage are evolving to accommodate direct-to-consumer testing, further fueling market growth.
Innovation in diagnostics, including digital therapeutics and biomarker analysis, is transforming healthcare. Preventive healthcare is gaining traction, with remote diagnostics and self-testing becoming essential components. The aging population is driving demand for home testing solutions, particularly for chronic disease management and fertility monitoring. Emerging technologies, such as mobile health platforms and health data dashboards, are streamlining healthcare delivery and improving health equity. Lifestyle choices and personalized nutrition are becoming integral components of home testing, with genomic testing offering customized recommendations. Healthcare providers are embracing home testing as part of a holistic approach to care, integrating it with telehealth services and remote monitoring.
The future of healthcare is shifting towards more accessible, affordable, and personalized care, with home blood testing devices playing a pivotal role.
Dive into Technavio’s robust research methodology, blending expert interviews, extensive data synthesis, and validated models for unparalleled Home Blood Testing Devices Market insights. See full methodology.
|
Market Scope |
|
|
Report Coverage |
Details |
|
Page number |
206 |
|
Base year |
2023 |
|
Historic period |
2018-2022 |
|
Forecast period |
2024-2028 |
|
Growth momentum & CAGR |
Accelerate at a CAGR of 4.66% |
|
Market growth 2024-2028 |
USD 2959.1 million |
|
Market structure |
Fragmented |
|
YoY growth 2023-2024(%) |
3.94 |
|
Key countries |
US, Germany, UK, Canada, and China |
|
Competitive landscape |
Leading Companies, Market Positioning of Companies, Competitive Strategies, and Industry Risks |
What are the Key Data Covered in this Home Blood Testing Devices Market Research and Growth Report?
- CAGR of the Home Blood Testing Devices industry during the forecast period
- Detailed information on factors that will drive the growth and forecasting between 2024 and 2028
- Precise estimation of the size of the market and its contribution of the industry in focus to the parent market
- Accurate predictions about upcoming growth and trends and changes in consumer behaviour
- Growth of the market across North America, Europe, Asia, and Rest of World (ROW)
- Thorough analysis of the market’s competitive landscape and detailed information about companies
- Comprehensive analysis of factors that will challenge the home blood testing devices market growth of industry companies
We can help! Our analysts can customize this home blood testing devices market research report to meet your requirements.


