
Home Equity Lending Market Size 2026-2030
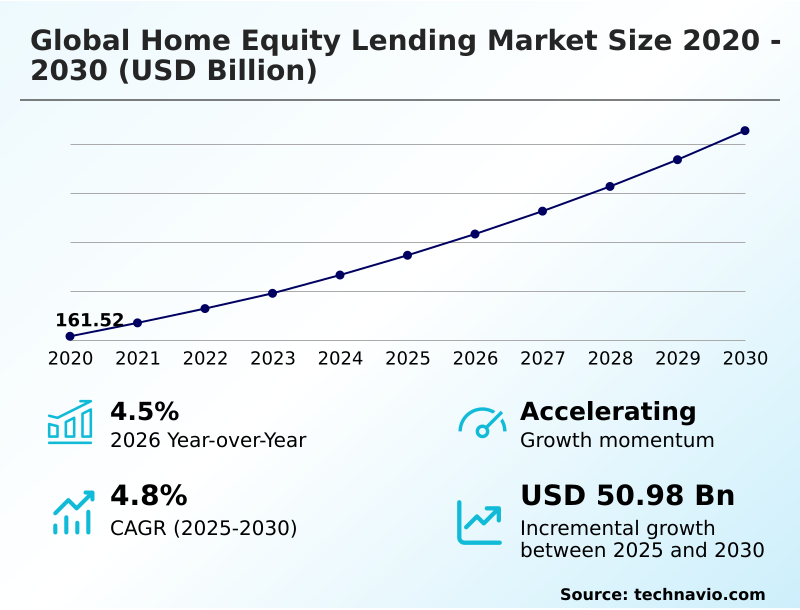
The home equity lending market size is valued to increase by USD 50.98 billion, at a CAGR of 4.8% from 2025 to 2030. Technological integration and digital transformation in lending will drive the home equity lending market.
Major Market Trends & Insights
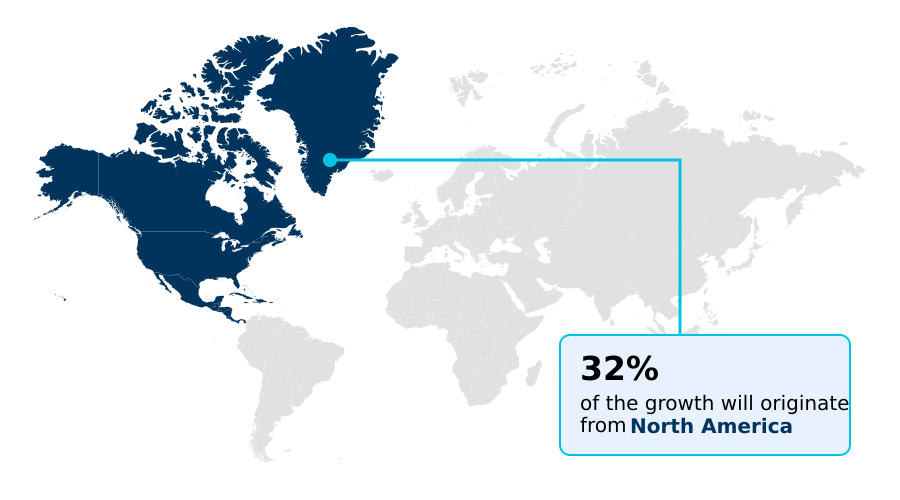
- North America dominated the market and accounted for a 31.8% growth during the forecast period.
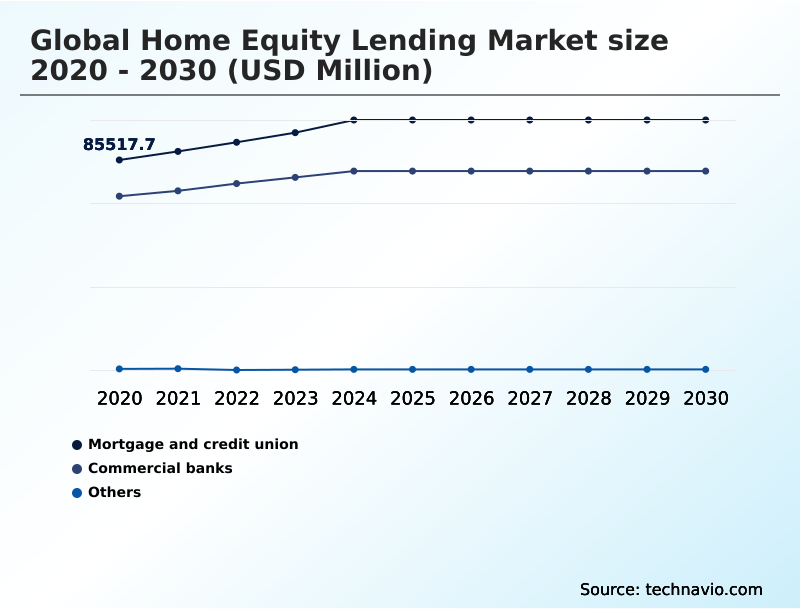
- By Source - Mortgage and credit union segment was valued at USD 101.02 billion in 2024
- By Distribution Channel - Offline segment accounted for the largest market revenue share in 2024
Market Size & Forecast
- Market Opportunities: USD 84.12 billion
- Market Future Opportunities: USD 50.98 billion
- CAGR from 2025 to 2030 : 4.8%
Market Summary
- The home equity lending market facilitates a critical avenue for consumer financing, allowing property owners to leverage their home's equity for various financial needs. This sector, encompassing both home equity line of credit (HELOC) and fixed rate home equity loan options, is integral for funding home improvement financing and debt consolidation financing.
- The market's dynamism is fueled by rising residential property values and the advancement of digital lending platforms. These platforms are revolutionizing the loan origination process, with some lenders utilizing automated underwriting systems to reduce decision times from weeks to days.
- A key business scenario involves the use of AI in credit scoring and automated valuation models for credit risk assessment, which not only expedites borrower creditworthiness analysis but also enhances the accuracy of property equity verification. This technological shift toward financial technology integration addresses consumer demand for speed and convenience while allowing lenders to manage loan portfolio management more effectively.
- The adoption of blockchain technology in lending is also beginning to provide enhanced security and transparency, further shaping the competitive landscape for both commercial bank lending and non-bank financial institutions. This evolution underscores a strategic move towards data-driven operations and personalized financial products.
What will be the Size of the Home Equity Lending Market during the forecast period?
Get Key Insights on Market Forecast (PDF) Get Free Sample
How is the Home Equity Lending Market Segmented?
The home equity lending industry research report provides comprehensive data (region-wise segment analysis), with forecasts and estimates in "USD million" for the period 2026-2030, as well as historical data from 2020-2024 for the following segments.
- Source
- Mortgage and credit union
- Commercial banks
- Others
- Distribution channel
- Offline
- Online
- Product type
- HELOC
- Fixed rate loans
- Geography
- North America
- US
- Canada
- Mexico
- Europe
- UK
- Germany
- France
- APAC
- China
- Australia
- Japan
- South America
- Brazil
- Argentina
- Middle East and Africa
- UAE
- Saudi Arabia
- South Africa
- Rest of World (ROW)
- North America
By Source Insights
The mortgage and credit union segment is estimated to witness significant growth during the forecast period.
The mortgage and credit union segment is defined by specialized expertise and customer-centric innovation in the home equity lending market.
These institutions leverage dedicated digital lending platforms and fintech lending solutions to streamline the mortgage origination process, enhancing efficiency and the borrower experience. By focusing almost exclusively on property-related financing, they offer deep market understanding.
Credit union lending services, in particular, emphasize member relationships and competitive terms for secured homeowner loans and home improvement financing.
Advanced credit risk modeling techniques and borrower creditworthiness analysis based on real-time property data improve loan decisioning, with some institutions reporting a 15% faster pre-qualification turnaround.
This focus on technology and specialized knowledge fosters greater understanding home equity and enables sound home equity investment strategies for consumers.
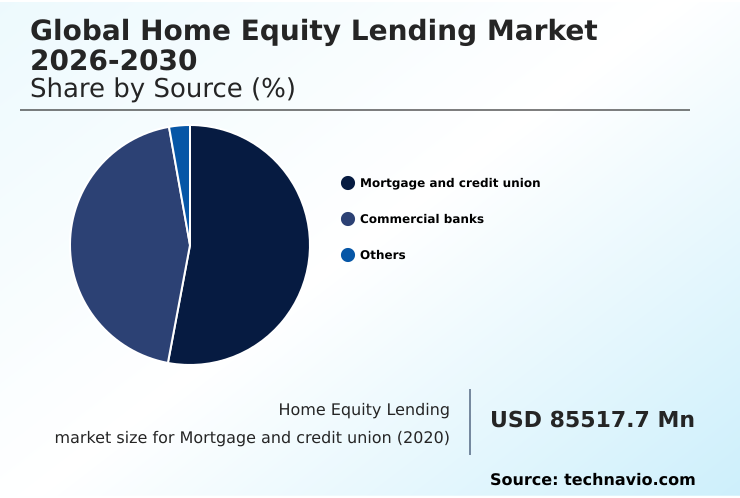
The Mortgage and credit union segment was valued at USD 101.02 billion in 2024 and showed a gradual increase during the forecast period.
Regional Analysis
North America is estimated to contribute 31.8% to the growth of the global market during the forecast period.Technavio’s analysts have elaborately explained the regional trends and drivers that shape the market during the forecast period.
See How Home Equity Lending Market Demand is Rising in North America Get Free Sample
The geographic landscape of the home equity lending market is diverse, with North America contributing over 31% of the incremental growth. This region benefits from mature financial technology integration and high adoption of digital mortgage application processes.
In contrast, the APAC region is forecast to exhibit the fastest expansion, driven by rising property values and increasing consumer awareness of products like variable rate heloc and fixed rate heloc.
Across regions, automated underwriting systems are becoming critical, with adoption in Europe helping reduce loan processing times by up to 30%.
Lenders are navigating varying regulatory environments and home equity credit standards, using advanced property valuation technology to manage loan to value ratio and borrower creditworthiness analysis effectively.
This global adoption of technology is essential for managing risk and capturing opportunities in both established and emerging markets.
Market Dynamics
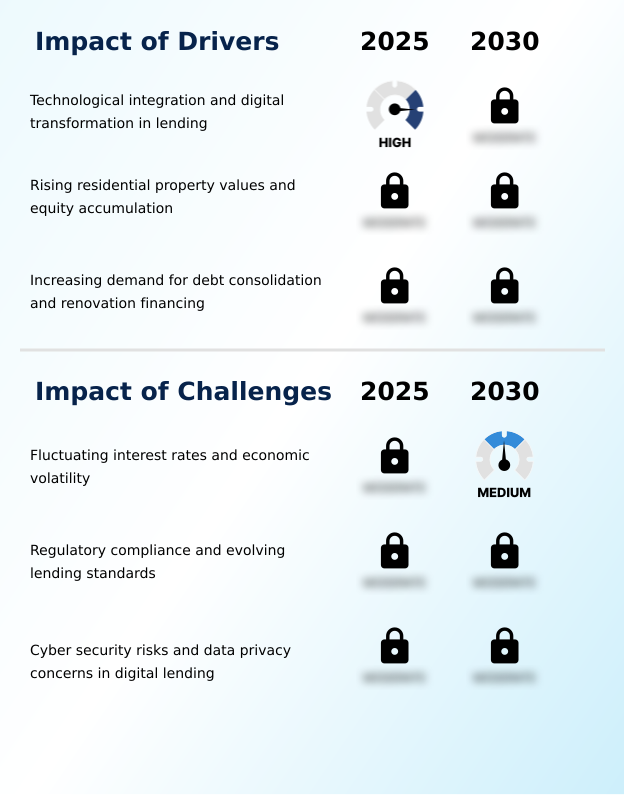
Our researchers analyzed the data with 2025 as the base year, along with the key drivers, trends, and challenges. A holistic analysis of drivers will help companies refine their marketing strategies to gain a competitive advantage.
- The strategic direction of the home equity lending market is increasingly defined by technological sophistication and consumer choice. Lenders are focused on automating the loan origination workflow to enhance efficiency. A critical component is technology's role in property valuation, with advanced models replacing manual appraisals. For consumers, comparing fixed rate vs variable heloc remains a central decision.
- Many are using a heloc for debt consolidation, while others seek to maximize home equity for renovations. The advantages of cash out refinancing also present a viable alternative. Behind the scenes, the impact of AI on loan underwriting speed is profound, with some platforms reducing approval cycles by more than half compared to traditional methods.
- This relies on best practices for credit risk modeling and the ability to assess borrower creditworthiness with AI. The benefits of blockchain for mortgage verification are emerging, promising enhanced security. The future of automated underwriting systems points toward greater personalization. However, compliance challenges in digital lending and digital lending platform security protocols require vigilance.
- For borrowers, navigating the heloc application process and understanding loan to value requirements are key, with some seeking to secure a loan with low documentation. The role of fintech in home equity market grows, often leading innovation, while comparing bank vs credit union helocs is a key choice.
- Managing interest rate risk in helocs and exploring home equity lending for investment properties represent advanced strategies.
What are the key market drivers leading to the rise in the adoption of Home Equity Lending Industry?
- The market is primarily driven by widespread technological integration and the ongoing digital transformation within the lending sector.
- Technological integration is a major driver, with digital lending platforms and fintech lending solutions transforming the loan origination process.
- These platforms enable faster credit risk assessment by utilizing real time financial data, which has improved loan decisioning accuracy by over 20% in certain applications.
- The adoption of blockchain technology in lending is also starting to streamline the mortgage origination process, reducing fraud and operational overhead. This digital shift encourages consumers toward tapping into home equity for purposes like home equity investment.
- As a result, lenders see improved loan portfolio management capabilities, with digital tools automating up to 40% of previously manual verification tasks, facilitating a broader understanding home equity among borrowers.
What are the market trends shaping the Home Equity Lending Industry?
- The integration of artificial intelligence and automated valuation models is emerging as a transformative trend. This shift enables more precise and efficient underwriting processes across the industry.
- A primary trend is the integration of automated valuation models and AI in credit scoring for more precise, data driven underwriting. This allows for a more dynamic assessment of residential property values, supporting products like secured homeowner loans and cash out refinancing.
- The online mortgage application process is now significantly faster, with platforms using automated property appraisal technology reducing valuation times by up to 70%. Furthermore, blockchain for mortgage processing is enhancing security for transactions related to debt consolidation with home equity.
- This technological adoption improves risk management and enables lenders to offer more competitive terms for home equity loan for renovation, with some lenders processing applications 50% faster than through traditional channels.
What challenges does the Home Equity Lending Industry face during its growth?
- Fluctuating interest rates and broader economic volatility present a key challenge to industry growth and stability.
- Economic volatility and fluctuating interest rates pose significant challenges, directly impacting the appeal of a fixed rate home equity loan and complicating interest rate risk management for lenders. Stricter regulatory compliance in lending requirements add another layer of complexity, increasing operational costs for commercial bank lending and credit union lending services by an estimated 10-15%.
- These pressures also affect non-bank financial institutions, which must balance innovation with rigorous home equity credit standards. The threat of substitutes, such as mortgage refinancing alternatives, grows when borrowing costs rise.
- Lenders must navigate these issues while managing mortgage servicing rights and borrower expectations during the heloc draw period, where unexpected rate hikes can increase defaults by a few percentage points.
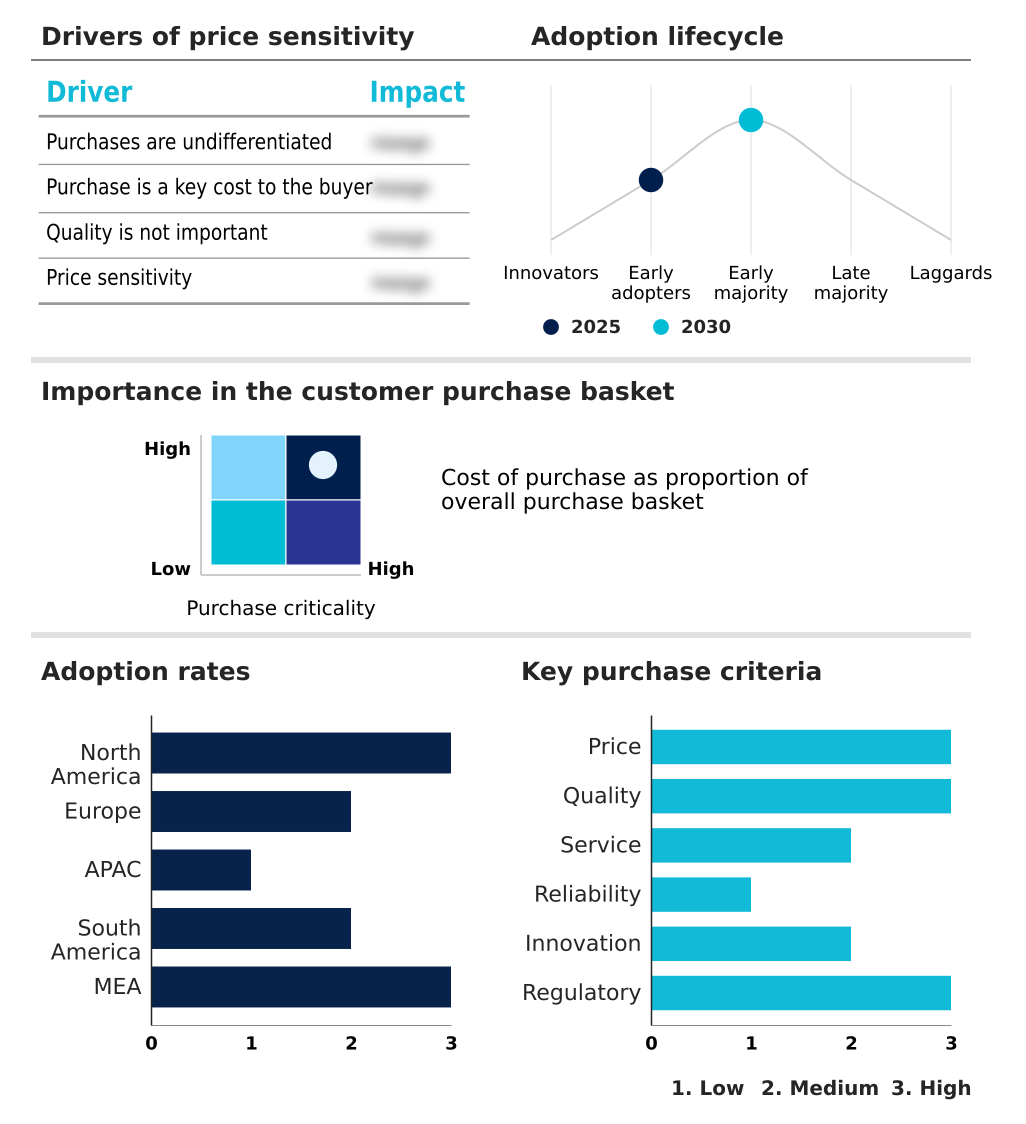
Exclusive Technavio Analysis on Customer Landscape
The home equity lending market forecasting report includes the adoption lifecycle of the market, covering from the innovator’s stage to the laggard’s stage. It focuses on adoption rates in different regions based on penetration. Furthermore, the home equity lending market report also includes key purchase criteria and drivers of price sensitivity to help companies evaluate and develop their market growth analysis strategies.
Customer Landscape of Home Equity Lending Industry
Competitive Landscape
Companies are implementing various strategies, such as strategic alliances, home equity lending market forecast, partnerships, mergers and acquisitions, geographical expansion, and product/service launches, to enhance their presence in the industry.
ABC Finance Ltd. - Analyzes offerings of fully digital, fixed-rate home equity lines of credit, enabling streamlined applications and rapid funding for qualified borrowers.
The industry research and growth report includes detailed analyses of the competitive landscape of the market and information about key companies, including:
- ABC Finance Ltd.
- ANZ Banking Group Ltd.
- BankBazaar
- Barclays PLC
- Figure Lending LLC
- Flagstar Financial Inc.
- HSBC Holdings Plc
- JPMorgan Chase and Co.
- Morgan Stanley
- Navy Federal Credit Union
- NBKC Bank
- Pentagon Federal Credit Union
- Police and Nurses Ltd.
- Regions Financial Corp.
- Rocket Companies Inc.
- Spring EQ LLC
- State Bank of India
- The Goldman Sachs Group Inc.
- The PNC Financial Services Group
- U.S. Bancorp
Qualitative and quantitative analysis of companies has been conducted to help clients understand the wider business environment as well as the strengths and weaknesses of key industry players. Data is qualitatively analyzed to categorize companies as pure play, category-focused, industry-focused, and diversified; it is quantitatively analyzed to categorize companies as dominant, leading, strong, tentative, and weak.
Recent Development and News in Home equity lending market
- In September 2024, Intercontinental Exchange launched an enhanced automated valuation model designed to provide deeper market insights for the home equity lending sector, allowing lenders to access real-time property data and market trends.
- In November 2024, Rocket Mortgage announced the launch of a patented AI platform designed to streamline the home equity loan origination process by automating tasks and reducing closing times using deep learning and computer vision.
- In January 2025, Citizens Financial Group announced a strategic initiative to expand its home equity lending operations by introducing a simplified digital application process that provides instant pre-qualification for eligible homeowners.
- In March 2025, Figure Technology Solutions launched a new platform feature designed to accelerate the approval process for home equity lines of credit by using blockchain technology to verify documents and property data.
Dive into Technavio’s robust research methodology, blending expert interviews, extensive data synthesis, and validated models for unparalleled Home Equity Lending Market insights. See full methodology.
| Market Scope | |
|---|---|
| Page number | 289 |
| Base year | 2025 |
| Historic period | 2020-2024 |
| Forecast period | 2026-2030 |
| Growth momentum & CAGR | Accelerate at a CAGR of 4.8% |
| Market growth 2026-2030 | USD 50975.8 million |
| Market structure | Fragmented |
| YoY growth 2025-2026(%) | 4.5% |
| Key countries | US, Canada, Mexico, UK, Germany, France, Spain, Italy, The Netherlands, China, Australia, Japan, India, South Korea, Indonesia, Brazil, Argentina, Chile, UAE, Saudi Arabia, South Africa, Nigeria and Egypt |
| Competitive landscape | Leading Companies, Market Positioning of Companies, Competitive Strategies, and Industry Risks |
Research Analyst Overview
- The home equity lending market is undergoing a fundamental restructuring driven by financial technology integration. Both commercial bank lending and credit union lending services are adopting digital lending platforms to streamline the loan origination process.
- Core offerings like the home equity line of credit and the fixed rate home equity loan are being enhanced by automated underwriting systems and data driven underwriting. This shift addresses consumer demand for capital for home improvement financing and debt consolidation financing. Boardroom strategy now centers on loan portfolio management and interest rate risk management.
- Firms using real time financial data for credit risk assessment report a 20% improvement in default prediction. Blockchain technology in lending is improving digital document verification. The entire mortgage origination process, including cash out refinancing, is becoming more efficient. Non-bank financial institutions and peer to peer lending platforms innovate through online lending marketplace models.
- Key processes include precise borrower creditworthiness analysis, property equity verification, and managing the loan to value ratio, all while ensuring regulatory compliance in lending. This evolution impacts the revolving credit facility, mortgage servicing rights, and property equity withdrawal options, redefining consumer financing collateral solutions based on rising residential property values.
What are the Key Data Covered in this Home Equity Lending Market Research and Growth Report?
-
What is the expected growth of the Home Equity Lending Market between 2026 and 2030?
-
USD 50.98 billion, at a CAGR of 4.8%
-
-
What segmentation does the market report cover?
-
The report is segmented by Source (Mortgage and credit union, Commercial banks, and Others), Distribution Channel (Offline, and Online), Product Type (HELOC, and Fixed rate loans) and Geography (North America, Europe, APAC, South America, Middle East and Africa)
-
-
Which regions are analyzed in the report?
-
North America, Europe, APAC, South America and Middle East and Africa
-
-
What are the key growth drivers and market challenges?
-
Technological integration and digital transformation in lending, Fluctuating interest rates and economic volatility
-
-
Who are the major players in the Home Equity Lending Market?
-
ABC Finance Ltd., ANZ Banking Group Ltd., BankBazaar, Barclays PLC, Figure Lending LLC, Flagstar Financial Inc., HSBC Holdings Plc, JPMorgan Chase and Co., Morgan Stanley, Navy Federal Credit Union, NBKC Bank, Pentagon Federal Credit Union, Police and Nurses Ltd., Regions Financial Corp., Rocket Companies Inc., Spring EQ LLC, State Bank of India, The Goldman Sachs Group Inc., The PNC Financial Services Group and U.S. Bancorp
-
Market Research Insights
- Market dynamics are increasingly shaped by the adoption of digital mortgage solutions and fintech lending solutions, which are fundamentally altering the online mortgage application process. The debate over home equity loan vs heloc is being influenced by new product structures offering flexible heloc repayment options.
- Innovations such as AI in credit scoring have improved risk assessment accuracy by up to 25%, while the application of blockchain for mortgage processing is demonstrating the potential to reduce verification times by over 40%. These advancements provide lenders with a distinct competitive advantage, enabling faster funding and improved customer satisfaction.
- This digital shift supports a more efficient ecosystem where borrowers can access capital with greater speed and transparency, driving operational efficiencies that reduce origination costs by nearly 15%.
We can help! Our analysts can customize this home equity lending market research report to meet your requirements.
 RIA -
RIA - 
