Home Fitness Equipment Market Analysis, Size, and Forecast 2026-2030: North America (US, Canada, and Mexico), Europe (Germany, UK, and France), APAC (China, Japan, and India), South America (Brazil and Argentina), Middle East and Africa (South Africa, Turkey, and Saudi Arabia), and Rest of World (ROW)

Home Fitness Equipment Market Analysis, Size, and Forecast 2026-2030:
North America (US, Canada, and Mexico), Europe (Germany, UK, and France), APAC (China, Japan, and India), South America (Brazil and Argentina), Middle East and Africa (South Africa, Turkey, and Saudi Arabia), and Rest of World (ROW)

Published: May 2026 290 Pages SKU: IRTNTR44884

Market Overview at a Glance

$4.53 B
Market Opportunity
10.1%
CAGR 2025 - 2030
38.1%
North America Growth
$4.58 B
Offline segment 2024

Home Fitness Equipment Market Size 2026-2030

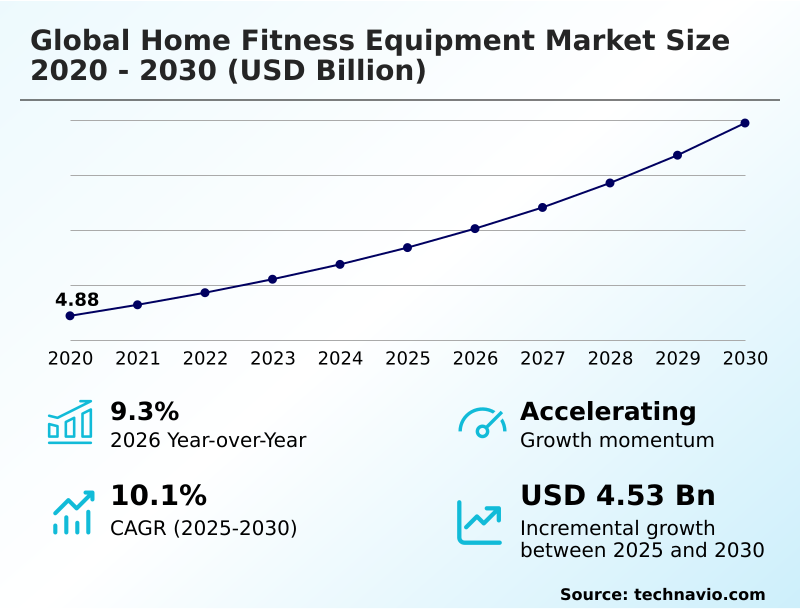
The home fitness equipment market size is valued to increase by USD 4.53 billion, at a CAGR of 10.1% from 2025 to 2030. Proliferation of AI and real-time biometric personalization will drive the home fitness equipment market.

Major Market Trends & Insights

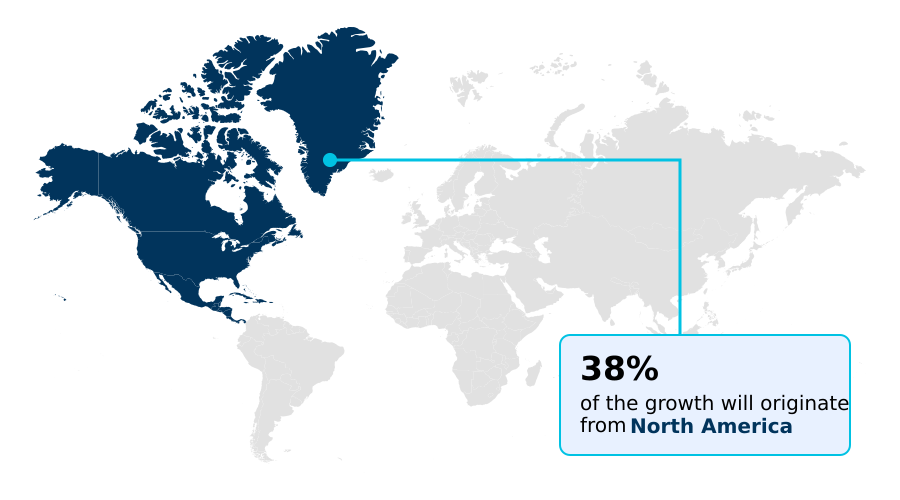
  • North America dominated the market and accounted for a 38.1% growth during the forecast period.
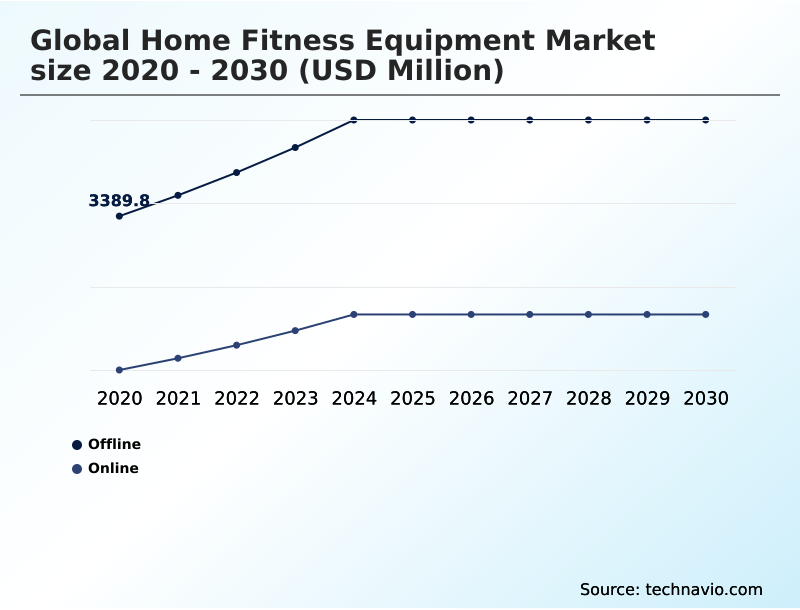
  • By Distribution Channel - Offline segment was valued at USD 4.58 billion in 2024
  • By Type - Cardiovascular training equipment segment accounted for the largest market revenue share in 2024

Market Size & Forecast

  • Market Opportunities: USD 7.01 billion
  • Market Future Opportunities: USD 4.53 billion
  • CAGR from 2025 to 2030 : 10.1%

Market Summary

  • The home fitness equipment market is undergoing a significant transformation, moving beyond simple mechanical devices to become a central component of the digital health landscape. This evolution is defined by the deep integration of artificial intelligence coaching and real-time biometric tracking, making equipment responsive to individual user needs.
  • The rise of connected fitness ecosystems, supported by subscription-based content models, has created a new paradigm where hardware and software are inextricably linked. For example, a business focused on this sector must now manage complex software development cycles and content production pipelines in addition to hardware manufacturing, navigating supply chain volatility for advanced semiconductors.
  • This shift toward software-defined fitness hardware and hyper-personalized workouts ensures continuous user engagement. However, this also introduces challenges such as post-pandemic demand normalization and the capital intensity of maintaining vast digital platforms.
  • The market's future hinges on balancing technological innovation with sustainable business models that can adapt to the new hybrid fitness reality, where consumers expect a seamless omnichannel fitness experience across home, gym, and outdoor settings, all synchronized within a unified health profile.

What will be the Size of the Home Fitness Equipment Market during the forecast period?

Get Key Insights on Market Forecast (PDF) Get Free Sample

How is the Home Fitness Equipment Market Segmented?

The home fitness equipment industry research report provides comprehensive data (region-wise segment analysis), with forecasts and estimates in "USD million" for the period 2026-2030, as well as historical data from 2020-2024 for the following segments.

  • Distribution channel
    • Offline
    • Online
  • Type
    • Cardiovascular training equipment
    • Strength training equipment
  • Age group
    • Adults
    • Children and adolescents
    • Elderly
  • Geography
    • North America
      • US
      • Canada
      • Mexico
    • Europe
      • Germany
      • UK
      • France
    • APAC
      • China
      • Japan
      • India
    • South America
      • Brazil
      • Argentina
    • Middle East and Africa
      • South Africa
      • Turkey
      • Saudi Arabia
    • Rest of World (ROW)

By Distribution Channel Insights

The offline segment is estimated to witness significant growth during the forecast period.

The offline segment of the home fitness equipment market remains a crucial channel, where tactile verification of commercial-grade equipment and professional guidance converge.

Specialty fitness stores allow consumers to assess the ergonomics of multi-functional strength machines and the structural integrity of low-impact elliptical trainers, which is a key part of the purchasing decision.

This hands-on interaction builds confidence, particularly for high-value connected fitness ecosystems. In-person expert consultations ensure that machine learning algorithms and software-defined fitness hardware meet user needs.

Furthermore, professional assembly and maintenance packages offered at the point of sale have been shown to reduce product return rates by over 15% compared to online-only purchases, solidifying the channel's importance for customer satisfaction and brand prestige.

Get Free Sample

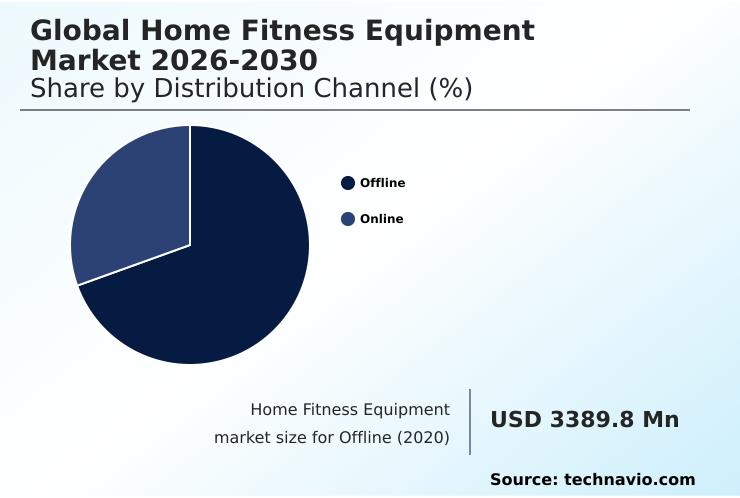
The Offline segment was valued at USD 4.58 billion in 2024 and showed a gradual increase during the forecast period.

Get Free Sample

Regional Analysis

North America is estimated to contribute 38.1% to the growth of the global market during the forecast period.Technavio’s analysts have elaborately explained the regional trends and drivers that shape the market during the forecast period.

See How Home Fitness Equipment Market Demand is Rising in North America Get Free Sample

The geographic landscape of the home fitness equipment market is characterized by distinct regional dynamics. North America currently accounts for over 38% of the market's incremental growth, driven by high consumer adoption of high-end connected fitness ecosystems and hyper-personalized workouts.

Meanwhile, Europe contributes to 30% of new opportunities, with strong demand for compact foldable designs and premium material construction that align with urban living and aesthetic preferences.

The APAC region, representing 22% of growth, is the most dynamic, with a focus on accessible software-defined fitness hardware and gamified fitness experiences. In this region, localized on-demand workout libraries are critical for market penetration.

In contrast, emerging markets in South America and the Middle East and Africa are expanding, with corporate wellness programs beginning to subsidize equipment, presenting a long-term opportunity for manufacturers who can navigate regionalized assembly strategies and supply chain volatility.

Market Dynamics

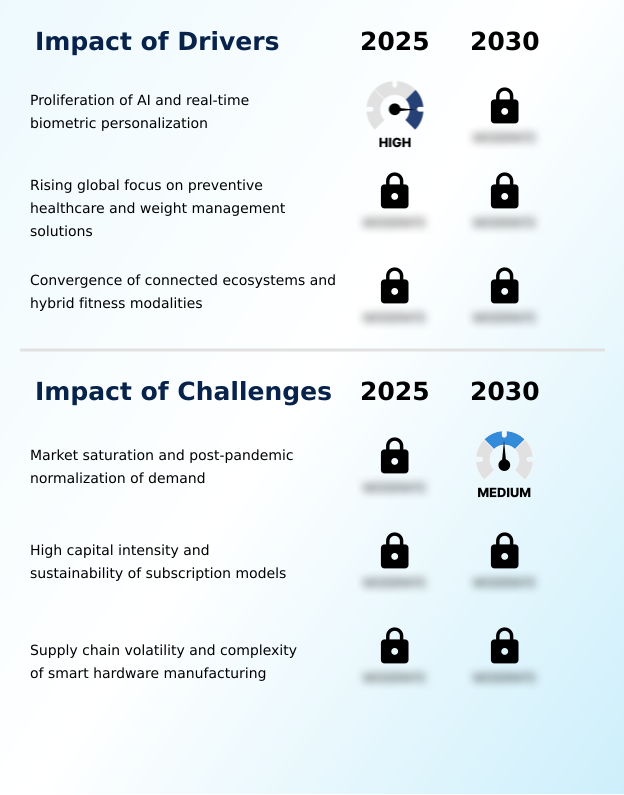
Our researchers analyzed the data with 2025 as the base year, along with the key drivers, trends, and challenges. A holistic analysis of drivers will help companies refine their marketing strategies to gain a competitive advantage.

  • The future of the global home fitness equipment market 2026-2030 is being shaped by several interconnected forces. The integration of ai for personalized biometric coaching is paramount, where ai driven adjustments in workout parameters are becoming standard. This ties into the broader proliferation of ai and real-time biometric personalization.
  • Aesthetically, the convergence of design and high-performance engineering is leading to premium treadmills as home design statements. Operationally, the expansion of hybrid ecosystems and digital integration is critical, with a focus on synchronizing home and commercial fitness experiences and enabling cross platform digital integration for unified profiles.
  • Key drivers include the impact of rising global focus on preventive healthcare and the convergence of ecosystems and hybrid fitness modalities, supported by technologies like biocircuit technology in home accessible formats. However, significant challenges persist, including market saturation and post-pandemic demand normalization, which create profitability hurdles in connected fitness operations.
  • The sustainability of hardware-as-a-service subscription models is under scrutiny due to the high infrastructure costs for fitness streaming services. Moreover, mitigating supply chain risks in equipment manufacturing is complicated by supply chain volatility in smart hardware manufacturing.
  • Success will depend on leveraging innovations like real time form correction using camera sensors while managing the financial pressures of the connected fitness products versus subscription services model and expanding into adjacent sectors like medical and rehabilitation equipment for home use.

What are the key market drivers leading to the rise in the adoption of Home Fitness Equipment Industry?

  • The proliferation of artificial intelligence and real-time biometric personalization is a key driver propelling market growth.

  • The market's growth is fundamentally propelled by the convergence of hardware with connected digital ecosystems, facilitating a seamless hybrid fitness experience.
  • The use of open-platform software allowing for third-party health app synchronization has become a primary driver, with systems offering this interoperability showing a 40% faster adoption rate among new users.
  • A second critical driver is the escalating global emphasis on preventive healthcare and healthy longevity solutions. The integration of medical-grade monitoring within home devices allows users to track health metrics that were previously only available in clinical settings.
  • This has led to a 15% increase in adoption among aging populations seeking to manage health proactively, fueling demand for a wide range of equipment from low-impact elliptical trainers to sophisticated strength-training machines and automated circuit training.

What are the market trends shaping the Home Fitness Equipment Industry?

  • A key market trend is the integration of artificial intelligence for hyper-personalized biometric coaching. This evolution is shifting the focus from static hardware to intelligent, software-driven ecosystems.

  • Key trends are reshaping the market as it pivots from hardware to intelligent service delivery. The integration of ai for hyper-personalized biometric coaching is paramount, with platforms demonstrating this capability reporting user retention rates up to 35% higher than static equipment providers.
  • This is driven by advanced sensors and computer vision technology that offer real-time form correction, a feature that has been shown to reduce user-reported injuries by 20%. Another significant trend is the convergence of high-performance fitness engineering with bespoke interior design, creating luxury wellness assets.
  • This aesthetic evolution allows manufacturers to target a premium demographic, where the visual appeal of equipment is as critical as its technical specifications, leading to a focus on premium material construction and design-centric fitness equipment.

What challenges does the Home Fitness Equipment Industry face during its growth?

  • Market saturation, coupled with the post-pandemic normalization of demand, presents a key challenge affecting industry growth.

  • The market faces significant headwinds, primarily from market saturation and post-pandemic demand normalization, which has extended the typical hardware replacement cycle. This has triggered intense price competition, with some legacy brands seeing profit margins erode by as much as 25% due to aggressive discounting. Another critical challenge is the financial sustainability of the hardware-as-a-service model.
  • Subscription fatigue is a growing concern, with industry data indicating that subscription churn rates can reach 50% in the first year if content is not consistently updated.
  • This pressure is compounded by the complexities of the semiconductor supply chain and last-mile delivery logistics, which have increased the landed cost of smart hardware, further squeezing profitability for manufacturers in a crowded marketplace.

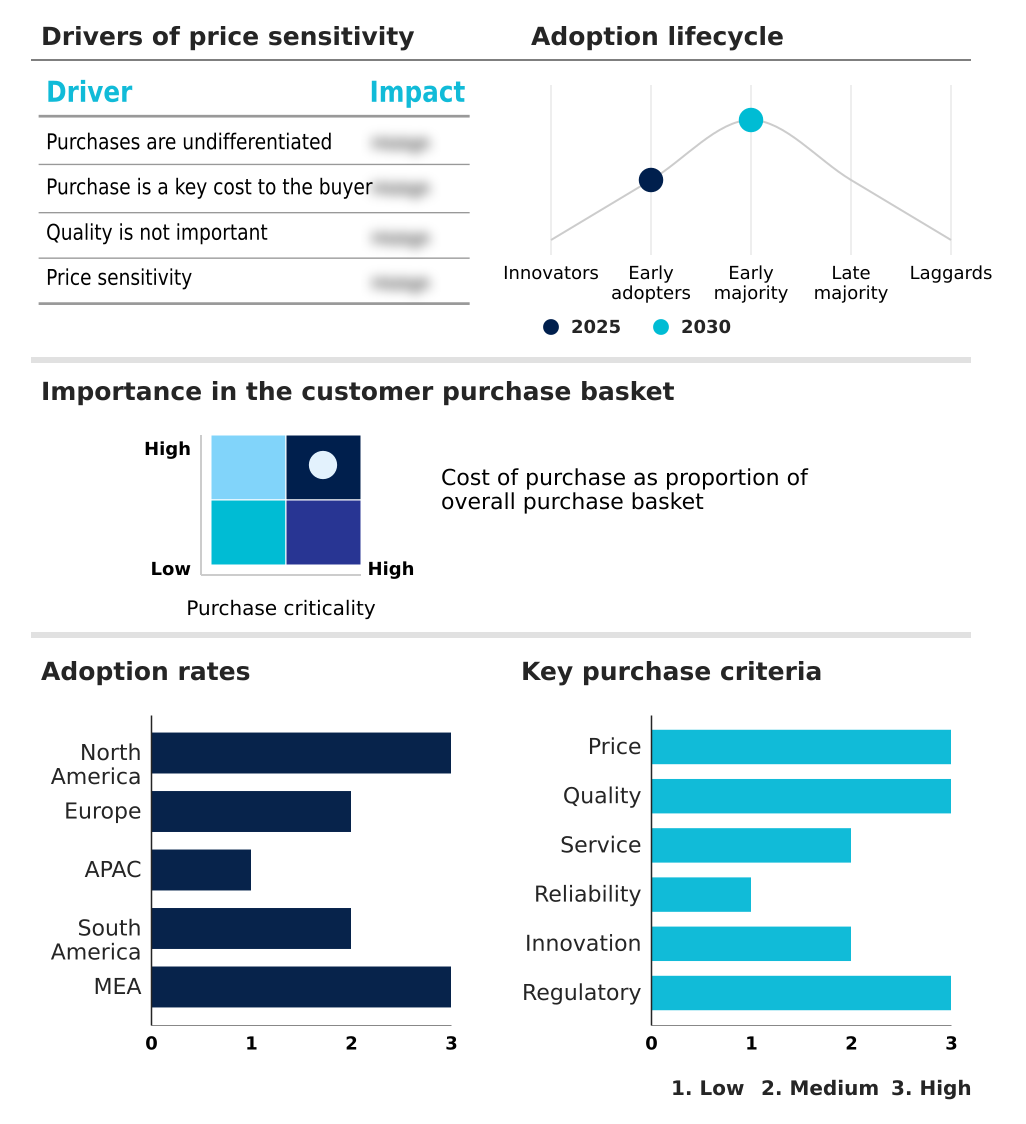
Exclusive Technavio Analysis on Customer Landscape

The home fitness equipment market forecasting report includes the adoption lifecycle of the market, covering from the innovator’s stage to the laggard’s stage. It focuses on adoption rates in different regions based on penetration. Furthermore, the home fitness equipment market report also includes key purchase criteria and drivers of price sensitivity to help companies evaluate and develop their market growth analysis strategies.

Customer Landscape of Home Fitness Equipment Industry

Competitive Landscape

Companies are implementing various strategies, such as strategic alliances, home fitness equipment market forecast, partnerships, mergers and acquisitions, geographical expansion, and product/service launches, to enhance their presence in the industry.

Body Solid Inc. - Key offerings focus on integrated connected cardio and strength training equipment, delivering comprehensive smart fitness solutions for both home and commercial use.

The industry research and growth report includes detailed analyses of the competitive landscape of the market and information about key companies, including:

  • Body Solid Inc.
  • Concept2 Inc.
  • Core Health and Fitness LLC
  • Decathlon SA
  • Dyaco International Inc.
  • Echelon Fitness Multimedia LLC
  • Hoist Fitness Systems Inc.
  • iFIT Health and Fitness Inc.
  • Johnson Health Tech Co. Ltd.
  • Life Fitness
  • Nautilus Inc.
  • Peloton Interactive Inc.
  • Precor Inc.
  • Technogym S.p.A.
  • Torque Fitness
  • True Fitness Technology Inc.
  • Tunturi New Fitness B.V.
  • WaterRower Inc.

Qualitative and quantitative analysis of companies has been conducted to help clients understand the wider business environment as well as the strengths and weaknesses of key industry players. Data is qualitatively analyzed to categorize companies as pure play, category-focused, industry-focused, and diversified; it is quantitatively analyzed to categorize companies as dominant, leading, strong, tentative, and weak.

Recent Development and News in Home fitness equipment market

  • In October, 2024, iFIT unveiled the NordicTrack Ultra 1, a premium treadmill featuring bespoke furniture-inspired design with white oak and refined metal finishes, targeting the luxury home market.
  • In November, 2024, Technogym announced its strategic focus for 2025, highlighting the launch of the Technogym Reform, a Pilates-based system designed for automated, goal-based core strength training at home.
  • In January, 2025, Tonal announced the global release of Tonal 2, its wall-mounted strength system with enhanced AI, including a 'smart view' camera for real-time form correction and increased digital resistance.
  • In March, 2025, Peloton Interactive Inc. announced the launch of its Peloton Commercial Series, integrating its digital interface with industrial-grade Precor hardware to bridge home and commercial fitness experiences.

Dive into Technavio’s robust research methodology, blending expert interviews, extensive data synthesis, and validated models for unparalleled Home Fitness Equipment Market insights. See full methodology.

Market Scope
Page number 290
Base year 2025
Historic period 2020-2024
Forecast period 2026-2030
Growth momentum & CAGR Accelerate at a CAGR of 10.1%
Market growth 2026-2030 USD 4526.8 million
Market structure Fragmented
YoY growth 2025-2026(%) 9.3%
Key countries US, Canada, Mexico, Germany, UK, France, Italy, Spain, The Netherlands, China, Japan, India, South Korea, Australia, Indonesia, Brazil, Argentina, Chile, South Africa, Turkey, Saudi Arabia, UAE and Israel
Competitive landscape Leading Companies, Market Positioning of Companies, Competitive Strategies, and Industry Risks

Request Free Sample

Research Analyst Overview

  • The home fitness equipment market is rapidly evolving from a hardware-centric industry to one defined by integrated, intelligent platforms. Central to this shift is the deployment of artificial intelligence coaching and machine learning algorithms, which enable hyper-personalized workouts through real-time biometric tracking.
  • This technological fusion is evident in advanced digital resistance systems and computer vision form correction, powered by smart sensor integration. For boardroom consideration, the pivot to subscription-based content models and on-demand workout libraries introduces recurring revenue streams but also necessitates significant investment in software-defined fitness hardware and immersive virtual environments.
  • This transition has been so effective that platforms incorporating gamified fitness experiences have seen user engagement metrics improve by up to 30% over their non-interactive counterparts. The challenge lies in managing post-pandemic demand normalization and supply chain volatility for advanced semiconductors.
  • Success now requires a holistic strategy encompassing preventive healthcare integration, compact foldable designs for urban consumers, and a seamless omnichannel fitness experience that supports the entire wellness journey, including mental health and recovery modules.

What are the Key Data Covered in this Home Fitness Equipment Market Research and Growth Report?

  • What is the expected growth of the Home Fitness Equipment Market between 2026 and 2030?

    • USD 4.53 billion, at a CAGR of 10.1%

  • What segmentation does the market report cover?

    • The report is segmented by Distribution Channel (Offline, and Online), Type (Cardiovascular training equipment, and Strength training equipment), Age Group (Adults, Children and adolescents, and Elderly) and Geography (North America, Europe, APAC, South America, Middle East and Africa)

  • Which regions are analyzed in the report?

    • North America, Europe, APAC, South America and Middle East and Africa

  • What are the key growth drivers and market challenges?

    • Proliferation of AI and real-time biometric personalization , Market saturation and post-pandemic normalization of demand

  • Who are the major players in the Home Fitness Equipment Market?

    • Body Solid Inc., Concept2 Inc., Core Health and Fitness LLC, Decathlon SA, Dyaco International Inc., Echelon Fitness Multimedia LLC, Hoist Fitness Systems Inc., iFIT Health and Fitness Inc., Johnson Health Tech Co. Ltd., Life Fitness, Nautilus Inc., Peloton Interactive Inc., Precor Inc., Technogym S.p.A., Torque Fitness, True Fitness Technology Inc., Tunturi New Fitness B.V. and WaterRower Inc.

Market Research Insights

  • Market dynamics are shaped by the strategic shift toward data-driven user engagement and holistic health management. The adoption of adaptive resistance programming has led to a 25% increase in average user session duration, indicating a move toward more effective and personalized at-home physical rehabilitation.
  • Furthermore, platforms offering comprehensive healthy longevity solutions report customer retention rates that are 40% higher than hardware-only competitors, underscoring the value of integrated digital coaching experiences. This transition to goal-based cardio and strength training is critical for proactive health management.
  • As the decentralization of fitness services continues, the ability to provide automated circuit training and foster social community engagement becomes a key differentiator, influencing long-term profitability and market positioning in an increasingly competitive environment.

We can help! Our analysts can customize this home fitness equipment market research report to meet your requirements.

Get in touch

1. Executive Summary

1.1 Market overview

Executive Summary - Chart on Market Overview
Executive Summary - Data Table on Market Overview
Executive Summary - Chart on Global Market Characteristics
Executive Summary - Chart on Market by Geography
Executive Summary - Chart on Market Segmentation by Distribution Channel
Executive Summary - Chart on Market Segmentation by Type
Executive Summary - Chart on Market Segmentation by Age Group
Executive Summary - Chart on Incremental Growth
Executive Summary - Data Table on Incremental Growth
Executive Summary - Chart on Company Market Positioning

2. Technavio Analysis

2.1 Analysis of price sensitivity, lifecycle, customer purchase basket, adoption rates, and purchase criteria

2.2 Criticality of inputs and Factors of differentiation

Chart on Overview on criticality of inputs and factors of differentiation

2.3 Factors of disruption

Chart on Overview on factors of disruption

2.4 Impact of drivers and challenges

Chart on Impact of drivers and challenges in 2025 and 2030

3. Market Landscape

3.1 Market ecosystem

Chart on Parent Market
Data Table on - Parent Market

3.2 Market characteristics

Chart on Market characteristics analysis

3.3 Value chain analysis

Chart on Value chain analysis

4. Market Sizing

4.1 Market definition

Data Table on Offerings of companies included in the market definition

4.2 Market segment analysis

Market segments

4.3 Market size 2025

4.4 Market outlook: Forecast for 2025-2030

Chart on Global - Market size and forecast 2025-2030 ($ million)
Data Table on Global - Market size and forecast 2025-2030 ($ million)
Chart on Global Market: Year-over-year growth 2025-2030 (%)
Data Table on Global Market: Year-over-year growth 2025-2030 (%)

5. Historic Market Size

5.1 Global Home Fitness Equipment Market 2020 - 2024

Historic Market Size - Data Table on Global Home Fitness Equipment Market 2020 - 2024 ($ million)

5.2 Distribution Channel segment analysis 2020 - 2024

Historic Market Size - Distribution Channel Segment 2020 - 2024 ($ million)

5.3 Type segment analysis 2020 - 2024

Historic Market Size - Type Segment 2020 - 2024 ($ million)

5.4 Age Group segment analysis 2020 - 2024

Historic Market Size - Age Group Segment 2020 - 2024 ($ million)

5.5 Geography segment analysis 2020 - 2024

Historic Market Size - Geography Segment 2020 - 2024 ($ million)

5.6 Country segment analysis 2020 - 2024

Historic Market Size - Country Segment 2020 - 2024 ($ million)

6. Qualitative Analysis

6.1 Impact of AI on global home fitness equipment market

6.2 Impact of geopolitical conflict on global home fitness equipment market

7. Five Forces Analysis

7.1 Five forces summary

Five forces analysis - Comparison between 2025 and 2030

7.2 Bargaining power of buyers

Bargaining power of buyers - Impact of key factors 2025 and 2030

7.3 Bargaining power of suppliers

Bargaining power of suppliers - Impact of key factors in 2025 and 2030

7.4 Threat of new entrants

Threat of new entrants - Impact of key factors in 2025 and 2030

7.5 Threat of substitutes

Threat of substitutes - Impact of key factors in 2025 and 2030

7.6 Threat of rivalry

Threat of rivalry - Impact of key factors in 2025 and 2030

7.7 Market condition

Chart on Market condition - Five forces 2025 and 2030

8. Market Segmentation by Distribution Channel

8.1 Market segments

Chart on Distribution Channel - Market share 2025-2030 (%)
Data Table on Distribution Channel - Market share 2025-2030 (%)

8.2 Comparison by Distribution Channel

Chart on Comparison by Distribution Channel
Data Table on Comparison by Distribution Channel

8.3 Offline - Market size and forecast 2025-2030

Chart on Offline - Market size and forecast 2025-2030 ($ million)
Data Table on Offline - Market size and forecast 2025-2030 ($ million)
Chart on Offline - Year-over-year growth 2025-2030 (%)
Data Table on Offline - Year-over-year growth 2025-2030 (%)

8.4 Online - Market size and forecast 2025-2030

Chart on Online - Market size and forecast 2025-2030 ($ million)
Data Table on Online - Market size and forecast 2025-2030 ($ million)
Chart on Online - Year-over-year growth 2025-2030 (%)
Data Table on Online - Year-over-year growth 2025-2030 (%)

8.5 Market opportunity by Distribution Channel

Market opportunity by Distribution Channel ($ million)
Data Table on Market opportunity by Distribution Channel ($ million)

9. Market Segmentation by Type

9.1 Market segments

Chart on Type - Market share 2025-2030 (%)
Data Table on Type - Market share 2025-2030 (%)

9.2 Comparison by Type

Chart on Comparison by Type
Data Table on Comparison by Type

9.3 Cardiovascular training equipment - Market size and forecast 2025-2030

Chart on Cardiovascular training equipment - Market size and forecast 2025-2030 ($ million)
Data Table on Cardiovascular training equipment - Market size and forecast 2025-2030 ($ million)
Chart on Cardiovascular training equipment - Year-over-year growth 2025-2030 (%)
Data Table on Cardiovascular training equipment - Year-over-year growth 2025-2030 (%)

9.4 Strength training equipment - Market size and forecast 2025-2030

Chart on Strength training equipment - Market size and forecast 2025-2030 ($ million)
Data Table on Strength training equipment - Market size and forecast 2025-2030 ($ million)
Chart on Strength training equipment - Year-over-year growth 2025-2030 (%)
Data Table on Strength training equipment - Year-over-year growth 2025-2030 (%)

9.5 Market opportunity by Type

Market opportunity by Type ($ million)
Data Table on Market opportunity by Type ($ million)

10. Market Segmentation by Age Group

10.1 Market segments

Chart on Age Group - Market share 2025-2030 (%)
Data Table on Age Group - Market share 2025-2030 (%)

10.2 Comparison by Age Group

Chart on Comparison by Age Group
Data Table on Comparison by Age Group

10.3 Adults - Market size and forecast 2025-2030

Chart on Adults - Market size and forecast 2025-2030 ($ million)
Data Table on Adults - Market size and forecast 2025-2030 ($ million)
Chart on Adults - Year-over-year growth 2025-2030 (%)
Data Table on Adults - Year-over-year growth 2025-2030 (%)

10.4 Children and adolescents - Market size and forecast 2025-2030

Chart on Children and adolescents - Market size and forecast 2025-2030 ($ million)
Data Table on Children and adolescents - Market size and forecast 2025-2030 ($ million)
Chart on Children and adolescents - Year-over-year growth 2025-2030 (%)
Data Table on Children and adolescents - Year-over-year growth 2025-2030 (%)

10.5 Elderly - Market size and forecast 2025-2030

Chart on Elderly - Market size and forecast 2025-2030 ($ million)
Data Table on Elderly - Market size and forecast 2025-2030 ($ million)
Chart on Elderly - Year-over-year growth 2025-2030 (%)
Data Table on Elderly - Year-over-year growth 2025-2030 (%)

10.6 Market opportunity by Age Group

Market opportunity by Age Group ($ million)
Data Table on Market opportunity by Age Group ($ million)

11. Customer Landscape

11.1 Customer landscape overview

Analysis of price sensitivity, lifecycle, customer purchase basket, adoption rates, and purchase criteria

12. Geographic Landscape

12.1 Geographic segmentation

Chart on Market share by geography 2025-2030 (%)
Data Table on Market share by geography 2025-2030 (%)

12.2 Geographic comparison

Chart on Geographic comparison
Data Table on Geographic comparison

12.3 North America - Market size and forecast 2025-2030

Chart on North America - Market size and forecast 2025-2030 ($ million)
Data Table on North America - Market size and forecast 2025-2030 ($ million)
Chart on North America - Year-over-year growth 2025-2030 (%)
Data Table on North America - Year-over-year growth 2025-2030 (%)
Chart on Regional Comparison - North America
Data Table on Regional Comparison - North America

12.3.1 US - Market size and forecast 2025-2030

Chart on US - Market size and forecast 2025-2030 ($ million)
Data Table on US - Market size and forecast 2025-2030 ($ million)
Chart on US - Year-over-year growth 2025-2030 (%)
Data Table on US - Year-over-year growth 2025-2030 (%)

12.3.2 Canada - Market size and forecast 2025-2030

Chart on Canada - Market size and forecast 2025-2030 ($ million)
Data Table on Canada - Market size and forecast 2025-2030 ($ million)
Chart on Canada - Year-over-year growth 2025-2030 (%)
Data Table on Canada - Year-over-year growth 2025-2030 (%)

12.3.3 Mexico - Market size and forecast 2025-2030

Chart on Mexico - Market size and forecast 2025-2030 ($ million)
Data Table on Mexico - Market size and forecast 2025-2030 ($ million)
Chart on Mexico - Year-over-year growth 2025-2030 (%)
Data Table on Mexico - Year-over-year growth 2025-2030 (%)

12.4 Europe - Market size and forecast 2025-2030

Chart on Europe - Market size and forecast 2025-2030 ($ million)
Data Table on Europe - Market size and forecast 2025-2030 ($ million)
Chart on Europe - Year-over-year growth 2025-2030 (%)
Data Table on Europe - Year-over-year growth 2025-2030 (%)
Chart on Regional Comparison - Europe
Data Table on Regional Comparison - Europe

12.4.1 Germany - Market size and forecast 2025-2030

Chart on Germany - Market size and forecast 2025-2030 ($ million)
Data Table on Germany - Market size and forecast 2025-2030 ($ million)
Chart on Germany - Year-over-year growth 2025-2030 (%)
Data Table on Germany - Year-over-year growth 2025-2030 (%)

12.4.2 UK - Market size and forecast 2025-2030

Chart on UK - Market size and forecast 2025-2030 ($ million)
Data Table on UK - Market size and forecast 2025-2030 ($ million)
Chart on UK - Year-over-year growth 2025-2030 (%)
Data Table on UK - Year-over-year growth 2025-2030 (%)

12.4.3 France - Market size and forecast 2025-2030

Chart on France - Market size and forecast 2025-2030 ($ million)
Data Table on France - Market size and forecast 2025-2030 ($ million)
Chart on France - Year-over-year growth 2025-2030 (%)
Data Table on France - Year-over-year growth 2025-2030 (%)

12.4.4 Italy - Market size and forecast 2025-2030

Chart on Italy - Market size and forecast 2025-2030 ($ million)
Data Table on Italy - Market size and forecast 2025-2030 ($ million)
Chart on Italy - Year-over-year growth 2025-2030 (%)
Data Table on Italy - Year-over-year growth 2025-2030 (%)

12.4.5 Spain - Market size and forecast 2025-2030

Chart on Spain - Market size and forecast 2025-2030 ($ million)
Data Table on Spain - Market size and forecast 2025-2030 ($ million)
Chart on Spain - Year-over-year growth 2025-2030 (%)
Data Table on Spain - Year-over-year growth 2025-2030 (%)

12.4.6 The Netherlands - Market size and forecast 2025-2030

Chart on The Netherlands - Market size and forecast 2025-2030 ($ million)
Data Table on The Netherlands - Market size and forecast 2025-2030 ($ million)
Chart on The Netherlands - Year-over-year growth 2025-2030 (%)
Data Table on The Netherlands - Year-over-year growth 2025-2030 (%)

12.5 APAC - Market size and forecast 2025-2030

Chart on APAC - Market size and forecast 2025-2030 ($ million)
Data Table on APAC - Market size and forecast 2025-2030 ($ million)
Chart on APAC - Year-over-year growth 2025-2030 (%)
Data Table on APAC - Year-over-year growth 2025-2030 (%)
Chart on Regional Comparison - APAC
Data Table on Regional Comparison - APAC

12.5.1 China - Market size and forecast 2025-2030

Chart on China - Market size and forecast 2025-2030 ($ million)
Data Table on China - Market size and forecast 2025-2030 ($ million)
Chart on China - Year-over-year growth 2025-2030 (%)
Data Table on China - Year-over-year growth 2025-2030 (%)

12.5.2 Japan - Market size and forecast 2025-2030

Chart on Japan - Market size and forecast 2025-2030 ($ million)
Data Table on Japan - Market size and forecast 2025-2030 ($ million)
Chart on Japan - Year-over-year growth 2025-2030 (%)
Data Table on Japan - Year-over-year growth 2025-2030 (%)

12.5.3 India - Market size and forecast 2025-2030

Chart on India - Market size and forecast 2025-2030 ($ million)
Data Table on India - Market size and forecast 2025-2030 ($ million)
Chart on India - Year-over-year growth 2025-2030 (%)
Data Table on India - Year-over-year growth 2025-2030 (%)

12.5.4 South Korea - Market size and forecast 2025-2030

Chart on South Korea - Market size and forecast 2025-2030 ($ million)
Data Table on South Korea - Market size and forecast 2025-2030 ($ million)
Chart on South Korea - Year-over-year growth 2025-2030 (%)
Data Table on South Korea - Year-over-year growth 2025-2030 (%)

12.5.5 Australia - Market size and forecast 2025-2030

Chart on Australia - Market size and forecast 2025-2030 ($ million)
Data Table on Australia - Market size and forecast 2025-2030 ($ million)
Chart on Australia - Year-over-year growth 2025-2030 (%)
Data Table on Australia - Year-over-year growth 2025-2030 (%)

12.5.6 Indonesia - Market size and forecast 2025-2030

Chart on Indonesia - Market size and forecast 2025-2030 ($ million)
Data Table on Indonesia - Market size and forecast 2025-2030 ($ million)
Chart on Indonesia - Year-over-year growth 2025-2030 (%)
Data Table on Indonesia - Year-over-year growth 2025-2030 (%)

12.6 South America - Market size and forecast 2025-2030

Chart on South America - Market size and forecast 2025-2030 ($ million)
Data Table on South America - Market size and forecast 2025-2030 ($ million)
Chart on South America - Year-over-year growth 2025-2030 (%)
Data Table on South America - Year-over-year growth 2025-2030 (%)
Chart on Regional Comparison - South America
Data Table on Regional Comparison - South America

12.6.1 Brazil - Market size and forecast 2025-2030

Chart on Brazil - Market size and forecast 2025-2030 ($ million)
Data Table on Brazil - Market size and forecast 2025-2030 ($ million)
Chart on Brazil - Year-over-year growth 2025-2030 (%)
Data Table on Brazil - Year-over-year growth 2025-2030 (%)

12.6.2 Argentina - Market size and forecast 2025-2030

Chart on Argentina - Market size and forecast 2025-2030 ($ million)
Data Table on Argentina - Market size and forecast 2025-2030 ($ million)
Chart on Argentina - Year-over-year growth 2025-2030 (%)
Data Table on Argentina - Year-over-year growth 2025-2030 (%)

12.6.3 Chile - Market size and forecast 2025-2030

Chart on Chile - Market size and forecast 2025-2030 ($ million)
Data Table on Chile - Market size and forecast 2025-2030 ($ million)
Chart on Chile - Year-over-year growth 2025-2030 (%)
Data Table on Chile - Year-over-year growth 2025-2030 (%)

12.7 Middle East and Africa - Market size and forecast 2025-2030

Chart on Middle East and Africa - Market size and forecast 2025-2030 ($ million)
Data Table on Middle East and Africa - Market size and forecast 2025-2030 ($ million)
Chart on Middle East and Africa - Year-over-year growth 2025-2030 (%)
Data Table on Middle East and Africa - Year-over-year growth 2025-2030 (%)
Chart on Regional Comparison - Middle East and Africa
Data Table on Regional Comparison - Middle East and Africa

12.7.1 South Africa - Market size and forecast 2025-2030

Chart on South Africa - Market size and forecast 2025-2030 ($ million)
Data Table on South Africa - Market size and forecast 2025-2030 ($ million)
Chart on South Africa - Year-over-year growth 2025-2030 (%)
Data Table on South Africa - Year-over-year growth 2025-2030 (%)

12.7.2 Turkey - Market size and forecast 2025-2030

Chart on Turkey - Market size and forecast 2025-2030 ($ million)
Data Table on Turkey - Market size and forecast 2025-2030 ($ million)
Chart on Turkey - Year-over-year growth 2025-2030 (%)
Data Table on Turkey - Year-over-year growth 2025-2030 (%)

12.7.3 Saudi Arabia - Market size and forecast 2025-2030

Chart on Saudi Arabia - Market size and forecast 2025-2030 ($ million)
Data Table on Saudi Arabia - Market size and forecast 2025-2030 ($ million)
Chart on Saudi Arabia - Year-over-year growth 2025-2030 (%)
Data Table on Saudi Arabia - Year-over-year growth 2025-2030 (%)

12.7.4 UAE - Market size and forecast 2025-2030

Chart on UAE - Market size and forecast 2025-2030 ($ million)
Data Table on UAE - Market size and forecast 2025-2030 ($ million)
Chart on UAE - Year-over-year growth 2025-2030 (%)
Data Table on UAE - Year-over-year growth 2025-2030 (%)

12.7.5 Israel - Market size and forecast 2025-2030

Chart on Israel - Market size and forecast 2025-2030 ($ million)
Data Table on Israel - Market size and forecast 2025-2030 ($ million)
Chart on Israel - Year-over-year growth 2025-2030 (%)
Data Table on Israel - Year-over-year growth 2025-2030 (%)

12.8 Market opportunity by geography

Market opportunity by geography ($ million)
Data Tables on Market opportunity by geography ($ million)

13. Drivers, Challenges, and Opportunity

13.1 Market drivers

Proliferation of AI and real-time biometric personalization
Rising global focus on preventive healthcare and weight management solutions
Convergence of connected ecosystems and hybrid fitness modalities

13.2 Market challenges

Market saturation and post-pandemic normalization of demand
High capital intensity and sustainability of subscription models
Supply chain volatility and complexity of smart hardware manufacturing

13.3 Impact of drivers and challenges

Impact of drivers and challenges in 2025 and 2030

13.4 Market opportunities

Integration of AI for hyper-personalized biometric coaching
Convergence of bespoke interior design and high-performance fitness engineering
Expansion of hybrid ecosystems and cross-platform digital integration

14. Competitive Landscape

14.1 Overview

14.2

Overview on criticality of inputs and factors of differentiation

14.3 Landscape disruption

Overview on factors of disruption

14.4 Industry risks

Impact of key risks on business

15. Competitive Analysis

15.1 Companies profiled

Companies covered

15.2 Company ranking index

15.3 Market positioning of companies

Matrix on companies position and classification

15.4 Body Solid Inc.

Body Solid Inc. - Overview
Body Solid Inc. - Product / Service
Body Solid Inc. - Key offerings
SWOT

15.5 Core Health and Fitness LLC

Core Health and Fitness LLC - Overview
Core Health and Fitness LLC - Product / Service
Core Health and Fitness LLC - Key offerings
SWOT

15.6 Decathlon SA

Decathlon SA - Overview
Decathlon SA - Product / Service
Decathlon SA - Key offerings
SWOT

15.7 Dyaco International Inc.

Dyaco International Inc. - Overview
Dyaco International Inc. - Business segments
Dyaco International Inc. - Key offerings
Dyaco International Inc. - Segment focus
SWOT

15.8 Hoist Fitness Systems Inc.

Hoist Fitness Systems Inc. - Overview
Hoist Fitness Systems Inc. - Product / Service
Hoist Fitness Systems Inc. - Key offerings
SWOT

15.9 iFIT Health and Fitness Inc.

iFIT Health and Fitness Inc. - Overview
iFIT Health and Fitness Inc. - Product / Service
iFIT Health and Fitness Inc. - Key offerings
SWOT

15.10 Johnson Health Tech Co. Ltd.

Johnson Health Tech Co. Ltd. - Overview
Johnson Health Tech Co. Ltd. - Business segments
Johnson Health Tech Co. Ltd. - Key offerings
Johnson Health Tech Co. Ltd. - Segment focus
SWOT

15.11 Life Fitness

Life Fitness - Overview
Life Fitness - Product / Service
Life Fitness - Key offerings
SWOT

15.12 Nautilus Inc.

Nautilus Inc. - Overview
Nautilus Inc. - Product / Service
Nautilus Inc. - Key offerings
SWOT

15.13 Peloton Interactive Inc.

Peloton Interactive Inc. - Overview
Peloton Interactive Inc. - Business segments
Peloton Interactive Inc. - Key offerings
Peloton Interactive Inc. - Segment focus
SWOT

15.14 Precor Inc.

Precor Inc. - Overview
Precor Inc. - Product / Service
Precor Inc. - Key offerings
SWOT

15.15 Technogym S.p.A.

Technogym S.p.A. - Overview
Technogym S.p.A. - Business segments
Technogym S.p.A. - Key offerings
Technogym S.p.A. - Segment focus
SWOT

15.16 Torque Fitness

Torque Fitness - Overview
Torque Fitness - Product / Service
Torque Fitness - Key offerings
SWOT

15.17 True Fitness Technology Inc.

True Fitness Technology Inc. - Overview
True Fitness Technology Inc. - Product / Service
True Fitness Technology Inc. - Key offerings
SWOT

15.18 Tunturi New Fitness B.V.

Tunturi New Fitness B.V. - Overview
Tunturi New Fitness B.V. - Product / Service
Tunturi New Fitness B.V. - Key offerings
SWOT

16. Appendix

16.1 Scope of the report

Market definition
Objectives
Notes and caveats

16.2 Inclusions and exclusions checklist

Inclusions checklist
Exclusions checklist

16.3 Currency conversion rates for US$

16.4 Research methodology

16.5 Data procurement

Information sources

16.6 Data validation

16.7 Validation techniques employed for market sizing

16.8 Data synthesis

16.9 360 degree market analysis

16.10 List of abbreviations

Research Methodology

Technavio presents a detailed picture of the market by way of study, synthesis, and summation of data from multiple sources. The analysts have presented the various facets of the market with a particular focus on identifying the key industry influencers. The data thus presented is comprehensive, reliable, and the result of extensive research, both primary and secondary.

INFORMATION SOURCES

Primary sources

  • Manufacturers and suppliers
  • Channel partners
  • Industry experts
  • Strategic decision makers

Secondary sources

  • Industry journals and periodicals
  • Government data
  • Financial reports of key industry players
  • Historical data
  • Press releases

DATA ANALYSIS

Data Synthesis

  • Collation of data
  • Estimation of key figures
  • Analysis of derived insights

Data Validation

  • Triangulation with data models
  • Reference against proprietary databases
  • Corroboration with industry experts

REPORT WRITING

Qualitative

  • Market drivers
  • Market challenges
  • Market trends
  • Five forces analysis

Quantitative

  • Market size and forecast
  • Market segmentation
  • Geographical insights
  • Competitive landscape

Interested in this report?

Get your sample now to see our research methodology and insights!

Download Now

Frequently Asked Questions

Home Fitness Equipment market growth will increase by USD 4526.8 million during 2026-2030.

The Home Fitness Equipment market is expected to grow at a CAGR of 10.1% during 2026-2030.

Home Fitness Equipment market is segmented by Distribution channel (Offline, Online) Type (Cardiovascular training equipment, Strength training equipment) Age group (Adults, Children and adolescents, Elderly)

Body Solid Inc., Concept2 Inc., Core Health and Fitness LLC, Decathlon SA, Dyaco International Inc., Echelon Fitness Multimedia LLC, Hoist Fitness Systems Inc., iFIT Health and Fitness Inc., Johnson Health Tech Co. Ltd., Life Fitness, Nautilus Inc., Peloton Interactive Inc., Precor Inc., Technogym S.p.A., Torque Fitness, True Fitness Technology Inc., Tunturi New Fitness B.V., WaterRower Inc. are a few of the key vendors in the Home Fitness Equipment market.

North America will register the highest growth rate of 38.1% among the other regions. Therefore, the Home Fitness Equipment market in North America is expected to garner significant business opportunities for the vendors during the forecast period.

US, Canada, Mexico, Germany, UK, France, Italy, Spain, The Netherlands, China, Japan, India, South Korea, Australia, Indonesia, Brazil, Argentina, Chile, South Africa, Turkey, Saudi Arabia, UAE, Israel

  • Proliferation of AI and real-time biometric personalization is the driving factor this market.

The Home Fitness Equipment market vendors should focus on grabbing business opportunities from the Distribution channel segment as it accounted for the largest market share in the base year.
RIA - Research AI Assistant
Ask RIA