Home Infusion Therapy Market Analysis North America, Europe, Asia, Rest of World (ROW) - US, Germany, UK, Japan, China - Size and Forecast 2024-2028

Home Infusion Therapy Market Analysis North America, Europe, Asia, Rest of World (ROW) - US, Germany, UK, Japan, China - Size and Forecast 2024-2028

Published: Feb 2024 158 Pages SKU: IRTNTR77600

Market Overview at a Glance

$17.37 B
Market Opportunity
8.12%
CAGR
7.58
YoY growth 2023-2024(%)

Home Infusion Therapy Market Size 2024-2028

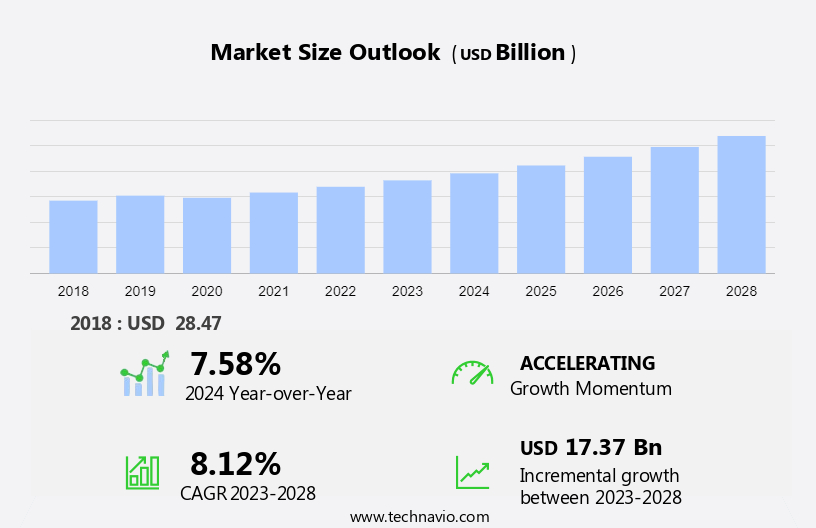
The home infusion therapy market size is forecast to increase by USD 17.37 billion at a CAGR of 8.12% between 2023 and 2028.

  • The market is experiencing significant growth, driven by technological advancements in infusion pumps and remote monitoring devices. These innovations enable improved patient care and expanded therapeutic options. 
  • However, the market faces challenges, including the high upfront costs associated with infusion pumps and equipment procurement. To address these challenges, collaborations and developments among market players are increasing to provide more affordable and accessible home infusion therapy solutions. This market trends and analysis report delves into these factors, providing insights into the growth prospects and challenges of the market.

What will be the Size of the Home Infusion Therapy Market During the Forecast Period?

Home Infusion Therapy Market Size

 Request Free Sample

  • The market encompasses the provision of intravenous (IV) and subcutaneous (SC) infusion services in a home setting. This market caters to various patient populations, including those with geriatric conditions, immune deficiencies, cancer, congestive heart failure, and other chronic diseases. IV therapy, including hydration therapy, chemotherapy, and infusions for endocrinology, represent significant growth areas. Home infusion services enable patients to receive specialized treatments, such as IV hydration therapy, enteral nutrition, and parenteral nutrition, without the need for hospitalization. Technologies like infusion pumps, syringe and needleless connectors, smart pumps, and pressure pumps facilitate safe and efficient home infusion. The market's expansion is driven by an increasing number of specialty drugs, a growing geriatric population, and the need for cost-effective healthcare solutions in both industrialized and non-industrial countries. Home infusion therapy's role in improving patient outcomes and quality of life continues to gain recognition, making it an essential component of modern healthcare. A team of healthcare professionals, including dieticians, ensure the effective delivery of these therapies.

How is this Home Infusion Therapy Industry segmented and which is the largest segment?

The home infusion therapy industry research report provides comprehensive data (region-wise segment analysis), with forecasts and estimates in "USD billion" for the period 2024-2028, as well as historical data from 2018-2022 for the following segments.
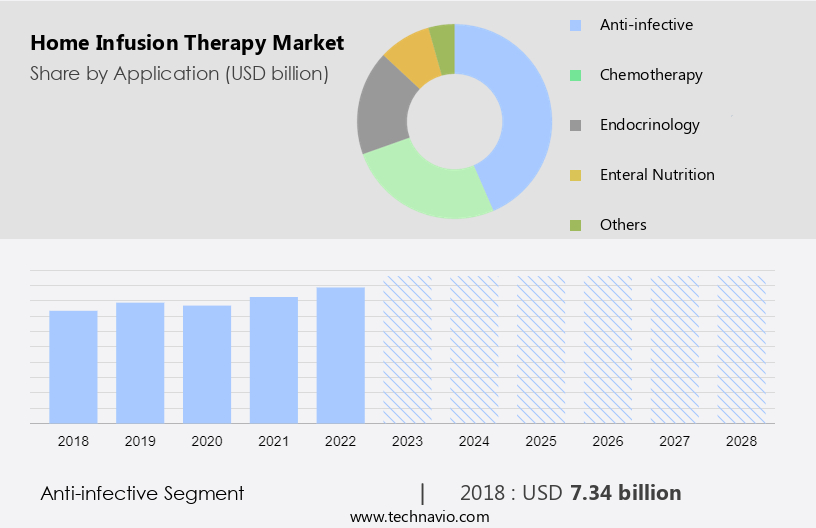
  • Application
    • Anti-infective
    • Chemotherapy
    • Endocrinology
    • Enteral nutrition
    • Others
  • Product
    • Infusion pumps
    • Needless connectors
    • Others
  • Geography
    • North America
      • US
    • Europe
      • Germany
      • UK
    • Asia
      • China
      • Japan
    • Rest of World (ROW)

By Application Insights

  • The anti-infective segment is estimated to witness significant growth during the forecast period.

In the market, anti-infective medications hold significant importance for treating various infectious diseases In the geriatric population and others at home. These medications include antibiotics for bacterial infections like urinary tract infections and skin infections, antivirals for chronic viral infections such as HIV/AIDS and hepatitis, antifungals for serious fungal infections like candidiasis, and antiparasitics for parasitic infections such as malaria and toxoplasmosis. Home infusion therapy offers extended therapy periods outside hospitals, enhancing patient comfort and ensuring medication adherence. IV hydration therapy, a key component of home infusion, is essential for managing conditions like congestive heart failure and immune deficiencies.

IV therapy, including chemotherapy, enteral nutrition, and parenteral nutrition, is crucial in cancer care. Smart pumps and syringe needleless connectors, pressure pumps, and syringes facilitate efficient and safe delivery of these therapies. Home infusion therapy is gaining popularity in non-industrial countries due to its convenience and cost-effectiveness. Dieticians, endocrinologists, and healthcare providers play a vital role in managing and monitoring these therapies. EHR connectivity, drug libraries, and advanced technologies like aducanumab for Alzheimer's disease and smart infusion pumps further enhance the effectiveness and safety of home infusion therapy.

Home Infusion Therapy Market Size

Get a glance at the market report of various segments Request Free Sample

The Anti-infective segment was valued at USD 7.34 billion in 2018 and showed a gradual increase during the forecast period.

Regional Analysis

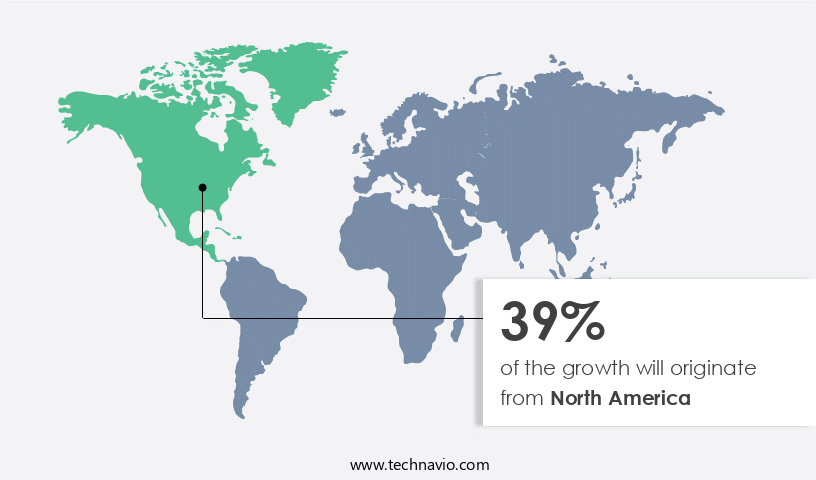
North America is estimated to contribute 39% to the growth of the global market during the forecast period.Technavio's analysts have elaborately explained the regional trends and drivers that shape the market during the forecast period.

Home Infusion Therapy Market Share by Geography

For more insights on the market size of various regions, Request Free Sample

The North American market for home infusion therapy holds a prominent position globally, driven by advanced healthcare infrastructure, a large patient population with chronic conditions, and high adoption rates of home-based medical treatments. Chronic diseases such as cancer, immune deficiencies, and congestive heart failure are prevalent in this region, increasing the demand for home infusion therapy. Factors fueling market growth include rising healthcare expenditure, growing awareness of home-based care, and favorable reimbursement policies. Home infusion therapies, including IV hydration therapy, enteral nutrition, parenteral nutrition, and chemotherapy, are commonly used to manage conditions like cancer and immune deficiencies. Technologies such as smart pumps, needleless connectors, and pressure pumps enhance the efficiency and safety of home infusion therapy.

The geriatric population, especially men and women, in North America benefits significantly from these therapies. Hospitals and healthcare providers increasingly rely on conventional and smart infusion pumps, EHR connectivity, drug libraries, and advanced technologies to improve patient care and outcomes. Key diseases targeted by home infusion therapy include Alzheimer's disease, tuberculosis, and malaria.

Market Dynamics

Our  researchers analyzed the data with 2023 as the base year, along with the key drivers, trends, and challenges. A holistic analysis of drivers will help companies refine their marketing strategies to gain a competitive advantage.

What are the key market drivers leading to the rise In the adoption of Home Infusion Therapy Industry?

Technological advancements in infusion pumps and remote monitoring devices is the key driver of the market.

  • Home infusion therapy, which includes intravenous (IV) infusion and subcutaneous (SC) administration of medications, fluids, and nutrients, is experiencing significant growth due to technological advancements in infusion pumps and remote monitoring devices. Modern infusion pumps offer precise and programmable delivery, dose customization, flow rate adjustments, and built-in safety mechanisms to enhance patient safety, convenience, and treatment efficacy. The development of portable and wearable pumps enables patients to receive treatment while maintaining mobility and independence. IV therapy is commonly used for conditions such as immune deficiencies, cancer, congestive heart failure, and hydration therapy. In the geriatric population, IV hydration therapy and parenteral nutrition are essential for managing chronic conditions.
  • Advanced infusion pumps are also utilized in cancer care, including chemotherapy, enteral nutrition, and parenteral nutrition. Smart pumps with EHR connectivity, drug libraries, and syringe and needleless connectors ensure accurate and efficient medication administration. Pressure pumps and syringe infusion pumps cater to various patient needs. In non-industrial countries, home infusion therapy is gaining popularity due to its cost-effectiveness and convenience. Advancements in infusion technology have led to the development of innovative therapies, such as Aducanumab for Alzheimer's disease and anti-infective therapy for infectious diseases like tuberculosis and malaria. The World Health Organization supports the expansion of home infusion therapy in underserved populations to improve access to essential treatments.

What are the market trends shaping the Home Infusion Therapy Industry?

Increasing developments and collaborations for patient care and therapeutic options is the upcoming market trend.

  • The market is experiencing significant developments, driven by technological advancements, evolving patient care models, and expanding therapeutic applications. Notable developments include the collaboration between Fresenius SE and Co. KGaA and Premier, Inc. To negotiate pricing and terms for Ivenix Infusion Systems. This technology aims to enhance infusion pump reliability and usability. Another development is the introduction of a stand-alone platform for home care services by Amedisys Inc. And Option Care Health Inc. In May 2023. This platform aims to streamline home health services delivery. Intravenous (IV) therapy, including hydration therapy and immune deficiencies treatment, is a primary application of home infusion therapy.
  • Conditions such as cancer, congestive heart failure, and infectious diseases like tuberculosis and malaria are also addressed through this therapy. Specialties like endocrinology, oncology, and enteral/parenteral nutrition are key areas of focus. Technologies such as syringe drivers, smart pumps, needleless connectors, and pressure pumps are essential components of home infusion therapy. Dieticians and healthcare providers play crucial roles in managing patient care. Chemotherapy, antimicrobial therapy, and Alzheimer's disease treatment, such as Aducanumab, are among the therapeutic options provided through home infusion therapy. The World Health Organization emphasizes the importance of home infusion therapy in addressing healthcare accessibility and affordability concerns in non-industrial countries.

What challenges does the Home Infusion Therapy Industry face during its growth?

High upfront costs associated with infusion pumps and equipment procurement is a key challenge affecting the industry growth.

  • Home infusion therapy, which involves the administration of intravenous (IV) infusions, hydration therapy, immune deficiencies treatment, and nutritional support such as enteral and parenteral nutrition, is a vital aspect of healthcare, particularly for managing complex conditions like cancer, congestive heart failure, and immune deficiencies In the geriatric population. The use of IV therapy and subcutaneous (SC) infusions has become increasingly common, with the adoption of advanced technologies like syringe infusers, smart pumps, needleless connectors, and pressure pumps. However, the high upfront costs associated with procuring these devices pose a significant challenge for patients and healthcare providers in non-industrial countries. Infusion pumps are essential for delivering medications, fluids, and nutrients accurately and efficiently In the home setting.
  • However, the initial investment required to purchase or lease these devices can be substantial, making it difficult for patients with limited financial resources or inadequate insurance coverage to access this critical care. For those managing chronic illnesses, co-payments, deductibles, and coverage limitations can add to the out-of-pocket costs, even with insurance. Key therapies In the home infusion market include IV hydration therapy, chemotherapy, immune deficiencies treatment, and enteral and parenteral nutrition. Diseases such as cancer, congestive heart failure, and immune deficiencies are common indications for home infusion therapy. In addition, there is a growing need for home infusion therapy In the treatment of Alzheimer's disease with drugs like Aducanumab.
  • Other indications include anti-infective therapy for infectious diseases like tuberculosis and malaria, as well as endocrinology treatments. Healthcare providers and patients rely on the expertise of dieticians, nurses, and other healthcare professionals to manage these complex therapies effectively. Smart infusion pumps with EHR connectivity, drug libraries, and other advanced features are increasingly being adopted to improve patient safety, reduce errors, and enhance the overall quality of care.

Exclusive Customer Landscape

The home infusion therapy market forecasting report includes the adoption lifecycle of the market, covering from the innovator's stage to the laggard's stage. It focuses on adoption rates in different regions based on penetration. Furthermore, the home infusion therapy market report also includes key purchase criteria and drivers of price sensitivity to help companies evaluate and develop their market growth analysis strategies.
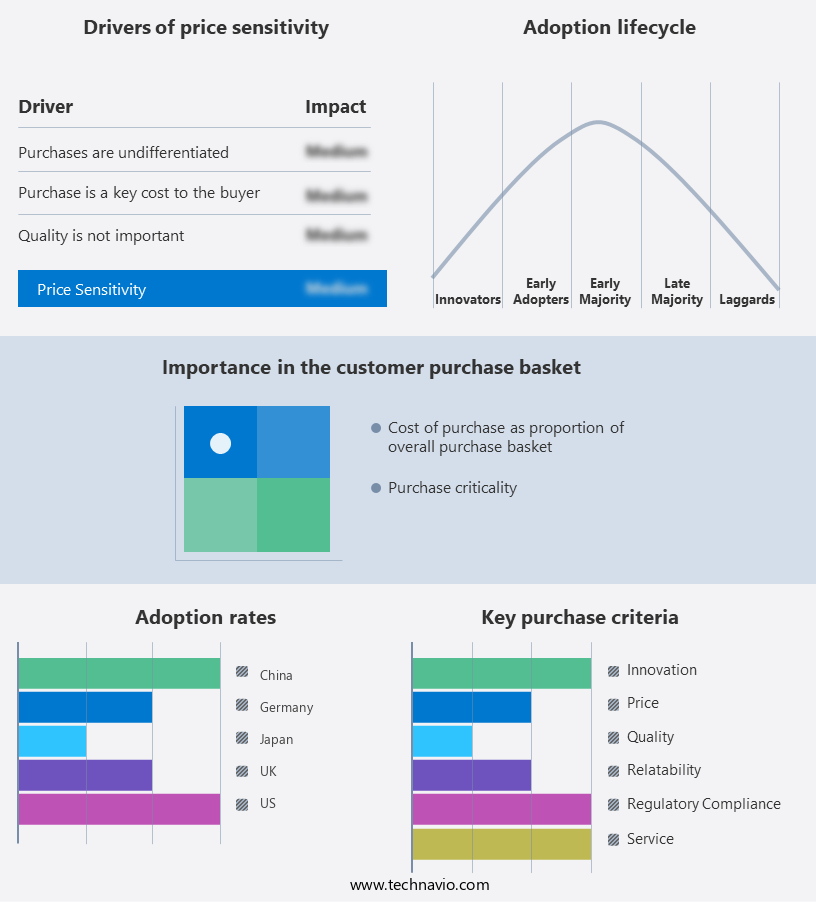
Home Infusion Therapy Market Share by Geography

 Customer Landscape

Key Companies & Market Insights

Companies are implementing various strategies, such as strategic alliances, home infusion therapy market forecast, partnerships, mergers and acquisitions, geographical expansion, and product/service launches, to enhance their presence In the industry.

B.Braun SE - Home infusion therapy, including Digital smart infusion solutions like Space plus and OnlineSuitelus, is gaining prominence for its patient-centric approach. This advanced therapy delivers medication and nutrients directly to patients In their homes, enhancing convenience and improving overall care. Digital smart infusion systems offer advanced features, such as remote monitoring and real-time data analysis, enabling healthcare providers to ensure optimal patient outcomes.

The industry research and growth report includes detailed analyses of the competitive landscape of the market and information about key companies, including:

  • B.Braun SE
  • Baxter International Inc.
  • Becton Dickinson and Co.
  • Bio-Med Pvt. Ltd.
  • Cardinal Health Inc.
  • Catholic Health Initiatives
  • Community Surgical Supply
  • Fresenius SE and Co. KGaA
  • Health Vista Pvt Ltd.
  • Health2home
  • ICU Medical Inc.
  • Medix Infusion
  • Nipro Corp.
  • Option Care Health Inc.
  • Prochant
  • Reviv Genetics Ltd.
  • Sober Care Surgical
  • UnitedHealth Group Inc.
  • University of Pennsylvania Health System
  • Walgreens Boots Alliance Inc.

Qualitative and quantitative analysis of companies has been conducted to help clients understand the wider business environment as well as the strengths and weaknesses of key industry players. Data is qualitatively analyzed to categorize companies as pure play, category-focused, industry-focused, and diversified; it is quantitatively analyzed to categorize companies as dominant, leading, strong, tentative, and weak.

Research Analyst Overview

Home infusion therapy, a medical treatment modality that involves administering medications, fluids, and nutrients intravenously or subcutaneously, has gained significant traction in recent years. This form of therapy offers numerous advantages, particularly for patients with complex medical conditions, such as immune deficiencies, geriatric population, cancer, congestive heart failure, and various other chronic diseases. IV therapy plays a crucial role in managing these conditions, providing essential nutrients and medications directly into the bloodstream. Hydration therapy, a key component of IV therapy, is particularly important for patients suffering from dehydration, which can be a common issue in various disease states. Beyond IV therapy, home infusion therapy also encompasses other modalities like subcutaneous (SC) therapy, which involves administering medications under the skin using a syringe and needle or smart pumps with needleless connectors.

These advanced delivery systems offer increased patient comfort and convenience, making home infusion therapy a more viable option for patients. The market for home infusion therapy is driven by several factors, including the growing prevalence of chronic diseases, an aging population, and advancements in technology. Smart pumps, for instance, offer improved safety, accuracy, and ease of use, making them increasingly popular among healthcare providers and patients. Moreover, the demand for home infusion therapy is not limited to industrialized countries. In non-industrial countries, the need for affordable and accessible healthcare solutions has led to a growing interest in home infusion therapy.

This trend is further fueled by the availability of cost-effective technologies and the increasing recognition of the benefits of home-based care. Home infusion therapy also plays a significant role in various medical specialties, such as endocrinology, oncology, and infectious disease management. For instance, in oncology, home infusion therapy enables patients to receive chemotherapy and other cancer treatments In the comfort of their own homes, reducing the need for frequent hospital visits. Dieticians and healthcare professionals play a crucial role in managing home infusion therapy, ensuring proper patient education, medication administration, and monitoring. In addition, the integration of home infusion therapy with electronic health records (EHR) and drug libraries allows for seamless communication between healthcare services providers and improved patient care.

The market is expected to continue growing, driven by the increasing prevalence of chronic diseases, technological advancements, and the shift towards cost-effective, patient-centric care. As research and development in this field progress, we can anticipate further innovations and advancements that will enhance the efficacy and accessibility of home infusion therapy. In conclusion, home infusion therapy represents a vital component of modern healthcare, offering numerous benefits for patients with complex medical conditions. The market for home infusion therapy is driven by various factors, including demographic trends, technological advancements, and the growing recognition of the importance of patient-centric care. With continued innovation and investment in this field, we can expect home infusion therapy to play an increasingly significant role In the delivery of high-quality, cost-effective healthcare solutions.

Market Scope

Report Coverage

Details

Page number

158

Base year

2023

Historic period

2018-2022

Forecast period

2024-2028

Growth momentum & CAGR

Accelerate at a CAGR of 8.12%

Market growth 2024-2028

USD 17.37 billion

Market structure

Fragmented

YoY growth 2023-2024(%)

7.58

Key countries

US, Germany, UK, Japan, and China

Competitive landscape

Leading Companies, Market Positioning of Companies, Competitive Strategies, and Industry Risks

Request Free Sample

What are the Key Data Covered in this Home Infusion Therapy Market Research and Growth Report?

  • CAGR of the Home Infusion Therapy industry during the forecast period
  • Detailed information on factors that will drive the growth and forecasting between 2024 and 2028
  • Precise estimation of the size of the market and its contribution of the industry in focus to the parent market
  • Accurate predictions about upcoming growth and trends and changes in consumer behaviour
  • Growth of the market across North America, Europe, Asia, and Rest of World (ROW)
  • Thorough analysis of the market's competitive landscape and detailed information about companies
  • Comprehensive analysis of factors that will challenge the home infusion therapy market growth of industry companies

We can help! Our analysts can customize this home infusion therapy market research report to meet your requirements.

Get in touch

1 Executive Summary

  • 1.1 Market overview
    • Exhibit 01: Executive Summary – Chart on Market Overview
    • Exhibit 02: Executive Summary – Data Table on Market Overview
    • Exhibit 03: Executive Summary – Chart on Global Market Characteristics
    • Exhibit 04: Executive Summary – Chart on Market by Geography
    • Exhibit 05: Executive Summary – Chart on Market Segmentation by Application
    • Exhibit 06: Executive Summary – Chart on Market Segmentation by Product
    • Exhibit 07: Executive Summary – Chart on Incremental Growth
    • Exhibit 08: Executive Summary – Data Table on Incremental Growth
    • Exhibit 09: Executive Summary – Chart on Vendor Market Positioning

2 Market Landscape

  • 2.1 Market ecosystem
    • Exhibit 10: Parent market
    • Exhibit 11: Market Characteristics

3 Market Sizing

  • 3.1 Market definition
    • Exhibit 12: Offerings of vendors included in the market definition
  • 3.2 Market segment analysis
    • Exhibit 13: Market segments
  • 3.3 Market size 2023
    • 3.4 Market outlook: Forecast for 2023-2028
      • Exhibit 14: Chart on Global - Market size and forecast 2023-2028 ($ billion)
      • Exhibit 15: Data Table on Global - Market size and forecast 2023-2028 ($ billion)
      • Exhibit 16: Chart on Global Market: Year-over-year growth 2023-2028 (%)
      • Exhibit 17: Data Table on Global Market: Year-over-year growth 2023-2028 (%)

    4 Historic Market Size

    • 4.1 Global home infusion therapy market 2018 - 2022
      • Exhibit 18: Historic Market Size – Data Table on global home infusion therapy market 2018 - 2022 ($ billion)
    • 4.2 Application Segment Analysis 2018 - 2022
      • Exhibit 19: Historic Market Size – Application Segment 2018 - 2022 ($ billion)
    • 4.3 Product Segment Analysis 2018 - 2022
      • Exhibit 20: Historic Market Size – Product Segment 2018 - 2022 ($ billion)
    • 4.4 Geography Segment Analysis 2018 - 2022
      • Exhibit 21: Historic Market Size – Geography Segment 2018 - 2022 ($ billion)
    • 4.5 Country Segment Analysis 2018 - 2022
      • Exhibit 22: Historic Market Size – Country Segment 2018 - 2022 ($ billion)

    5 Five Forces Analysis

    • 5.1 Five forces summary
      • Exhibit 23: Five forces analysis - Comparison between 2023 and 2028
    • 5.2 Bargaining power of buyers
      • Exhibit 24: Chart on Bargaining power of buyers – Impact of key factors 2023 and 2028
    • 5.3 Bargaining power of suppliers
      • Exhibit 25: Bargaining power of suppliers – Impact of key factors in 2023 and 2028
    • 5.4 Threat of new entrants
      • Exhibit 26: Threat of new entrants – Impact of key factors in 2023 and 2028
    • 5.5 Threat of substitutes
      • Exhibit 27: Threat of substitutes – Impact of key factors in 2023 and 2028
    • 5.6 Threat of rivalry
      • Exhibit 28: Threat of rivalry – Impact of key factors in 2023 and 2028
    • 5.7 Market condition
      • Exhibit 29: Chart on Market condition - Five forces 2023 and 2028

    6 Market Segmentation by Application

    • 6.1 Market segments
      • Exhibit 30: Chart on Application - Market share 2023-2028 (%)
      • Exhibit 31: Data Table on Application - Market share 2023-2028 (%)
    • 6.2 Comparison by Application
      • Exhibit 32: Chart on Comparison by Application
      • Exhibit 33: Data Table on Comparison by Application
    • 6.3 Anti-infective - Market size and forecast 2023-2028
      • Exhibit 34: Chart on Anti-infective - Market size and forecast 2023-2028 ($ billion)
      • Exhibit 35: Data Table on Anti-infective - Market size and forecast 2023-2028 ($ billion)
      • Exhibit 36: Chart on Anti-infective - Year-over-year growth 2023-2028 (%)
      • Exhibit 37: Data Table on Anti-infective - Year-over-year growth 2023-2028 (%)
    • 6.4 Chemotherapy - Market size and forecast 2023-2028
      • Exhibit 38: Chart on Chemotherapy - Market size and forecast 2023-2028 ($ billion)
      • Exhibit 39: Data Table on Chemotherapy - Market size and forecast 2023-2028 ($ billion)
      • Exhibit 40: Chart on Chemotherapy - Year-over-year growth 2023-2028 (%)
      • Exhibit 41: Data Table on Chemotherapy - Year-over-year growth 2023-2028 (%)
    • 6.5 Endocrinology - Market size and forecast 2023-2028
      • Exhibit 42: Chart on Endocrinology - Market size and forecast 2023-2028 ($ billion)
      • Exhibit 43: Data Table on Endocrinology - Market size and forecast 2023-2028 ($ billion)
      • Exhibit 44: Chart on Endocrinology - Year-over-year growth 2023-2028 (%)
      • Exhibit 45: Data Table on Endocrinology - Year-over-year growth 2023-2028 (%)
    • 6.6 Enteral nutrition - Market size and forecast 2023-2028
      • Exhibit 46: Chart on Enteral nutrition - Market size and forecast 2023-2028 ($ billion)
      • Exhibit 47: Data Table on Enteral nutrition - Market size and forecast 2023-2028 ($ billion)
      • Exhibit 48: Chart on Enteral nutrition - Year-over-year growth 2023-2028 (%)
      • Exhibit 49: Data Table on Enteral nutrition - Year-over-year growth 2023-2028 (%)
    • 6.7 Others - Market size and forecast 2023-2028
      • Exhibit 50: Chart on Others - Market size and forecast 2023-2028 ($ billion)
      • Exhibit 51: Data Table on Others - Market size and forecast 2023-2028 ($ billion)
      • Exhibit 52: Chart on Others - Year-over-year growth 2023-2028 (%)
      • Exhibit 53: Data Table on Others - Year-over-year growth 2023-2028 (%)
    • 6.8 Market opportunity by Application
      • Exhibit 54: Market opportunity by Application ($ billion)
      • Exhibit 55: Data Table on Market opportunity by Application ($ billion)

    7 Market Segmentation by Product

    • 7.1 Market segments
      • Exhibit 56: Chart on Product - Market share 2023-2028 (%)
      • Exhibit 57: Data Table on Product - Market share 2023-2028 (%)
    • 7.2 Comparison by Product
      • Exhibit 58: Chart on Comparison by Product
      • Exhibit 59: Data Table on Comparison by Product
    • 7.3 Infusion pumps - Market size and forecast 2023-2028
      • Exhibit 60: Chart on Infusion pumps - Market size and forecast 2023-2028 ($ billion)
      • Exhibit 61: Data Table on Infusion pumps - Market size and forecast 2023-2028 ($ billion)
      • Exhibit 62: Chart on Infusion pumps - Year-over-year growth 2023-2028 (%)
      • Exhibit 63: Data Table on Infusion pumps - Year-over-year growth 2023-2028 (%)
    • 7.4 Needless connectors - Market size and forecast 2023-2028
      • Exhibit 64: Chart on Needless connectors - Market size and forecast 2023-2028 ($ billion)
      • Exhibit 65: Data Table on Needless connectors - Market size and forecast 2023-2028 ($ billion)
      • Exhibit 66: Chart on Needless connectors - Year-over-year growth 2023-2028 (%)
      • Exhibit 67: Data Table on Needless connectors - Year-over-year growth 2023-2028 (%)
    • 7.5 Others - Market size and forecast 2023-2028
      • Exhibit 68: Chart on Others - Market size and forecast 2023-2028 ($ billion)
      • Exhibit 69: Data Table on Others - Market size and forecast 2023-2028 ($ billion)
      • Exhibit 70: Chart on Others - Year-over-year growth 2023-2028 (%)
      • Exhibit 71: Data Table on Others - Year-over-year growth 2023-2028 (%)
    • 7.6 Market opportunity by Product
      • Exhibit 72: Market opportunity by Product ($ billion)
      • Exhibit 73: Data Table on Market opportunity by Product ($ billion)

    8 Customer Landscape

    • 8.1 Customer landscape overview
      • Exhibit 74: Analysis of price sensitivity, lifecycle, customer purchase basket, adoption rates, and purchase criteria

    9 Geographic Landscape

    • 9.1 Geographic segmentation
      • Exhibit 75: Chart on Market share by geography 2023-2028 (%)
      • Exhibit 76: Data Table on Market share by geography 2023-2028 (%)
    • 9.2 Geographic comparison
      • Exhibit 77: Chart on Geographic comparison
      • Exhibit 78: Data Table on Geographic comparison
    • 9.3 North America - Market size and forecast 2023-2028
      • Exhibit 79: Chart on North America - Market size and forecast 2023-2028 ($ billion)
      • Exhibit 80: Data Table on North America - Market size and forecast 2023-2028 ($ billion)
      • Exhibit 81: Chart on North America - Year-over-year growth 2023-2028 (%)
      • Exhibit 82: Data Table on North America - Year-over-year growth 2023-2028 (%)
    • 9.4 Europe - Market size and forecast 2023-2028
      • Exhibit 83: Chart on Europe - Market size and forecast 2023-2028 ($ billion)
      • Exhibit 84: Data Table on Europe - Market size and forecast 2023-2028 ($ billion)
      • Exhibit 85: Chart on Europe - Year-over-year growth 2023-2028 (%)
      • Exhibit 86: Data Table on Europe - Year-over-year growth 2023-2028 (%)
    • 9.5 Asia - Market size and forecast 2023-2028
      • Exhibit 87: Chart on Asia - Market size and forecast 2023-2028 ($ billion)
      • Exhibit 88: Data Table on Asia - Market size and forecast 2023-2028 ($ billion)
      • Exhibit 89: Chart on Asia - Year-over-year growth 2023-2028 (%)
      • Exhibit 90: Data Table on Asia - Year-over-year growth 2023-2028 (%)
    • 9.6 Rest of World (ROW) - Market size and forecast 2023-2028
      • Exhibit 91: Chart on Rest of World (ROW) - Market size and forecast 2023-2028 ($ billion)
      • Exhibit 92: Data Table on Rest of World (ROW) - Market size and forecast 2023-2028 ($ billion)
      • Exhibit 93: Chart on Rest of World (ROW) - Year-over-year growth 2023-2028 (%)
      • Exhibit 94: Data Table on Rest of World (ROW) - Year-over-year growth 2023-2028 (%)
    • 9.7 US - Market size and forecast 2023-2028
      • Exhibit 95: Chart on US - Market size and forecast 2023-2028 ($ billion)
      • Exhibit 96: Data Table on US - Market size and forecast 2023-2028 ($ billion)
      • Exhibit 97: Chart on US - Year-over-year growth 2023-2028 (%)
      • Exhibit 98: Data Table on US - Year-over-year growth 2023-2028 (%)
    • 9.8 Germany - Market size and forecast 2023-2028
      • Exhibit 99: Chart on Germany - Market size and forecast 2023-2028 ($ billion)
      • Exhibit 100: Data Table on Germany - Market size and forecast 2023-2028 ($ billion)
      • Exhibit 101: Chart on Germany - Year-over-year growth 2023-2028 (%)
      • Exhibit 102: Data Table on Germany - Year-over-year growth 2023-2028 (%)
    • 9.9 Japan - Market size and forecast 2023-2028
      • Exhibit 103: Chart on Japan - Market size and forecast 2023-2028 ($ billion)
      • Exhibit 104: Data Table on Japan - Market size and forecast 2023-2028 ($ billion)
      • Exhibit 105: Chart on Japan - Year-over-year growth 2023-2028 (%)
      • Exhibit 106: Data Table on Japan - Year-over-year growth 2023-2028 (%)
    • 9.10 China - Market size and forecast 2023-2028
      • Exhibit 107: Chart on China - Market size and forecast 2023-2028 ($ billion)
      • Exhibit 108: Data Table on China - Market size and forecast 2023-2028 ($ billion)
      • Exhibit 109: Chart on China - Year-over-year growth 2023-2028 (%)
      • Exhibit 110: Data Table on China - Year-over-year growth 2023-2028 (%)
    • 9.11 UK - Market size and forecast 2023-2028
      • Exhibit 111: Chart on UK - Market size and forecast 2023-2028 ($ billion)
      • Exhibit 112: Data Table on UK - Market size and forecast 2023-2028 ($ billion)
      • Exhibit 113: Chart on UK - Year-over-year growth 2023-2028 (%)
      • Exhibit 114: Data Table on UK - Year-over-year growth 2023-2028 (%)
    • 9.12 Market opportunity by geography
      • Exhibit 115: Market opportunity by geography ($ billion)
      • Exhibit 116: Data Tables on Market opportunity by geography ($ billion)

    10 Drivers, Challenges, and Trends

    • 10.1 Market drivers
      • 10.2 Market challenges
        • 10.3 Impact of drivers and challenges
          • Exhibit 117: Impact of drivers and challenges in 2023 and 2028
        • 10.4 Market trends

          11 Vendor Landscape

          • 11.1 Overview
            • 11.2 Vendor landscape
              • Exhibit 118: Overview on Criticality of inputs and Factors of differentiation
            • 11.3 Landscape disruption
              • Exhibit 119: Overview on factors of disruption
            • 11.4 Industry risks
              • Exhibit 120: Impact of key risks on business

            12 Vendor Analysis

            • 12.1 Vendors covered
              • Exhibit 121: Vendors covered
            • 12.2 Market positioning of vendors
              • Exhibit 122: Matrix on vendor position and classification
            • 12.3 B.Braun SE
              • Exhibit 123: B.Braun SE - Overview
              • Exhibit 124: B.Braun SE - Business segments
              • Exhibit 125: B.Braun SE - Key news
              • Exhibit 126: B.Braun SE - Key offerings
              • Exhibit 127: B.Braun SE - Segment focus
            • 12.4 Baxter International Inc.
              • Exhibit 128: Baxter International Inc. - Overview
              • Exhibit 129: Baxter International Inc. - Business segments
              • Exhibit 130: Baxter International Inc. - Key news
              • Exhibit 131: Baxter International Inc. - Key offerings
              • Exhibit 132: Baxter International Inc. - Segment focus
            • 12.5 Becton Dickinson and Co.
              • Exhibit 133: Becton Dickinson and Co. - Overview
              • Exhibit 134: Becton Dickinson and Co. - Business segments
              • Exhibit 135: Becton Dickinson and Co. - Key news
              • Exhibit 136: Becton Dickinson and Co. - Key offerings
              • Exhibit 137: Becton Dickinson and Co. - Segment focus
            • 12.6 Bio-Med Pvt. Ltd.
              • Exhibit 138: Bio-Med Pvt. Ltd. - Overview
              • Exhibit 139: Bio-Med Pvt. Ltd. - Product / Service
              • Exhibit 140: Bio-Med Pvt. Ltd. - Key offerings
            • 12.7 Catholic Health Initiatives
              • Exhibit 141: Catholic Health Initiatives - Overview
              • Exhibit 142: Catholic Health Initiatives - Product / Service
              • Exhibit 143: Catholic Health Initiatives - Key offerings
            • 12.8 Community Surgical Supply
              • Exhibit 144: Community Surgical Supply - Overview
              • Exhibit 145: Community Surgical Supply - Product / Service
              • Exhibit 146: Community Surgical Supply - Key offerings
            • 12.9 Fresenius SE and Co. KGaA
              • Exhibit 147: Fresenius SE and Co. KGaA - Overview
              • Exhibit 148: Fresenius SE and Co. KGaA - Business segments
              • Exhibit 149: Fresenius SE and Co. KGaA - Key news
              • Exhibit 150: Fresenius SE and Co. KGaA - Key offerings
              • Exhibit 151: Fresenius SE and Co. KGaA - Segment focus
            • 12.10 Health Vista Pvt Ltd.
              • Exhibit 152: Health Vista Pvt Ltd. - Overview
              • Exhibit 153: Health Vista Pvt Ltd. - Product / Service
              • Exhibit 154: Health Vista Pvt Ltd. - Key offerings
            • 12.11 Health2home
              • Exhibit 155: Health2home - Overview
              • Exhibit 156: Health2home - Product / Service
              • Exhibit 157: Health2home - Key offerings
            • 12.12 ICU Medical Inc.
              • Exhibit 158: ICU Medical Inc. - Overview
              • Exhibit 159: ICU Medical Inc. - Product / Service
              • Exhibit 160: ICU Medical Inc. - Key offerings
            • 12.13 Option Care Health Inc.
              • Exhibit 161: Option Care Health Inc. - Overview
              • Exhibit 162: Option Care Health Inc. - Key offerings
            • 12.14 Prochant
              • Exhibit 163: Prochant - Overview
              • Exhibit 164: Prochant - Product / Service
              • Exhibit 165: Prochant - Key offerings
            • 12.15 Reviv Genetics Ltd.
              • Exhibit 166: Reviv Genetics Ltd. - Overview
              • Exhibit 167: Reviv Genetics Ltd. - Product / Service
              • Exhibit 168: Reviv Genetics Ltd. - Key offerings
            • 12.16 Sober Care Surgical
              • Exhibit 169: Sober Care Surgical - Overview
              • Exhibit 170: Sober Care Surgical - Product / Service
              • Exhibit 171: Sober Care Surgical - Key offerings
            • 12.17 UnitedHealth Group Inc.
              • Exhibit 172: UnitedHealth Group Inc. - Overview
              • Exhibit 173: UnitedHealth Group Inc. - Business segments
              • Exhibit 174: UnitedHealth Group Inc. - Key news
              • Exhibit 175: UnitedHealth Group Inc. - Key offerings
              • Exhibit 176: UnitedHealth Group Inc. - Segment focus

            13 Appendix

            • 13.1 Scope of the report
              • 13.2 Inclusions and exclusions checklist
                • Exhibit 177: Inclusions checklist
                • Exhibit 178: Exclusions checklist
              • 13.3 Currency conversion rates for US$
                • Exhibit 179: Currency conversion rates for US$
              • 13.4 Research methodology
                • Exhibit 180: Research methodology
                • Exhibit 181: Validation techniques employed for market sizing
                • Exhibit 182: Information sources
              • 13.5 List of abbreviations
                • Exhibit 183: List of abbreviations

              Research Methodology

              Technavio presents a detailed picture of the market by way of study, synthesis, and summation of data from multiple sources. The analysts have presented the various facets of the market with a particular focus on identifying the key industry influencers. The data thus presented is comprehensive, reliable, and the result of extensive research, both primary and secondary.

              INFORMATION SOURCES

              Primary sources

              • Manufacturers and suppliers
              • Channel partners
              • Industry experts
              • Strategic decision makers

              Secondary sources

              • Industry journals and periodicals
              • Government data
              • Financial reports of key industry players
              • Historical data
              • Press releases

              DATA ANALYSIS

              Data Synthesis

              • Collation of data
              • Estimation of key figures
              • Analysis of derived insights

              Data Validation

              • Triangulation with data models
              • Reference against proprietary databases
              • Corroboration with industry experts

              REPORT WRITING

              Qualitative

              • Market drivers
              • Market challenges
              • Market trends
              • Five forces analysis

              Quantitative

              • Market size and forecast
              • Market segmentation
              • Geographical insights
              • Competitive landscape

              Interested in this report?

              Get your sample now to see our research methodology and insights!

              Download Now

              Frequently Asked Questions

              Home Infusion Therapy market growth will increase by $ 17.37 bn during 2024-2028 .

              The Home Infusion Therapy market is expected to grow at a CAGR of 8.12% during 2024-2028 .

              Home Infusion Therapy market is segmented by Application( Anti-infective, Chemotherapy, Endocrinology, Enteral nutrition, Others) Product( Infusion pumps, Needless connectors, Others)

              B.Braun SE, Baxter International Inc., Becton Dickinson and Co., Bio-Med Pvt. Ltd., Cardinal Health Inc., Catholic Health Initiatives, Community Surgical Supply, Fresenius SE and Co. KGaA, Health Vista Pvt Ltd., Health2home, ICU Medical Inc., Medix Infusion, Nipro Corp., Option Care Health Inc., Prochant, Reviv Genetics Ltd., Sober Care Surgical, UnitedHealth Group Inc., University of Pennsylvania Health System, Walgreens Boots Alliance Inc. are a few of the key vendors in the Home Infusion Therapy market.

              North America will register the highest growth rate of 39% among the other regions. Therefore, the Home Infusion Therapy market in North America is expected to garner significant business opportunities for the vendors during the forecast period.

              US, Germany, UK, Japan, China

              • Technological advancements in infusion pumps and remote monitoring devicesTechnological advancements in infusion pumps and remote monitoring devices serve as significant drivers in propelling the growth of the global home infusion therapy market. The technological advancements have revolutionized the delivery of infusion therapy by enhancing patient safety is the driving factor this market.
              • convenience is the driving factor this market.
              • and treatment efficacy. Infusion pump technology has evolved significantly is the driving factor this market.
              • with modern devices offering precise and programmable delivery of medications is the driving factor this market.
              • fluids is the driving factor this market.
              • and nutrients. These pumps feature advanced functionalities such as dose customization is the driving factor this market.
              • flow rate adjustments is the driving factor this market.
              • and built-in safety mechanisms to prevent medication errors and adverse events. Additionally is the driving factor this market.
              • the development of portable and wearable infusion pumps enables patients to receive treatment while maintaining mobility and independence is the driving factor this market.
              • further improving their quality of life. Remote monitoring devices play a crucial role in monitoring patients vital signs is the driving factor this market.
              • therapy adherence is the driving factor this market.
              • and treatment outcomes in real time. These devices facilitate remote patient monitoring (RPM) by transmitting data to healthcare providers is the driving factor this market.
              • allowing timely intervention in case of any abnormalities or complications. RPM enables proactive management of patients conditions is the driving factor this market.
              • reduces the need for in-person clinic visits is the driving factor this market.
              • and enhances continuity of care is the driving factor this market.
              • particularly for patients with complex medical needs or those living in remote areas. Hence is the driving factor this market.
              • technological advancements in infusion pumps and remote monitoring devices are expected to boost the growth of the global home infusion therapy market during the forecast period. is the driving factor this market.

              The Home Infusion Therapy market vendors should focus on grabbing business opportunities from the Anti-infective segment as it accounted for the largest market share in the base year.