Horse And Sports Betting Market Analysis, Size, and Forecast 2026-2030: Europe (UK, Germany, and France), APAC (China, Japan, and Australia), North America (US, Canada, and Mexico), South America (Brazil and Argentina), Middle East and Africa (UAE, Saudi Arabia, and South Africa), and Rest of World (ROW)

Horse And Sports Betting Market Analysis, Size, and Forecast 2026-2030:
Europe (UK, Germany, and France), APAC (China, Japan, and Australia), North America (US, Canada, and Mexico), South America (Brazil and Argentina), Middle East and Africa (UAE, Saudi Arabia, and South Africa), and Rest of World (ROW)

Published: May 2026 298 Pages SKU: IRTNTR43681

Market Overview at a Glance

$283.7 Mn
Market Opportunity
11.6%
CAGR 2025 - 2030
47.2%
Europe Growth
$298.8 Mn
Offline betting segment 2024

Horse And Sports Betting Market Size 2026-2030

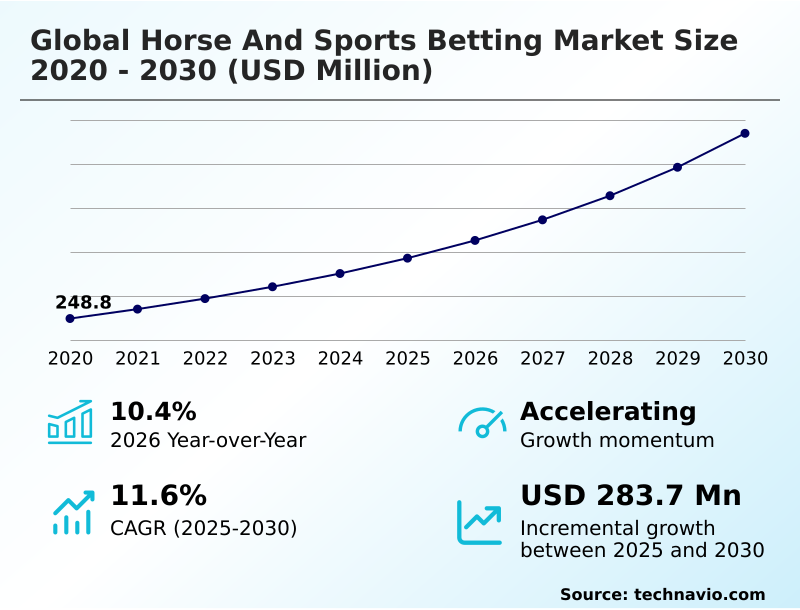
The Horse And Sports Betting Market size was valued at USD 386 million in 2025, growing at a CAGR of 11.6% during the forecast period 2026-2030.

Major Market Trends & Insights

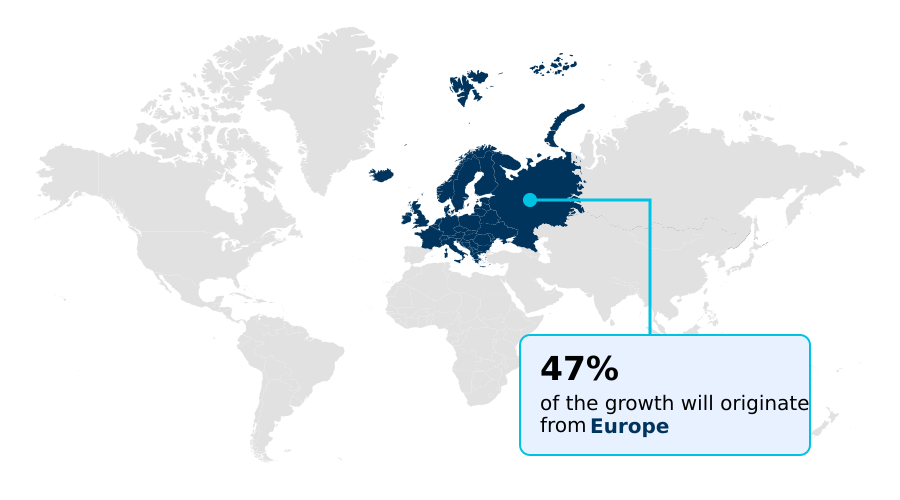
  • Europe dominated the market and accounted for a 47.2% growth during the forecast period.
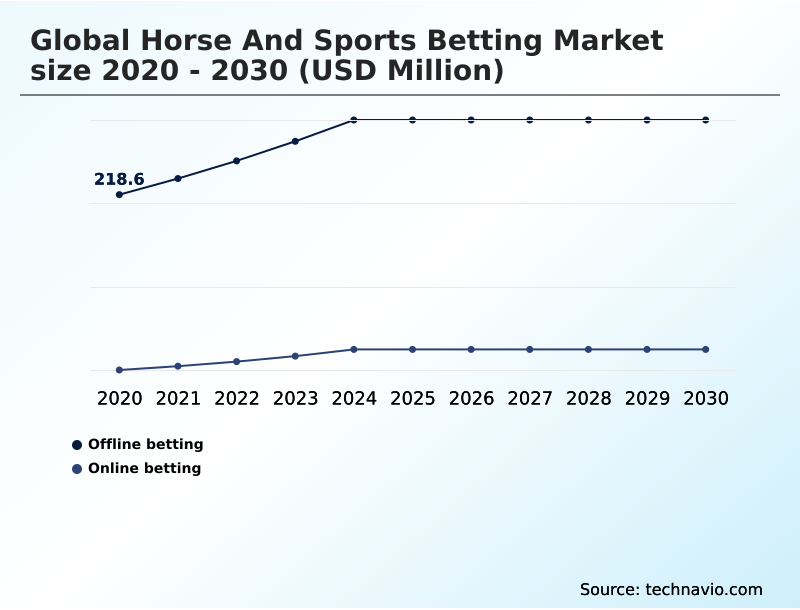
  • By Platform - Offline betting segment was valued at USD 298.8 million in 2024
  • By Type - Fixed odds wagering segment accounted for the largest market revenue share in 2024

Market Size & Forecast

  • Historic Market Opportunities 2020-2024: USD 420.9 million
  • Market Future Opportunities 2025-2030: USD 283.7 million
  • CAGR from 2025 to 2030 : 11.6%

Market Summary

  • The horse and sports betting market is characterized by a structural shift to digital platforms, with online betting's growth rate of over 11% outpacing the offline segment's 10.3% expansion.
  • This transition is reshaping operational strategies, as firms now prioritize the development of mobile betting applications featuring live betting data feeds and secure digital wallet integration to capture a digitally native audience. A key driver is the expansion of regulated markets, which provides a stable environment for investment in technology like risk management algorithms.
  • For instance, a platform operator entering a newly regulated jurisdiction must balance aggressive customer acquisition with robust KYC compliance and responsible gambling tools, where failure to comply can lead to fines exceeding 15% of annual revenue.
  • However, this growth is constrained by escalating cybersecurity threats, which demand continuous investment in data protection, challenging the allocation of resources away from product innovation.

What will be the Size of the Horse And Sports Betting Market during the forecast period?

Get Key Insights on Market Forecast (PDF) Request Free Sample

How is the Horse And Sports Betting Market Segmented?

The horse and sports betting industry research report provides comprehensive data (region-wise segment analysis), with forecasts and analysis for the period 2026-2030, as well as historical data from 2020-2024 for the following segments.

  • Platform
    • Offline betting
    • Online betting
  • Type
    • Fixed odds wagering
    • Exchange betting
    • Live betting
    • eSports betting
    • Others
  • Event type
    • Football and soccer
    • Virtual betting events
    • Horse racing
    • eSports events
  • Geography
    • Europe
      • UK
      • Germany
      • France
    • APAC
      • China
      • Japan
      • Australia
    • North America
      • US
      • Canada
      • Mexico
    • South America
      • Brazil
      • Argentina
    • Middle East and Africa
      • UAE
      • Saudi Arabia
      • South Africa
    • Rest of World (ROW)

How is the Horse And Sports Betting Market Segmented by Platform?

The offline betting segment is estimated to witness significant growth during the forecast period.

The offline betting segment anchors the horse and sports betting market, constituting over 84% of activity and growing at 10.3%, just below the digital segment's 11% expansion.

Operators are modernizing these venues with self-service terminals to improve the user experience and manage customer acquisition cost through direct engagement.

This physical channel remains vital for certain demographics and is essential for implementing robust kyc compliance and age verification systems at the point of sale. While digital platforms leverage sports data apis, offline venues focus on creating immersive environments.

However, the high fixed costs of retail, coupled with the need for transaction monitoring and adherence to strict marketing compliance, present ongoing operational challenges compared to asset-light online models that prioritize data analytics for betting.

Request Free Sample

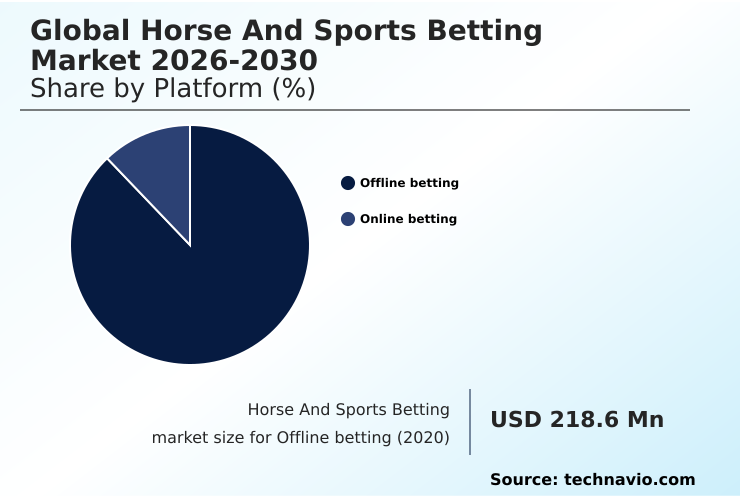
The Offline betting segment was valued at USD 298.8 million in 2024 and showed a gradual increase during the forecast period.

Request Free Sample

How demand for the Horse And Sports Betting market is rising in the leading region?

Europe is estimated to contribute 47.2% to the growth of the global market during the forecast period.Technavio’s analysts have elaborately explained the regional trends and drivers that shape the market during the forecast period.

See How Horse And Sports Betting Market demand is rising in Europe Request Free Sample

Europe remains the dominant geography, accounting for 47.2% of market opportunity, vastly outpacing North America's 10.89%.

This maturity is built on established regulatory frameworks and the prevalence of peer-to-peer betting exchange platforms and robust responsible gambling tools, supported by self-exclusion registers.

In contrast, the rapid, state-by-state legalization in North America fosters a different dynamic focused on speed-to-market and aggressive prop betting promotions.

European operators emphasize betting integrity monitoring and use player account management systems for retention, while North American firms leverage affiliate marketing networks and league partnerships.

This divergence is driven by regulatory maturity; European ad restrictions impact ROI by up to 15% more than in newly opened US states.

What are the key Drivers, Trends, and Challenges in the Horse And Sports Betting Market?

Our researchers analyzed the data with 2025 as the base year, along with the key drivers, trends, and challenges. A holistic analysis of drivers will help companies refine their marketing strategies to gain a competitive advantage.

  • Understanding the intricacies of the horse and sports betting market requires a deep dive into its core mechanics and operational challenges. A foundational concept is understanding how does fixed odds wagering work, where operators set predetermined prices, creating a predictable risk environment for bettors, unlike pari-mutuel systems.
  • This predictability is a key element in effective sports betting risk management strategies, which are becoming increasingly sophisticated. Operators now deploy complex risk management algorithms that use real-time odds calculation and monitor betting integrity to balance their books. Looking ahead, the future of mobile esports wagering represents a significant growth vector, appealing to a younger demographic.
  • This segment's success hinges on integrating live betting data feeds with seamless mobile betting applications. A major technological shift involves the application of ai in personalized betting odds, where platforms analyze user behavior to offer tailored suggestions and dynamic pricing, enhancing user engagement metrics. However, navigating the complex web of regulatory challenges in online gambling remains the primary hurdle.
  • Jurisdictional fragmentation requires robust geolocation verification and constant adaptation to evolving laws, with compliance costs in some markets reducing profit margins by over 10% compared to more lenient regions. This highlights the delicate balance between innovation and regulation that defines the industry's trajectory.

What are the key market drivers leading to the rise in the adoption of Horse And Sports Betting Industry?

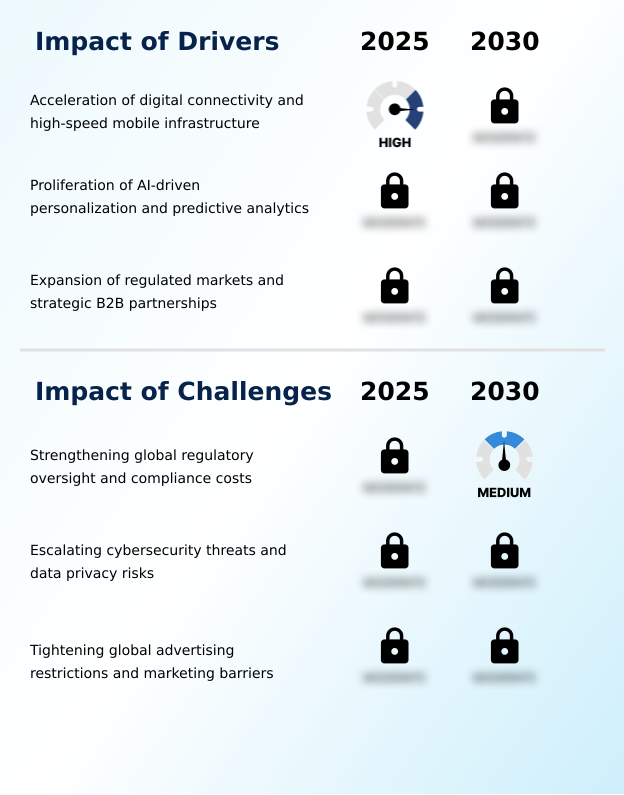
  • The acceleration of digital connectivity and high-speed mobile infrastructure is a key driver, enabling immersive and seamless mobile-first betting experiences.

  • The expansion of regulated markets is a key driver, increasing market participation by over 40% in newly opened jurisdictions by providing a legal framework for fixed odds wagering and other betting types.
  • This legalization attracts investment in turnkey sportsbook solution offerings and regulatory technology. Concurrently, the proliferation of ai-driven betting algorithms is transforming user engagement.
  • By deploying machine learning models to analyze data, operators can tailor promotional offers, leading to a 15% uplift in user retention.
  • This enhances risk management algorithms and turns betting into a more strategic interaction, attracting sophisticated bettors and increasing overall gross gaming revenue.

What are the market trends shaping the Horse And Sports Betting Industry?

  • The evolution of autonomous analytics and intelligent engagement systems is a key market trend, transforming platforms by enabling predictive optimization and adaptive user experiences.

  • A primary trend is the fusion of social features and gamification features, which increases daily user engagement by over 25% compared to purely transactional platforms. Operators are implementing community leaderboards and loyalty programs to boost player lifetime value. This shift addresses the need for better retention strategies as traditional advertising shrinks.
  • Concurrently, the surge in micro-betting markets is enabled by low-latency streaming that reduces delays to under 50 milliseconds. This in-game wagering trend, supported by advanced bonusing engines and real-time odds calculation, transforms passive viewing into an active, high-frequency betting experience.

What challenges does the Horse And Sports Betting Industry face during its growth?

  • Strengthening global regulatory oversight and the associated rise in compliance costs present a key challenge, impacting operational profitability and market entry barriers.

  • Strengthening global regulatory oversight presents a significant challenge, with effective tax rates on taxable gaming revenue exceeding 40% in some mature markets. This pressure diverts capital from innovating the sportsbook platform towards marketing compliance and maintaining geolocation verification systems.
  • Furthermore, escalating cybersecurity threats, which can reduce new user acquisition by over 50% after a breach, necessitate constant investment in fraud detection systems and anti-money laundering tools. This forces operators to balance security spending against investments in user engagement metrics and the mobile betting application, constraining overall growth potential.

Exclusive Technavio Analysis on Customer Landscape

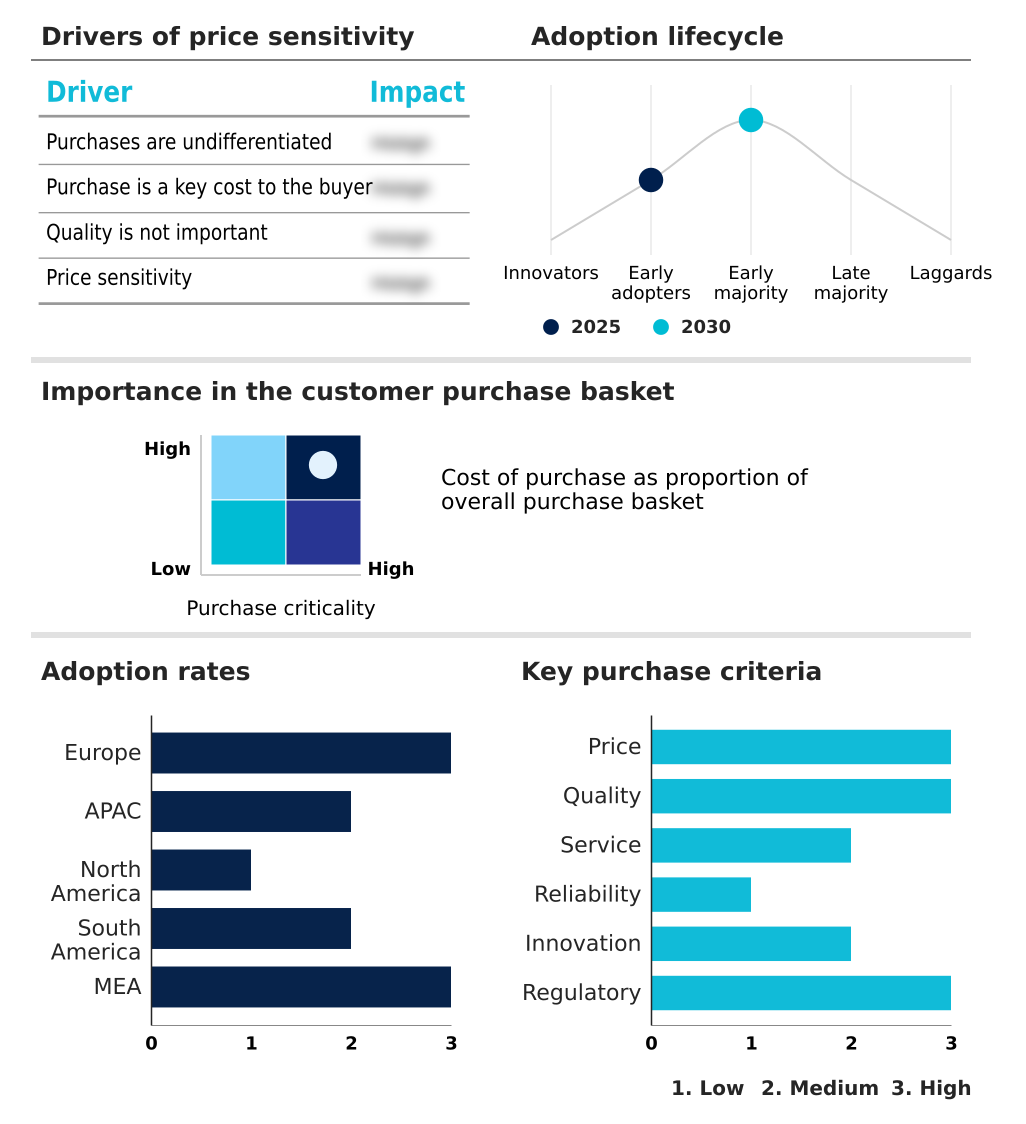
The horse and sports betting market forecasting report includes the adoption lifecycle of the market, covering from the innovator’s stage to the laggard’s stage. It focuses on adoption rates in different regions based on penetration. Furthermore, the horse and sports betting market report also includes key purchase criteria and drivers of price sensitivity to help companies evaluate and develop their market growth analysis strategies.

Customer Landscape of Horse And Sports Betting Industry

Competitive Landscape

Companies are implementing various strategies, such as strategic alliances, horse and sports betting market forecast, partnerships, mergers and acquisitions, geographical expansion, and product/service launches, to enhance their presence in the industry.

Ballys Corp. - Diversified operations span digital sportsbooks and iGaming to land-based casinos and racetracks, creating a comprehensive gaming and entertainment portfolio.

The industry research and growth report includes detailed analyses of the competitive landscape of the market and information about key companies, including:

  • Ballys Corp.
  • Bet365 Group Ltd.
  • Betfred Group
  • Betsson AB
  • Caesars Entertainment Inc.
  • DraftKings Inc.
  • EveryMatrix Ltd
  • FDJ United
  • Flutter Entertainment Plc
  • Genius Sports Ltd
  • International Game Technology
  • MGM Resorts International
  • OpenBet
  • PENN Entertainment Inc.
  • Playtech Plc
  • Sportradar Group AG
  • Super Group SGHC Ltd.
  • The Betway Group
  • Tipico Group Ltd

Qualitative and quantitative analysis of companies has been conducted to help clients understand the wider business environment as well as the strengths and weaknesses of key industry players. Data is qualitatively analyzed to categorize companies as pure play, category-focused, industry-focused, and diversified; it is quantitatively analyzed to categorize companies as dominant, leading, strong, tentative, and weak.

Market Intelligence Radar: High-Impact Developments & Growth Signals

  • In the Casinos and Gaming industry, the global trend toward legalizing online platforms has accelerated, creating structured, taxable markets that directly impact horse and sports betting by legitimizing operations and requiring investment in sophisticated geolocation verification and compliance systems.
  • The widespread adoption of AI and machine learning for personalization has become standard in the Casinos and Gaming industry. For horse and sports betting, this translates to dynamic odds-making, AI-driven betting algorithms, and hyper-personalized user engagement, necessitating advanced risk management algorithms.
  • A significant supply chain evolution within the Casinos and Gaming industry involves the unbundling of technology stacks, with operators increasingly partnering with specialist data and streaming providers. This allows horse and sports betting platforms to access ultra-low latency data feeds for micro-betting markets.
  • The convergence of media, entertainment, and gaming is a major development in the Casinos and Gaming industry, directly fueling the horse and sports betting market through the integration of betting features into live sports broadcasts and the rise of social betting platforms with gamification features.

Dive into Technavio’s robust research methodology, blending expert interviews, extensive data synthesis, and validated models for unparalleled Horse And Sports Betting Market insights. See full methodology.

Market Scope
Page number 298
Base year 2025
Historic period 2020-2024
Forecast period 2026-2030
Growth momentum & CAGR Accelerate at a CAGR of 11.6%
Market growth 2026-2030 USD 283.7 million
Market structure Fragmented
YoY growth 2025-2026(%) 10.4%
Key countries UK, Germany, France, Italy, Spain, The Netherlands, China, Japan, Australia, India, South Korea, Indonesia, US, Canada, Mexico, Brazil, Argentina, Chile, UAE, Saudi Arabia, South Africa, Turkey and Israel
Competitive landscape Leading Companies, Market Positioning of Companies, Competitive Strategies, and Industry Risks

Request Free Sample

Research Analyst Overview

  • The horse and sports betting market ecosystem operates on a complex value chain where technology and data suppliers provide foundational live betting data feeds to B2B sportsbook platform providers. These platforms are then licensed by B2C operators, allowing them to focus on marketing where the cost per acquisition can be over 30% higher in competitive new markets.
  • Regulatory bodies in each jurisdiction play a critical role, setting rules for advertising and the implementation of responsible gambling tools. The entire system is supported by payment processors facilitating digital wallet integration and affiliate marketing networks driving traffic, creating a highly interdependent structure where a disruption in data provision can impact the entire user experience.

What are the Key Data Covered in this Horse And Sports Betting Market Research and Growth Report?

  • What is the expected growth of the Horse And Sports Betting Market between 2026 and 2030?

    • The Horse And Sports Betting Market is expected to grow by USD 283.7 million during 2026-2030, registering a CAGR of 11.6%. Year-over-year growth in 2026 is estimated at 10.4%%. This acceleration is shaped by acceleration of digital connectivity and high-speed mobile infrastructure, which is intensifying demand across multiple end-use verticals covered in the report.

  • What segmentation does the market report cover?

    • The report is segmented by Platform (Offline betting, and Online betting), Type (Fixed odds wagering, Exchange betting, Live betting, eSports betting, and Others), Event Type (Football and soccer, Virtual betting events, Horse racing, and eSports events) and Geography (Europe, APAC, North America, South America, Middle East and Africa). Among these, the Offline betting segment is estimated to witness significant growth during the forecast period, driven by rising adoption across key application areas. Each segment includes detailed qualitative and quantitative analysis, along with historical data from 2020-2024 and forecasts through 2030 with year-over-year growth rates.

  • Which regions are analyzed in the report?

    • The report covers Europe, APAC, North America, South America and Middle East and Africa. Europe is estimated to contribute 47.2% to market growth during the forecast period. Country-level analysis includes UK, Germany, France, Italy, Spain, The Netherlands, China, Japan, Australia, India, South Korea, Indonesia, US, Canada, Mexico, Brazil, Argentina, Chile, UAE, Saudi Arabia, South Africa, Turkey and Israel, with dedicated market size tables and year-over-year growth for each.

  • What are the key growth drivers and market challenges?

    • The primary driver is acceleration of digital connectivity and high-speed mobile infrastructure, which is accelerating investment and industry demand. The main challenge is strengthening global regulatory oversight and compliance costs, creating operational barriers for key market participants. The report quantifies the impact of each driver and challenge across 2026 and 2030 with comparative analysis.

  • Who are the major players in the Horse And Sports Betting Market?

    • Key vendors include Ballys Corp., Bet365 Group Ltd., Betfred Group, Betsson AB, Caesars Entertainment Inc., DraftKings Inc., EveryMatrix Ltd, FDJ United, Flutter Entertainment Plc, Genius Sports Ltd, International Game Technology, MGM Resorts International, OpenBet, PENN Entertainment Inc., Playtech Plc, Sportradar Group AG, Super Group SGHC Ltd., The Betway Group and Tipico Group Ltd. The report provides qualitative and quantitative analysis categorizing companies as dominant, leading, strong, tentative, and weak based on their market positioning. Company profiles include business segment analysis, SWOT assessment, key offerings, and recent strategic developments.

Market Research Insights

  • The competitive landscape of the horse and sports betting market is highly dynamic, with the top 10 operators accounting for nearly 65% of the total digital revenue. This consolidation is driven by strategic technology investments, as seen with DraftKings' expansion into new prediction verticals, diversifying beyond traditional sports outcomes.
  • This move directly addresses enterprise demand for broader user engagement and taps into interest in non-sporting event contracts, leveraging existing sportsbook platforms. Such innovations are critical as operators contend with the challenge of tightening global advertising restrictions, which increases customer acquisition costs by over 20% in some regulated markets.
  • Consequently, companies like Flutter Entertainment are focusing on M&A, acquiring technology assets to enhance their product suite and improve player lifetime value in a marketing-constrained environment.

We can help! Our analysts can customize this horse and sports betting market research report to meet your requirements.

Get in touch

1. Executive Summary

1.1 Market overview

Executive Summary - Chart on Market Overview
Executive Summary - Data Table on Market Overview
Executive Summary - Chart on Global Market Characteristics
Executive Summary - Chart on Market by Geography
Executive Summary - Chart on Market Segmentation by Platform
Executive Summary - Chart on Market Segmentation by Type
Executive Summary - Chart on Market Segmentation by Event Type
Executive Summary - Chart on Incremental Growth
Executive Summary - Data Table on Incremental Growth
Executive Summary - Chart on Company Market Positioning

2. Technavio Analysis

2.1 Analysis of price sensitivity, lifecycle, customer purchase basket, adoption rates, and purchase criteria

2.2 Criticality of inputs and Factors of differentiation

Chart on Overview on criticality of inputs and factors of differentiation

2.3 Factors of disruption

Chart on Overview on factors of disruption

2.4 Impact of drivers and challenges

Chart on Impact of drivers and challenges in 2025 and 2030

3. Market Landscape

3.1 Market ecosystem

Chart on Parent Market
Data Table on - Parent Market

3.2 Market characteristics

Chart on Market characteristics analysis

3.3 Value chain analysis

Chart on Value chain analysis

4. Market Sizing

4.1 Market definition

Data Table on Offerings of companies included in the market definition

4.2 Market segment analysis

Market segments

4.3 Market size 2025

4.4 Market outlook: Forecast for 2025-2030

Chart on Global - Market size and forecast 2025-2030 ($ million)
Data Table on Global - Market size and forecast 2025-2030 ($ million)
Chart on Global Market: Year-over-year growth 2025-2030 (%)
Data Table on Global Market: Year-over-year growth 2025-2030 (%)

5. Historic Market Size

5.1 Global Horse And Sports Betting Market 2020 - 2024

Historic Market Size - Data Table on Global Horse And Sports Betting Market 2020 - 2024 ($ million)

5.2 Platform segment analysis 2020 - 2024

Historic Market Size - Platform Segment 2020 - 2024 ($ million)

5.3 Type segment analysis 2020 - 2024

Historic Market Size - Type Segment 2020 - 2024 ($ million)

5.4 Event Type segment analysis 2020 - 2024

Historic Market Size - Event Type Segment 2020 - 2024 ($ million)

5.5 Geography segment analysis 2020 - 2024

Historic Market Size - Geography Segment 2020 - 2024 ($ million)

5.6 Country segment analysis 2020 - 2024

Historic Market Size - Country Segment 2020 - 2024 ($ million)

6. Qualitative Analysis

6.1 Impact of AI on Global Horse and Sports Betting Market

7. Five Forces Analysis

7.1 Five forces summary

Five forces analysis - Comparison between 2025 and 2030

7.2 Bargaining power of buyers

Bargaining power of buyers - Impact of key factors 2025 and 2030

7.3 Bargaining power of suppliers

Bargaining power of suppliers - Impact of key factors in 2025 and 2030

7.4 Threat of new entrants

Threat of new entrants - Impact of key factors in 2025 and 2030

7.5 Threat of substitutes

Threat of substitutes - Impact of key factors in 2025 and 2030

7.6 Threat of rivalry

Threat of rivalry - Impact of key factors in 2025 and 2030

7.7 Market condition

Chart on Market condition - Five forces 2025 and 2030

8. Market Segmentation by Platform

8.1 Market segments

Chart on Platform - Market share 2025-2030 (%)
Data Table on Platform - Market share 2025-2030 (%)

8.2 Comparison by Platform

Chart on Comparison by Platform
Data Table on Comparison by Platform

8.3 Offline betting - Market size and forecast 2025-2030

Chart on Offline betting - Market size and forecast 2025-2030 ($ million)
Data Table on Offline betting - Market size and forecast 2025-2030 ($ million)
Chart on Offline betting - Year-over-year growth 2025-2030 (%)
Data Table on Offline betting - Year-over-year growth 2025-2030 (%)

8.4 Online betting - Market size and forecast 2025-2030

Chart on Online betting - Market size and forecast 2025-2030 ($ million)
Data Table on Online betting - Market size and forecast 2025-2030 ($ million)
Chart on Online betting - Year-over-year growth 2025-2030 (%)
Data Table on Online betting - Year-over-year growth 2025-2030 (%)

8.5 Market opportunity by Platform

Market opportunity by Platform ($ million)
Data Table on Market opportunity by Platform ($ million)

9. Market Segmentation by Type

9.1 Market segments

Chart on Type - Market share 2025-2030 (%)
Data Table on Type - Market share 2025-2030 (%)

9.2 Comparison by Type

Chart on Comparison by Type
Data Table on Comparison by Type

9.3 Fixed odds wagering - Market size and forecast 2025-2030

Chart on Fixed odds wagering - Market size and forecast 2025-2030 ($ million)
Data Table on Fixed odds wagering - Market size and forecast 2025-2030 ($ million)
Chart on Fixed odds wagering - Year-over-year growth 2025-2030 (%)
Data Table on Fixed odds wagering - Year-over-year growth 2025-2030 (%)

9.4 Exchange betting - Market size and forecast 2025-2030

Chart on Exchange betting - Market size and forecast 2025-2030 ($ million)
Data Table on Exchange betting - Market size and forecast 2025-2030 ($ million)
Chart on Exchange betting - Year-over-year growth 2025-2030 (%)
Data Table on Exchange betting - Year-over-year growth 2025-2030 (%)

9.5 Live betting - Market size and forecast 2025-2030

Chart on Live betting - Market size and forecast 2025-2030 ($ million)
Data Table on Live betting - Market size and forecast 2025-2030 ($ million)
Chart on Live betting - Year-over-year growth 2025-2030 (%)
Data Table on Live betting - Year-over-year growth 2025-2030 (%)

9.6 eSports betting - Market size and forecast 2025-2030

Chart on eSports betting - Market size and forecast 2025-2030 ($ million)
Data Table on eSports betting - Market size and forecast 2025-2030 ($ million)
Chart on eSports betting - Year-over-year growth 2025-2030 (%)
Data Table on eSports betting - Year-over-year growth 2025-2030 (%)

9.7 Others - Market size and forecast 2025-2030

Chart on Others - Market size and forecast 2025-2030 ($ million)
Data Table on Others - Market size and forecast 2025-2030 ($ million)
Chart on Others - Year-over-year growth 2025-2030 (%)
Data Table on Others - Year-over-year growth 2025-2030 (%)

9.8 Market opportunity by Type

Market opportunity by Type ($ million)
Data Table on Market opportunity by Type ($ million)

10. Market Segmentation by Event Type

10.1 Market segments

Chart on Event Type - Market share 2025-2030 (%)
Data Table on Event Type - Market share 2025-2030 (%)

10.2 Comparison by Event Type

Chart on Comparison by Event Type
Data Table on Comparison by Event Type

10.3 Football and soccer - Market size and forecast 2025-2030

Chart on Football and soccer - Market size and forecast 2025-2030 ($ million)
Data Table on Football and soccer - Market size and forecast 2025-2030 ($ million)
Chart on Football and soccer - Year-over-year growth 2025-2030 (%)
Data Table on Football and soccer - Year-over-year growth 2025-2030 (%)

10.4 Virtual betting events - Market size and forecast 2025-2030

Chart on Virtual betting events - Market size and forecast 2025-2030 ($ million)
Data Table on Virtual betting events - Market size and forecast 2025-2030 ($ million)
Chart on Virtual betting events - Year-over-year growth 2025-2030 (%)
Data Table on Virtual betting events - Year-over-year growth 2025-2030 (%)

10.5 Horse racing - Market size and forecast 2025-2030

Chart on Horse racing - Market size and forecast 2025-2030 ($ million)
Data Table on Horse racing - Market size and forecast 2025-2030 ($ million)
Chart on Horse racing - Year-over-year growth 2025-2030 (%)
Data Table on Horse racing - Year-over-year growth 2025-2030 (%)

10.6 eSports events - Market size and forecast 2025-2030

Chart on eSports events - Market size and forecast 2025-2030 ($ million)
Data Table on eSports events - Market size and forecast 2025-2030 ($ million)
Chart on eSports events - Year-over-year growth 2025-2030 (%)
Data Table on eSports events - Year-over-year growth 2025-2030 (%)

10.7 Market opportunity by Event Type

Market opportunity by Event Type ($ million)
Data Table on Market opportunity by Event Type ($ million)

11. Customer Landscape

11.1 Customer landscape overview

Analysis of price sensitivity, lifecycle, customer purchase basket, adoption rates, and purchase criteria

12. Geographic Landscape

12.1 Geographic segmentation

Chart on Market share by geography 2025-2030 (%)
Data Table on Market share by geography 2025-2030 (%)

12.2 Geographic comparison

Chart on Geographic comparison
Data Table on Geographic comparison

12.3 Europe - Market size and forecast 2025-2030

Chart on Europe - Market size and forecast 2025-2030 ($ million)
Data Table on Europe - Market size and forecast 2025-2030 ($ million)
Chart on Europe - Year-over-year growth 2025-2030 (%)
Data Table on Europe - Year-over-year growth 2025-2030 (%)
Chart on Regional Comparison - Europe
Data Table on Regional Comparison - Europe

12.3.1 UK - Market size and forecast 2025-2030

Chart on UK - Market size and forecast 2025-2030 ($ million)
Data Table on UK - Market size and forecast 2025-2030 ($ million)
Chart on UK - Year-over-year growth 2025-2030 (%)
Data Table on UK - Year-over-year growth 2025-2030 (%)

12.3.2 Germany - Market size and forecast 2025-2030

Chart on Germany - Market size and forecast 2025-2030 ($ million)
Data Table on Germany - Market size and forecast 2025-2030 ($ million)
Chart on Germany - Year-over-year growth 2025-2030 (%)
Data Table on Germany - Year-over-year growth 2025-2030 (%)

12.3.3 France - Market size and forecast 2025-2030

Chart on France - Market size and forecast 2025-2030 ($ million)
Data Table on France - Market size and forecast 2025-2030 ($ million)
Chart on France - Year-over-year growth 2025-2030 (%)
Data Table on France - Year-over-year growth 2025-2030 (%)

12.3.4 Italy - Market size and forecast 2025-2030

Chart on Italy - Market size and forecast 2025-2030 ($ million)
Data Table on Italy - Market size and forecast 2025-2030 ($ million)
Chart on Italy - Year-over-year growth 2025-2030 (%)
Data Table on Italy - Year-over-year growth 2025-2030 (%)

12.3.5 Spain - Market size and forecast 2025-2030

Chart on Spain - Market size and forecast 2025-2030 ($ million)
Data Table on Spain - Market size and forecast 2025-2030 ($ million)
Chart on Spain - Year-over-year growth 2025-2030 (%)
Data Table on Spain - Year-over-year growth 2025-2030 (%)

12.3.6 The Netherlands - Market size and forecast 2025-2030

Chart on The Netherlands - Market size and forecast 2025-2030 ($ million)
Data Table on The Netherlands - Market size and forecast 2025-2030 ($ million)
Chart on The Netherlands - Year-over-year growth 2025-2030 (%)
Data Table on The Netherlands - Year-over-year growth 2025-2030 (%)

12.4 APAC - Market size and forecast 2025-2030

Chart on APAC - Market size and forecast 2025-2030 ($ million)
Data Table on APAC - Market size and forecast 2025-2030 ($ million)
Chart on APAC - Year-over-year growth 2025-2030 (%)
Data Table on APAC - Year-over-year growth 2025-2030 (%)
Chart on Regional Comparison - APAC
Data Table on Regional Comparison - APAC

12.4.1 China - Market size and forecast 2025-2030

Chart on China - Market size and forecast 2025-2030 ($ million)
Data Table on China - Market size and forecast 2025-2030 ($ million)
Chart on China - Year-over-year growth 2025-2030 (%)
Data Table on China - Year-over-year growth 2025-2030 (%)

12.4.2 Japan - Market size and forecast 2025-2030

Chart on Japan - Market size and forecast 2025-2030 ($ million)
Data Table on Japan - Market size and forecast 2025-2030 ($ million)
Chart on Japan - Year-over-year growth 2025-2030 (%)
Data Table on Japan - Year-over-year growth 2025-2030 (%)

12.4.3 Australia - Market size and forecast 2025-2030

Chart on Australia - Market size and forecast 2025-2030 ($ million)
Data Table on Australia - Market size and forecast 2025-2030 ($ million)
Chart on Australia - Year-over-year growth 2025-2030 (%)
Data Table on Australia - Year-over-year growth 2025-2030 (%)

12.4.4 India - Market size and forecast 2025-2030

Chart on India - Market size and forecast 2025-2030 ($ million)
Data Table on India - Market size and forecast 2025-2030 ($ million)
Chart on India - Year-over-year growth 2025-2030 (%)
Data Table on India - Year-over-year growth 2025-2030 (%)

12.4.5 South Korea - Market size and forecast 2025-2030

Chart on South Korea - Market size and forecast 2025-2030 ($ million)
Data Table on South Korea - Market size and forecast 2025-2030 ($ million)
Chart on South Korea - Year-over-year growth 2025-2030 (%)
Data Table on South Korea - Year-over-year growth 2025-2030 (%)

12.4.6 Indonesia - Market size and forecast 2025-2030

Chart on Indonesia - Market size and forecast 2025-2030 ($ million)
Data Table on Indonesia - Market size and forecast 2025-2030 ($ million)
Chart on Indonesia - Year-over-year growth 2025-2030 (%)
Data Table on Indonesia - Year-over-year growth 2025-2030 (%)

12.5 North America - Market size and forecast 2025-2030

Chart on North America - Market size and forecast 2025-2030 ($ million)
Data Table on North America - Market size and forecast 2025-2030 ($ million)
Chart on North America - Year-over-year growth 2025-2030 (%)
Data Table on North America - Year-over-year growth 2025-2030 (%)
Chart on Regional Comparison - North America
Data Table on Regional Comparison - North America

12.5.1 US - Market size and forecast 2025-2030

Chart on US - Market size and forecast 2025-2030 ($ million)
Data Table on US - Market size and forecast 2025-2030 ($ million)
Chart on US - Year-over-year growth 2025-2030 (%)
Data Table on US - Year-over-year growth 2025-2030 (%)

12.5.2 Canada - Market size and forecast 2025-2030

Chart on Canada - Market size and forecast 2025-2030 ($ million)
Data Table on Canada - Market size and forecast 2025-2030 ($ million)
Chart on Canada - Year-over-year growth 2025-2030 (%)
Data Table on Canada - Year-over-year growth 2025-2030 (%)

12.5.3 Mexico - Market size and forecast 2025-2030

Chart on Mexico - Market size and forecast 2025-2030 ($ million)
Data Table on Mexico - Market size and forecast 2025-2030 ($ million)
Chart on Mexico - Year-over-year growth 2025-2030 (%)
Data Table on Mexico - Year-over-year growth 2025-2030 (%)

12.6 South America - Market size and forecast 2025-2030

Chart on South America - Market size and forecast 2025-2030 ($ million)
Data Table on South America - Market size and forecast 2025-2030 ($ million)
Chart on South America - Year-over-year growth 2025-2030 (%)
Data Table on South America - Year-over-year growth 2025-2030 (%)
Chart on Regional Comparison - South America
Data Table on Regional Comparison - South America

12.6.1 Brazil - Market size and forecast 2025-2030

Chart on Brazil - Market size and forecast 2025-2030 ($ million)
Data Table on Brazil - Market size and forecast 2025-2030 ($ million)
Chart on Brazil - Year-over-year growth 2025-2030 (%)
Data Table on Brazil - Year-over-year growth 2025-2030 (%)

12.6.2 Argentina - Market size and forecast 2025-2030

Chart on Argentina - Market size and forecast 2025-2030 ($ million)
Data Table on Argentina - Market size and forecast 2025-2030 ($ million)
Chart on Argentina - Year-over-year growth 2025-2030 (%)
Data Table on Argentina - Year-over-year growth 2025-2030 (%)

12.6.3 Chile - Market size and forecast 2025-2030

Chart on Chile - Market size and forecast 2025-2030 ($ million)
Data Table on Chile - Market size and forecast 2025-2030 ($ million)
Chart on Chile - Year-over-year growth 2025-2030 (%)
Data Table on Chile - Year-over-year growth 2025-2030 (%)

12.7 Middle East and Africa - Market size and forecast 2025-2030

Chart on Middle East and Africa - Market size and forecast 2025-2030 ($ million)
Data Table on Middle East and Africa - Market size and forecast 2025-2030 ($ million)
Chart on Middle East and Africa - Year-over-year growth 2025-2030 (%)
Data Table on Middle East and Africa - Year-over-year growth 2025-2030 (%)
Chart on Regional Comparison - Middle East and Africa
Data Table on Regional Comparison - Middle East and Africa

12.7.1 UAE - Market size and forecast 2025-2030

Chart on UAE - Market size and forecast 2025-2030 ($ million)
Data Table on UAE - Market size and forecast 2025-2030 ($ million)
Chart on UAE - Year-over-year growth 2025-2030 (%)
Data Table on UAE - Year-over-year growth 2025-2030 (%)

12.7.2 Saudi Arabia - Market size and forecast 2025-2030

Chart on Saudi Arabia - Market size and forecast 2025-2030 ($ million)
Data Table on Saudi Arabia - Market size and forecast 2025-2030 ($ million)
Chart on Saudi Arabia - Year-over-year growth 2025-2030 (%)
Data Table on Saudi Arabia - Year-over-year growth 2025-2030 (%)

12.7.3 South Africa - Market size and forecast 2025-2030

Chart on South Africa - Market size and forecast 2025-2030 ($ million)
Data Table on South Africa - Market size and forecast 2025-2030 ($ million)
Chart on South Africa - Year-over-year growth 2025-2030 (%)
Data Table on South Africa - Year-over-year growth 2025-2030 (%)

12.7.4 Turkey - Market size and forecast 2025-2030

Chart on Turkey - Market size and forecast 2025-2030 ($ million)
Data Table on Turkey - Market size and forecast 2025-2030 ($ million)
Chart on Turkey - Year-over-year growth 2025-2030 (%)
Data Table on Turkey - Year-over-year growth 2025-2030 (%)

12.7.5 Israel - Market size and forecast 2025-2030

Chart on Israel - Market size and forecast 2025-2030 ($ million)
Data Table on Israel - Market size and forecast 2025-2030 ($ million)
Chart on Israel - Year-over-year growth 2025-2030 (%)
Data Table on Israel - Year-over-year growth 2025-2030 (%)

12.8 Market opportunity by geography

Market opportunity by geography ($ million)
Data Tables on Market opportunity by geography ($ million)

13. Drivers, Challenges, and Opportunity

13.1 Market drivers

Acceleration of digital connectivity and high-speed mobile infrastructure
Proliferation of AI-driven personalization and predictive analytics
Expansion of regulated markets and strategic B2B partnerships

13.2 Market challenges

Strengthening global regulatory oversight and compliance costs
Escalating cybersecurity threats and data privacy risks
Tightening global advertising restrictions and marketing barriers

13.3 Impact of drivers and challenges

Impact of drivers and challenges in 2025 and 2030

13.4 Market opportunities

Evolution of autonomous analytics and intelligent engagement systems
Surge in micro-betting and ultra-low latency streaming infrastructure
Convergence of social betting features and gamified fan engagement

14. Competitive Landscape

14.1 Overview

14.2

Overview on criticality of inputs and factors of differentiation

14.3 Landscape disruption

Overview on factors of disruption

14.4 Industry risks

Impact of key risks on business

15. Competitive Analysis

15.1 Companies profiled

Companies covered

15.2 Company ranking index

15.3 Market positioning of companies

Matrix on companies position and classification

15.4 Ballys Corp.

Ballys Corp. - Overview
Ballys Corp. - Business segments
Ballys Corp. - Key offerings
Ballys Corp. - Segment focus
SWOT

15.5 Bet365 Group Ltd.

Bet365 Group Ltd. - Overview
Bet365 Group Ltd. - Product / Service
Bet365 Group Ltd. - Key offerings
SWOT

15.6 Betfred Group

Betfred Group - Overview
Betfred Group - Product / Service
Betfred Group - Key offerings
SWOT

15.7 Betsson AB

Betsson AB - Overview
Betsson AB - Product / Service
Betsson AB - Key offerings
SWOT

15.8 Caesars Entertainment Inc.

Caesars Entertainment Inc. - Overview
Caesars Entertainment Inc. - Business segments
Caesars Entertainment Inc. - Key offerings
Caesars Entertainment Inc. - Segment focus
SWOT

15.9 DraftKings Inc.

DraftKings Inc. - Overview
DraftKings Inc. - Business segments
DraftKings Inc. - Key offerings
DraftKings Inc. - Segment focus
SWOT

15.10 EveryMatrix Ltd

EveryMatrix Ltd - Overview
EveryMatrix Ltd - Product / Service
EveryMatrix Ltd - Key offerings
SWOT

15.11 Flutter Entertainment Plc

Flutter Entertainment Plc - Overview
Flutter Entertainment Plc - Business segments
Flutter Entertainment Plc - Key offerings
Flutter Entertainment Plc - Segment focus
SWOT

15.12 International Game Technology

International Game Technology - Overview
International Game Technology - Business segments
International Game Technology - Key offerings
International Game Technology - Segment focus
SWOT

15.13 MGM Resorts International

MGM Resorts International - Overview
MGM Resorts International - Business segments
MGM Resorts International - Key offerings
MGM Resorts International - Segment focus
SWOT

15.14 OpenBet

OpenBet - Overview
OpenBet - Product / Service
OpenBet - Key offerings
SWOT

15.15 PENN Entertainment Inc.

PENN Entertainment Inc. - Overview
PENN Entertainment Inc. - Business segments
PENN Entertainment Inc. - Key offerings
PENN Entertainment Inc. - Segment focus
SWOT

15.16 Playtech Plc

Playtech Plc - Overview
Playtech Plc - Business segments
Playtech Plc - Key offerings
Playtech Plc - Segment focus
SWOT

15.17 Sportradar Group AG

Sportradar Group AG - Overview
Sportradar Group AG - Product / Service
Sportradar Group AG - Key offerings
SWOT

15.18 Super Group SGHC Ltd.

Super Group SGHC Ltd. - Overview
Super Group SGHC Ltd. - Business segments
Super Group SGHC Ltd. - Key offerings
Super Group SGHC Ltd. - Segment focus
SWOT

16. Appendix

16.1 Scope of the report

Market definition
Objectives
Notes and caveats

16.2 Inclusions and exclusions checklist

Inclusions checklist
Exclusions checklist

16.3 Currency conversion rates for US$

16.4 Research methodology

16.5 Data procurement

Information sources

16.6 Data validation

16.7 Validation techniques employed for market sizing

16.8 Data synthesis

16.9 360 degree market analysis

16.10 List of abbreviations

Research Methodology

Technavio presents a detailed picture of the market by way of study, synthesis, and summation of data from multiple sources. The analysts have presented the various facets of the market with a particular focus on identifying the key industry influencers. The data thus presented is comprehensive, reliable, and the result of extensive research, both primary and secondary.

INFORMATION SOURCES

Primary sources

  • Manufacturers and suppliers
  • Channel partners
  • Industry experts
  • Strategic decision makers

Secondary sources

  • Industry journals and periodicals
  • Government data
  • Financial reports of key industry players
  • Historical data
  • Press releases

DATA ANALYSIS

Data Synthesis

  • Collation of data
  • Estimation of key figures
  • Analysis of derived insights

Data Validation

  • Triangulation with data models
  • Reference against proprietary databases
  • Corroboration with industry experts

REPORT WRITING

Qualitative

  • Market drivers
  • Market challenges
  • Market trends
  • Five forces analysis

Quantitative

  • Market size and forecast
  • Market segmentation
  • Geographical insights
  • Competitive landscape

Interested in this report?

Get your sample now to see our research methodology and insights!

Download Now

Frequently Asked Questions

Horse And Sports Betting market growth will increase by USD 283.7 million during 2026-2030.

The Horse And Sports Betting market is expected to grow at a CAGR of 11.6% during 2026-2030.

Horse And Sports Betting market is segmented by Platform (Offline betting, Online betting) Type (Fixed odds wagering, Exchange betting, Live betting, eSports betting, Others) Event type (Football and soccer, Virtual betting events, Horse racing, eSports events)

Ballys Corp., Bet365 Group Ltd., Betfred Group, Betsson AB, Caesars Entertainment Inc., DraftKings Inc., EveryMatrix Ltd, FDJ United, Flutter Entertainment Plc, Genius Sports Ltd, International Game Technology, MGM Resorts International, OpenBet, PENN Entertainment Inc., Playtech Plc, Sportradar Group AG, Super Group SGHC Ltd., The Betway Group, Tipico Group Ltd are a few of the key vendors in the Horse And Sports Betting market.

Europe will register the highest growth rate of 47.2% among the other regions. Therefore, the Horse And Sports Betting market in Europe is expected to garner significant business opportunities for the vendors during the forecast period.

UK, Germany, France, Italy, Spain, The Netherlands, China, Japan, Australia, India, South Korea, Indonesia, US, Canada, Mexico, Brazil, Argentina, Chile, UAE, Saudi Arabia, South Africa, Turkey, Israel

  • Acceleration of digital connectivity and high-speed mobile infrastructure is the driving factor this market.

The Horse And Sports Betting market vendors should focus on grabbing business opportunities from the Platform segment as it accounted for the largest market share in the base year.
RIA - Research AI Assistant
Ask RIA