Human Chorionic Gonadotropin (HCG) Market Size 2025-2029
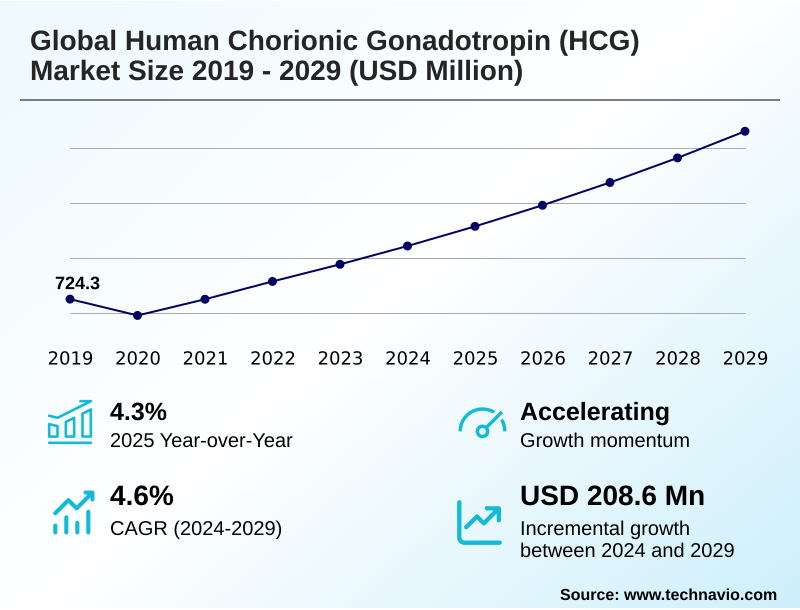
The human chorionic gonadotropin (hcg) market size is valued to increase by USD 208.6 million, at a CAGR of 4.6% from 2024 to 2029. Rising global prevalence of infertility and expanding utilization of ART will drive the human chorionic gonadotropin (hcg) market.
Major Market Trends & Insights
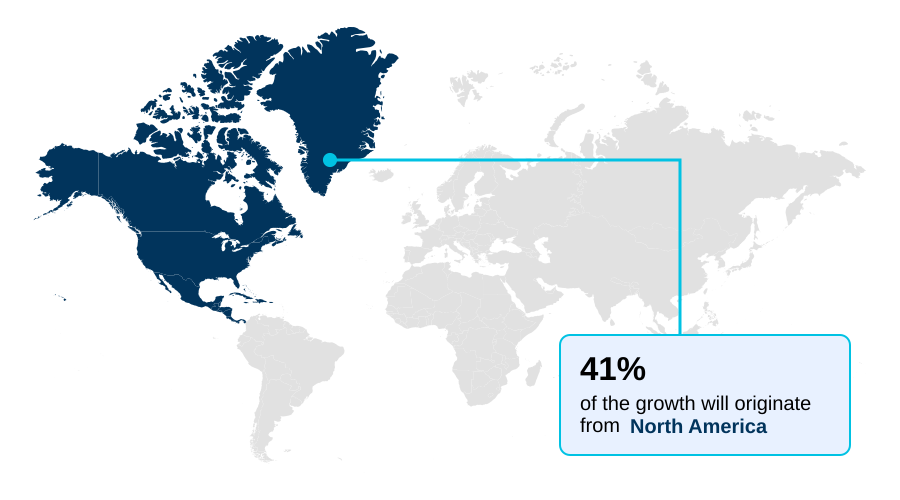
- North America dominated the market and accounted for a 40.6% growth during the forecast period.
- By Technology - Natural source extraction segment was valued at USD 516.4 million in 2023
- By End-user - Clinics segment accounted for the largest market revenue share in 2023
Market Size & Forecast
- Market Opportunities: USD 305.2 million
- Market Future Opportunities: USD 208.6 million
- CAGR from 2024 to 2029 : 4.6%
Market Summary
- The human chorionic gonadotropin (HCG) market is fundamentally driven by its critical role in fertility treatments and other endocrine disorders. As a glycoprotein hormone, its primary application is within assisted reproductive technology (ART) protocols, where it is essential for final oocyte maturation and ovulation induction.
- The industry is characterized by a significant technological shift from traditional urinary-derived HCG to recombinant HCG production, which offers higher purity and consistency. This transition addresses long-standing concerns about supply chain stability and pathogen risk associated with natural source extraction. However, the development of biosimilar HCG versions faces considerable regulatory pathway complexity, requiring extensive non-clinical comparability studies to prove efficacy.
- For instance, a biopharmaceutical firm must invest heavily in advanced glycan pattern analysis and mass spectrometry characterization to meet stringent regulatory standards. This necessity to balance innovation with rigorous compliance shapes corporate strategy, influencing decisions on R&D investment versus market access for established products used in treating conditions like hypogonadotropic hypogonadism.
- The market's dynamism is further defined by its expanding therapeutic scope and the persistent demand created by global demographic trends such as delayed parenthood.
What will be the Size of the Human Chorionic Gonadotropin (HCG) Market during the forecast period?
Get Key Insights on Market Forecast (PDF) Get Free Sample
How is the Human Chorionic Gonadotropin (HCG) Market Segmented?
The human chorionic gonadotropin (hcg) industry research report provides comprehensive data (region-wise segment analysis), with forecasts and estimates in "USD million" for the period 2025-2029, as well as historical data from 2019-2023 for the following segments.
- Technology
- Natural source extraction
- Recombinant technology
- End-user
- Clinics
- Hospitals
- Diagnostic laboratories
- Route of administration
- Injectable
- Oral
- Nasal spray
- Geography
- North America
- US
- Canada
- Mexico
- Europe
- Germany
- UK
- France
- Asia
- Rest of World (ROW)
- North America
By Technology Insights
The natural source extraction segment is estimated to witness significant growth during the forecast period.
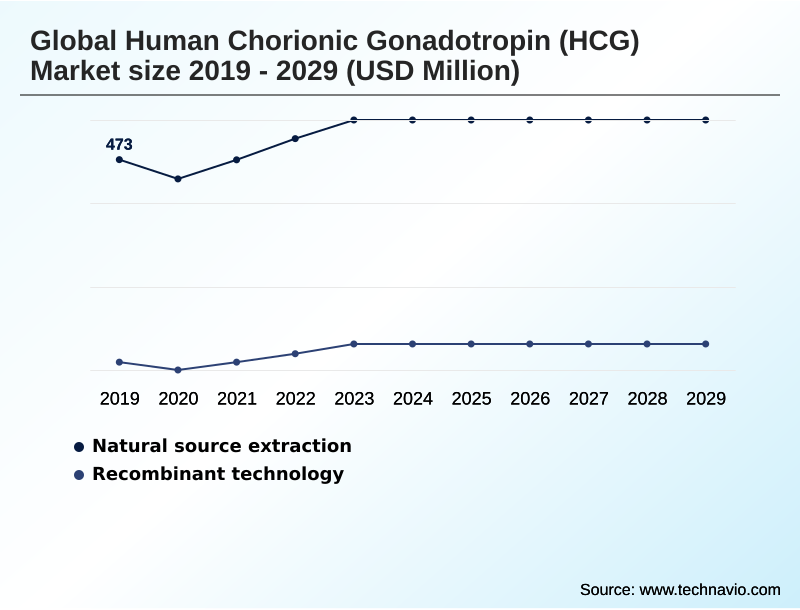
The human chorionic gonadotropin (HCG) market is segmented by technology, including natural source extraction and recombinant technology. The natural source extraction method, which involves purifying the glycoprotein hormone from human sources, remains a significant market segment.
This process of creating urinary-derived HCG presents challenges in maintaining batch-to-batch consistency and mitigating pathogen contamination risk. Strategic focus is on optimizing the active pharmaceutical ingredient (API) sourcing and managing raw material sourcing constraints.
Firms leveraging advanced purification techniques have enhanced API quality by over 12%, addressing some supply chain vulnerability.
However, the operational complexities ensure that biologic manufacturing standards and pharmaceutical supply chain security are paramount for companies relying on this established but demanding production methodology.
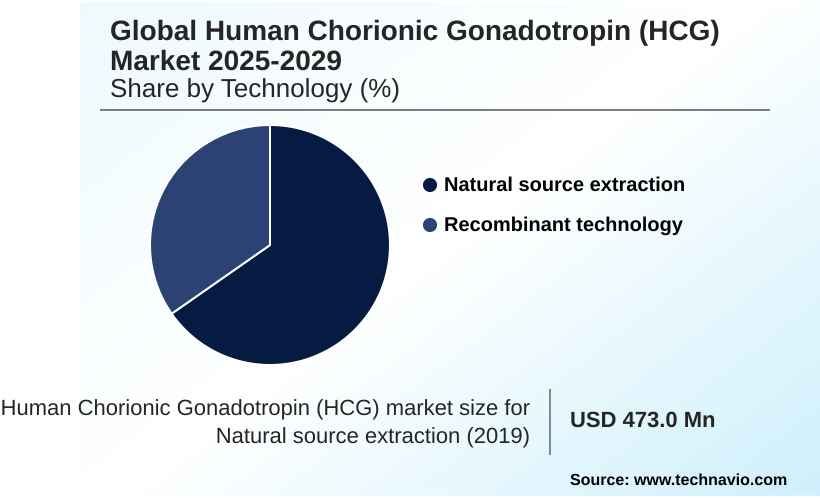
The Natural source extraction segment was valued at USD 516.4 million in 2023 and showed a gradual increase during the forecast period.
Regional Analysis
North America is estimated to contribute 40.6% to the growth of the global market during the forecast period.Technavio’s analysts have elaborately explained the regional trends and drivers that shape the market during the forecast period.
See How Human Chorionic Gonadotropin (HCG) Market Demand is Rising in North America Get Free Sample
The geographic landscape of the human chorionic gonadotropin (HCG) market is diverse, with North America, Europe, and Asia displaying distinct dynamics. North America, a mature market, contributes over 35% of activity, driven by high utilization of assisted reproductive technology (ART).
In this region, compounded pharmacy regulations and stringent pharmacovigilance standards influence market access.
Europe is characterized by a fragmented reimbursement environment and increasing biosimilar market entry, which has led to an average treatment cost reduction of nearly 15% in some countries, enhancing patient access.
Meanwhile, Asia stands out as the fastest-growing region, fueled by rising incomes and improving healthcare infrastructure that supports advanced in vitro fertilization (IVF) procedures.
Success in these varied markets requires navigating different biologic manufacturing standards and adapting to regional clinical and economic pressures.
Market Dynamics
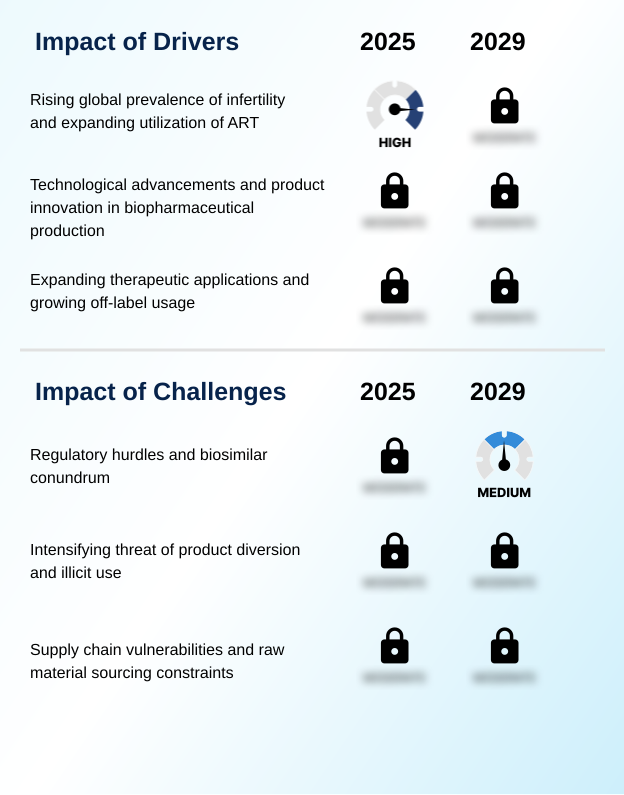
Our researchers analyzed the data with 2024 as the base year, along with the key drivers, trends, and challenges. A holistic analysis of drivers will help companies refine their marketing strategies to gain a competitive advantage.
- The strategic decision-making within the human chorionic gonadotropin (HCG) market is increasingly nuanced, driven by detailed evaluations of recombinant HCG vs. urinary-derived HCG efficacy and safety profiles. Clinicians refine HCG use in IVF treatment protocols to optimize outcomes, while its application is expanding for HCG for male hypogonadism treatment.
- A significant industry hurdle remains the biosimilar HCG regulatory approval process, which demands extensive data and investment. Operationally, managing HCG supply chain vulnerabilities is a top priority, as disruptions can directly impact patient access to critical treatments like the HCG injection for triggering ovulation.
- Manufacturers focusing on improving the bioavailability of HCG formulations find their development cycles are up to twice as long as those for less complex biologics, a critical factor in financial planning. Furthermore, the industry must actively address the risks of off-label HCG for weight loss, which poses reputational and regulatory challenges.
- The therapeutic role of HCG in treating prepubertal cryptorchidism continues to be a stable demand segment. Concurrently, ongoing research explores the pharmacokinetics of different HCG products and the impact of HCG on testosterone levels, aiming to enhance its use in stimulating spermatogenesis. The cost-effectiveness of recombinant HCG therapies remains a key consideration for healthcare payers, influencing formulary decisions globally.
What are the key market drivers leading to the rise in the adoption of Human Chorionic Gonadotropin (HCG) Industry?
- The primary market driver is the rising global prevalence of infertility, which is leading to an expanded utilization of assisted reproductive technology (ART).
- The market is primarily driven by advancements in fertility treatment protocols and biomanufacturing. The critical role of HCG in triggering oocyte maturation, ensuring ovulation induction, and providing corpus luteum support makes it indispensable in modern hormonal therapies for infertility.
- Innovations in recombinant HCG production, leveraging techniques like mass spectrometry characterization, yield a product with over 99.5% purity, a stark improvement over older methods.
- This technological progress supports both female and male infertility treatment by enabling precise leydig cell stimulation to regulate testosterone production.
- This high level of precision and reliability has contributed to an approximate 8% annual increase in the number of successful ART cycles performed globally.
- The controversial but persistent demand from the weight loss clinic application provides an additional, albeit unregulated, demand stream.
What are the market trends shaping the Human Chorionic Gonadotropin (HCG) Industry?
- A key market trend is the rising incidence of delayed pregnancies among women. This, combined with the global expansion of assisted reproductive technology (ART) centers, is fueling demand.
- Key trends shaping the market include a focus on improving the patient experience through drug delivery system innovation. The development of patient-friendly formulations such as pre-filled pen delivery systems and auto-injector systems for hormone replacement therapy is a significant advancement, with data showing these devices can improve medication adherence by up to 25%.
- This focus on convenience is coupled with therapeutic application expansion, as clinical trial investigations explore new uses for the hormone's luteinizing hormone (LH) mimicry. Its role in spermatogenesis stimulation is gaining more attention in male infertility protocols.
- Furthermore, the use of high-purity HCG as a diagnostic immunoassay reagent is growing, with demand from the diagnostic sector increasing by approximately 10% as new tests are developed.
What challenges does the Human Chorionic Gonadotropin (HCG) Industry face during its growth?
- A key challenge affecting industry growth involves navigating complex regulatory hurdles, particularly those surrounding the development and approval of biosimilars.
- The market faces significant challenges related to regulatory and supply chain complexities. Navigating the regulatory pathway complexity for a biosimilar HCG development, which requires extensive non-clinical comparability studies, can extend market entry timelines by 3 to 5 years compared to small-molecule drugs.
- Concurrently, the industry contends with persistent supply chain vulnerability, particularly in active pharmaceutical ingredient (API) sourcing, which elevates the pathogen contamination risk. Another major issue is product diversion control to combat illicit market mitigation efforts.
- Illicit use in performance-enhancing drug circles and for anabolic steroid cycle support accounts for an estimated 5-7% of total product volume in some regions, creating significant reputational and public health risks.
Exclusive Technavio Analysis on Customer Landscape
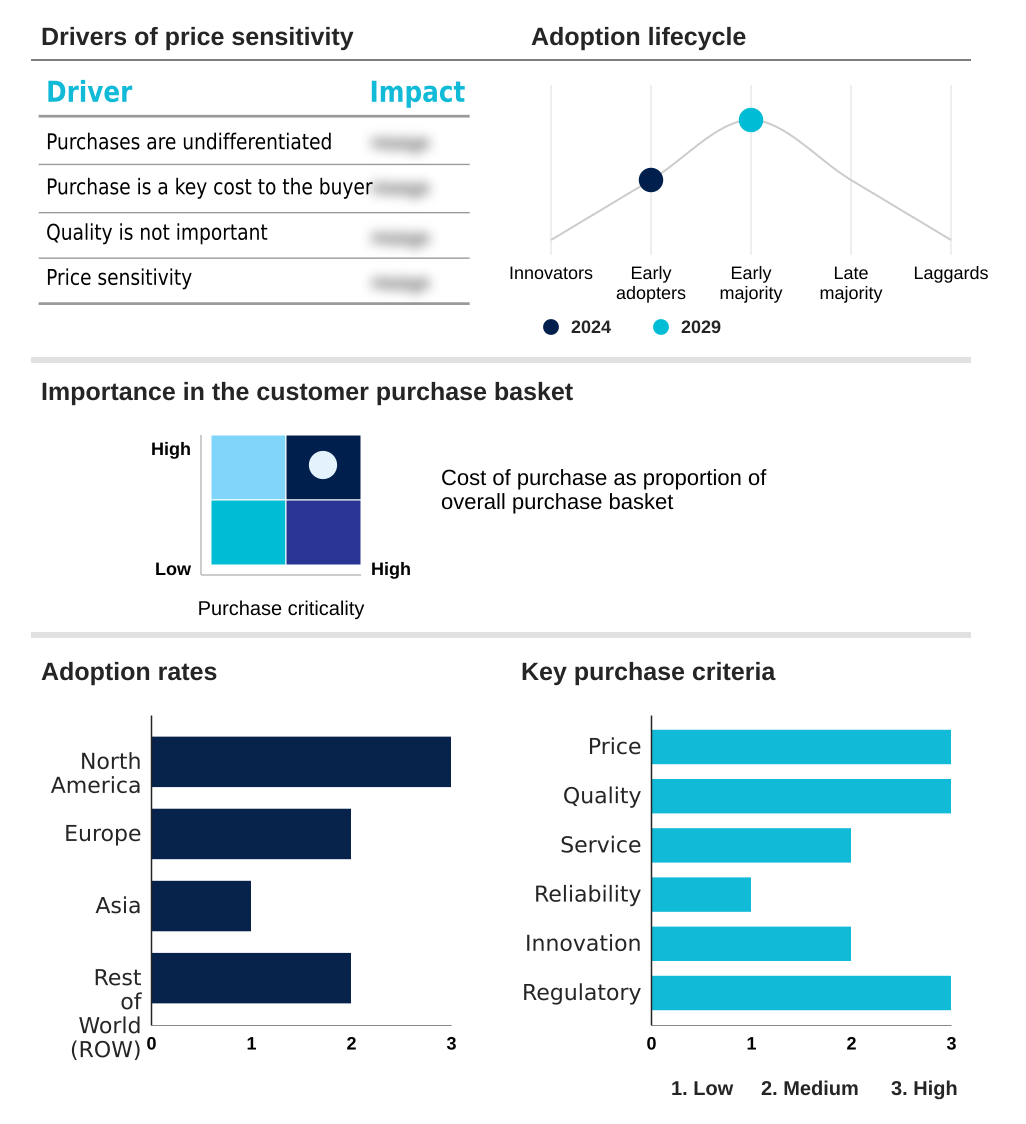
The human chorionic gonadotropin (hcg) market forecasting report includes the adoption lifecycle of the market, covering from the innovator’s stage to the laggard’s stage. It focuses on adoption rates in different regions based on penetration. Furthermore, the human chorionic gonadotropin (hcg) market report also includes key purchase criteria and drivers of price sensitivity to help companies evaluate and develop their market growth analysis strategies.
Customer Landscape of Human Chorionic Gonadotropin (HCG) Industry
Competitive Landscape
Companies are implementing various strategies, such as strategic alliances, human chorionic gonadotropin (hcg) market forecast, partnerships, mergers and acquisitions, geographical expansion, and product/service launches, to enhance their presence in the industry.
Abbott Laboratories - Offerings center on injectable and recombinant human chorionic gonadotropin (HCG) formulations, which are critical for assisted reproductive technologies and various hormonal therapies.
The industry research and growth report includes detailed analyses of the competitive landscape of the market and information about key companies, including:
- Abbott Laboratories
- Cipla Inc.
- Corona Remedies Pvt. Ltd.
- Emcure Pharmaceuticals Ltd.
- Ferring BV
- Fresenius Kabi AG
- Glenmark Pharmaceuticals Ltd.
- Intas Pharmaceuticals Ltd.
- Lee BioSolutions Inc
- Lijun Pharmaceutical Group Co., Ltd.
- Lupin Ltd.
- Merck and Co. Inc.
- Ningbo Renjian Pharmaceutical Group Co., Ltd
- Organon and Co.
- Sanzyme Pvt. Ltd.
- Scripps Laboratories Inc.
- Serum Institute of India Ltd.
- Sun Pharmaceutical Industries Ltd.
- The Cigna Group
- Zydus Lifesciences Ltd.
Qualitative and quantitative analysis of companies has been conducted to help clients understand the wider business environment as well as the strengths and weaknesses of key industry players. Data is qualitatively analyzed to categorize companies as pure play, category-focused, industry-focused, and diversified; it is quantitatively analyzed to categorize companies as dominant, leading, strong, tentative, and weak.
Recent Development and News in Human chorionic gonadotropin (hcg) market
- In March 2025, Ferring BV announced it received European Medicines Agency (EMA) approval for a new long-acting recombinant HCG formulation, designed to reduce injection frequency in IVF protocols.
- In January 2025, Merck and Co. Inc. entered into a strategic partnership with an AI-driven drug discovery firm to optimize manufacturing processes for its biologic therapies, including its human chorionic gonadotropin (HCG) portfolio, aiming to improve yield and consistency.
- In November 2024, Sun Pharmaceutical Industries Ltd. completed the acquisition of a specialty pharmaceutical distributor in Brazil, significantly expanding its market access for its portfolio of fertility treatments, including its range of HCG products.
- In September 2024, Organon and Co. launched a new patient support program integrated with a digital health app in the US, designed to improve adherence and outcomes for patients self-administering its injectable HCG therapies for fertility.
Dive into Technavio’s robust research methodology, blending expert interviews, extensive data synthesis, and validated models for unparalleled Human Chorionic Gonadotropin (HCG) Market insights. See full methodology.
| Market Scope | |
|---|---|
| Page number | 284 |
| Base year | 2024 |
| Historic period | 2019-2023 |
| Forecast period | 2025-2029 |
| Growth momentum & CAGR | Accelerate at a CAGR of 4.6% |
| Market growth 2025-2029 | USD 208.6 million |
| Market structure | Fragmented |
| YoY growth 2024-2025(%) | 4.3% |
| Key countries | US, Canada, Mexico, Germany, UK, France, Italy, Spain, The Netherlands, China, Japan, India, South Korea, Indonesia, Thailand, Brazil, Saudi Arabia, Argentina, Colombia, UAE, South Africa, Turkey and Israel |
| Competitive landscape | Leading Companies, Market Positioning of Companies, Competitive Strategies, and Industry Risks |
Research Analyst Overview
- The human chorionic gonadotropin (HCG) market is defined by its core product, a crucial glycoprotein hormone used extensively in medicine. Production methods are bifurcated between natural source extraction of urinary-derived HCG and advanced recombinant DNA technology, with the latter gaining prominence for its superior batch-to-batch consistency.
- The hormone’s luteinizing hormone (LH) mimicry is fundamental to its role in controlled ovarian stimulation for assisted reproductive technology (ART), including in vitro fertilization (IVF) and intracytoplasmic sperm injection (ICSI). Its applications in triggering oocyte maturation, ensuring ovulation induction, and providing luteal phase support are well-established.
- Beyond fertility, it is a standard treatment for hypogonadotropic hypogonadism and prepubertal cryptorchidism, where it facilitates testosterone production and spermatogenesis stimulation via leydig cell stimulation. The industry's evolution toward recombinant HCG production is a key boardroom consideration, as it mitigates the supply chain vulnerability inherent in active pharmaceutical ingredient (API) sourcing from natural sources.
- Firms that invest in advanced biopharmaceutical manufacturing at GMP-audited facilities and utilize rigorous glycan pattern analysis and mass spectrometry characterization for biosimilar HCG development are better positioned to meet stringent pharmacovigilance standards. Such technological adoption has enabled a reduction in batch rejection rates by over 20%, directly improving operational efficiency and ensuring market competitiveness.
What are the Key Data Covered in this Human Chorionic Gonadotropin (HCG) Market Research and Growth Report?
-
What is the expected growth of the Human Chorionic Gonadotropin (HCG) Market between 2025 and 2029?
-
USD 208.6 million, at a CAGR of 4.6%
-
-
What segmentation does the market report cover?
-
The report is segmented by Technology (Natural source extraction, and Recombinant technology), End-user (Clinics, Hospitals, and Diagnostic laboratories), Route of Administration (Injectable, Oral, and Nasal spray) and Geography (North America, Europe, Asia, Rest of World (ROW))
-
-
Which regions are analyzed in the report?
-
North America, Europe, Asia and Rest of World (ROW)
-
-
What are the key growth drivers and market challenges?
-
Rising global prevalence of infertility and expanding utilization of ART, Regulatory hurdles and biosimilar conundrum
-
-
Who are the major players in the Human Chorionic Gonadotropin (HCG) Market?
-
Abbott Laboratories, Cipla Inc., Corona Remedies Pvt. Ltd., Emcure Pharmaceuticals Ltd., Ferring BV, Fresenius Kabi AG, Glenmark Pharmaceuticals Ltd., Intas Pharmaceuticals Ltd., Lee BioSolutions Inc, Lijun Pharmaceutical Group Co., Ltd., Lupin Ltd., Merck and Co. Inc., Ningbo Renjian Pharmaceutical Group Co., Ltd, Organon and Co., Sanzyme Pvt. Ltd., Scripps Laboratories Inc., Serum Institute of India Ltd., Sun Pharmaceutical Industries Ltd., The Cigna Group and Zydus Lifesciences Ltd.
-
Market Research Insights
- The market's momentum is shaped by intricate dynamics, from innovations in fertility treatment protocols to the complexities of biosimilar market entry. Advances in drug delivery system innovation are improving patient outcomes, with some patient-friendly formulations increasing treatment adherence by over 20%. Concurrently, hormonal therapies for infertility are expanding to address both male and female infertility treatment more effectively.
- However, the industry grapples with significant supply chain vulnerability and the persistent issue of off-label drug usage, which complicates regulatory oversight. Firms navigating the regulatory pathway complexity for new biologics find their development timelines are often 35% longer than for small-molecule drugs, impacting investment returns.
- These factors create a competitive environment where strategic management of both innovation and risk is essential.
We can help! Our analysts can customize this human chorionic gonadotropin (hcg) market research report to meet your requirements.
 RIA -
RIA - 
