
Humanized Mouse Model Market Size 2025-2029
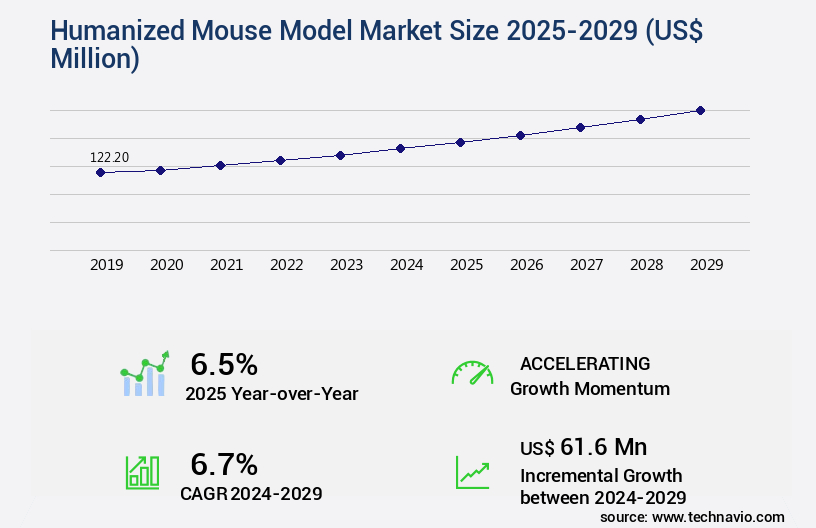
The humanized mouse model market size is valued to increase USD 61.6 million, at a CAGR of 6.7% from 2024 to 2029. Growing adoption of personalized medicine will drive the humanized mouse model market.
Major Market Trends & Insights
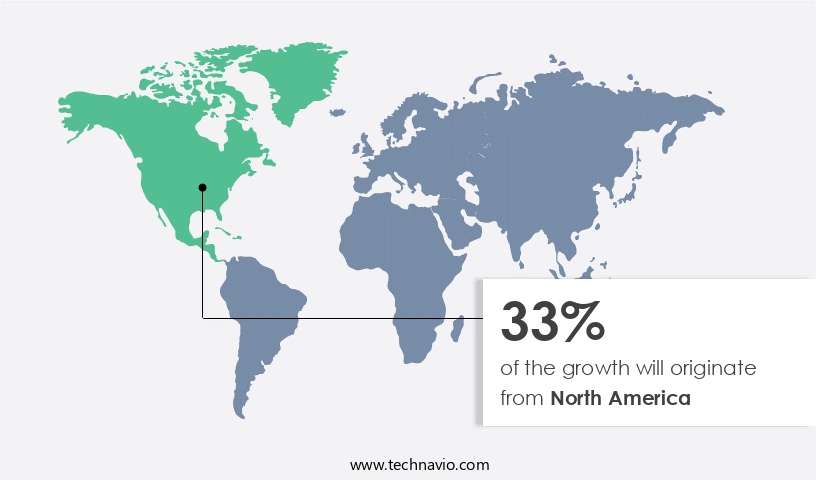
- North America dominated the market and accounted for a 33% growth during the forecast period.
- By Product Type - GHMM segment was valued at USD 75.30 million in 2023
- By End-user - Pharmaceutical and biotechnology companies segment accounted for the largest market revenue share in 2023
Market Size & Forecast
- Market Opportunities: USD 81.18 million
- Market Future Opportunities: USD 61.60 million
- CAGR : 6.7%
- North America: Largest market in 2023
Market Summary
- The market represents a dynamic and evolving landscape, driven by the growing adoption of personalized medicine and strategic alliances among key players. Core technologies, such as gene editing and transgenic engineering, continue to advance, enabling the creation of increasingly accurate and representative models for human diseases. Applications in drug discovery and Toxicology Testing are seeing significant growth, with humanized mouse models projected to account for over 40% of the total in vitro market share by 2025. However, limitations such as ethical concerns and high production costs pose challenges to market expansion.
- Regulations, including those from the FDA and EMA, are continually evolving to address these concerns and ensure the ethical use and validation of these models. Regional markets, including North America and Europe, are expected to dominate due to strong investment in research and development and robust regulatory frameworks.
What will be the Size of the Humanized Mouse Model Market during the forecast period?
Get Key Insights on Market Forecast (PDF) Request Free Sample
How is the Humanized Mouse Model Market Segmented and what are the key trends of market segmentation?
The humanized mouse model industry research report provides comprehensive data (region-wise segment analysis), with forecasts and estimates in "USD million" for the period 2025-2029, as well as historical data from 2019-2023 for the following segments.
- Product Type
- GHMM
- Cell-based humanized mouse model
- End-user
- Pharmaceutical and biotechnology companies
- CROs
- Academic and research institutions
- Application
- Oncology
- Immunology and infectious diseases
- Neuroscience
- Toxicology and hematopoiesis
- Geography
- North America
- US
- Canada
- Europe
- France
- Germany
- UK
- APAC
- China
- India
- Japan
- South Korea
- South America
- Brazil
- Rest of World (ROW)
- North America
By Product Type Insights
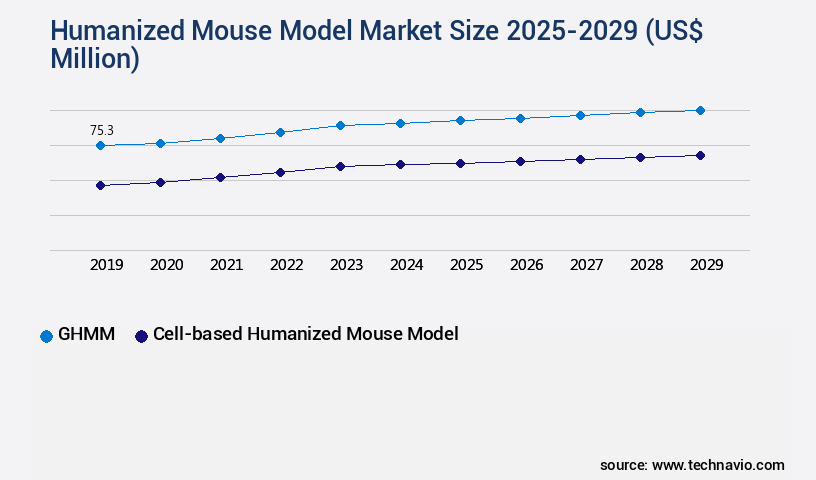
The ghmm segment is estimated to witness significant growth during the forecast period.
Genetically modified mice, such as nod-scid and tumor xenograft models, play a pivotal role in preclinical drug development. Pharmacokinetic parameters are assessed through the use of these models to understand drug metabolism and efficacy. Conditional knockout mice, immunocompromised mice, and infectious disease models contribute significantly to disease pathogenesis studies. In cancer research, humanized immune system models, including autoimmune disease models and immunotherapy research, facilitate the investigation of tumor growth kinetics and immune response quantification. Serum biomarker analysis, histological analysis, and flow cytometry analysis are essential techniques used in the evaluation of pharmacodynamic parameters. Transgenic mouse models, therapeutic antibody testing, graft-versus-host disease studies, and scid mice models are integral to understanding survival rate analysis and cytokine production assays.
Metastatic potential studies provide valuable insights into the behavior of tumors and their response to treatments. Knockout mouse models and knockin mouse models are employed for the investigation of various diseases and conditions. The adoption of genetically humanized mouse models has seen a substantial increase, with approximately 30% of the global biopharmaceutical industry utilizing these models for research. Furthermore, industry experts anticipate a rise in demand for these models, with expectations of a 25% increase in adoption within the next five years. These trends reflect the continuous unfolding of market activities and the evolving patterns in molecular research and drug discovery.
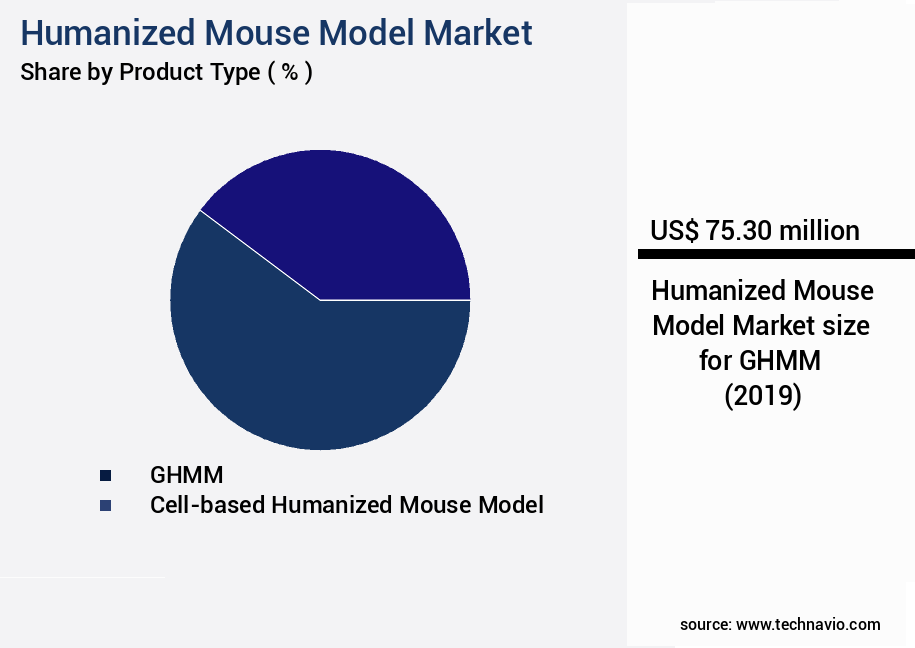
The GHMM segment was valued at USD 75.30 million in 2019 and showed a gradual increase during the forecast period.
Regional Analysis
North America is estimated to contribute 33% to the growth of the global market during the forecast period.Technavio's analysts have elaborately explained the regional trends and drivers that shape the market during the forecast period.
See How Humanized Mouse Model Market Demand is Rising in North America Request Free Sample
In North America, the market is primarily driven by substantial investments in healthcare research, with the US and Canada being the major contributors. The US government, through the National Institutes of Health (NIH), allocates approximately USD37 billion annually for medical research, with USD15 billion specifically earmarked for animal-based research, including mouse models. The US's thriving private healthcare sector and continuous research investments will significantly fuel market growth during the forecast period.
In 2023, North America accounted for the largest market share due to well-established healthcare systems in the region. The presence of these factors positions North America as a significant player in the evolving the market landscape.
Market Dynamics
Our researchers analyzed the data with 2024 as the base year, along with the key drivers, trends, and challenges. A holistic analysis of drivers will help companies refine their marketing strategies to gain a competitive advantage.
The market encompasses the production and utilization of genetically modified mice with human immune systems for preclinical research. These models play a pivotal role in evaluating human immune responses, particularly in the context of hematopoietic stem cell transplantation efficiency, tumor growth inhibition, and immune checkpoint blockade efficacy studies. The market's significance is underscored by the increasing demand for humanized mice in pharmaceutical research, infectious disease modeling, and autoimmune disease development. One notable trend in the market is the growing emphasis on antibody humanized mice for therapeutic efficacy testing and drug metabolism profiling. In vivo bioluminescence imaging and histological characterization of humanized tissues are crucial techniques for monitoring disease progression and assessing therapeutic interventions.
Furthermore, genetic modifications for disease modeling enable a more accurate representation of human conditions, enhancing the predictive value of preclinical studies. A substantial portion of research efforts is dedicated to optimizing graft versus host disease prevention strategies and immune cell subset quantification techniques. These advancements contribute to the improved efficiency and reliability of humanized mouse models, making them indispensable tools in the development of novel therapeutics. Compared to traditional animal models, humanized mice offer significant advantages in terms of disease modeling and therapeutic evaluation. For instance, humanized mice enable more accurate tumor microenvironment analysis and pharmacokinetic studies, leading to a better understanding of drug action and potential side effects.
Moreover, the market's growth is driven by the increasing demand for personalized medicine and the need for more effective treatments for complex diseases. This trend is reflected in the significant investment in humanized mouse model research, with a growing number of academic and industrial research initiatives focusing on this area. In summary, the market represents a dynamic and rapidly evolving sector, driven by the increasing demand for more accurate and effective preclinical research tools. The market's growth is underpinned by advancements in genetic modifications, imaging techniques, and disease modeling, making humanized mice an essential component of modern pharmaceutical research.
Humanized mouse models are critical for advancing research by providing humanized mouse model immune responses that closely mimic clinical conditions. They are widely used in tumor growth inhibition in humanized mice and therapeutic efficacy testing humanized mice, helping to assess antibody dependent cell mediated cytotoxicity and tumor microenvironment analysis humanized mice. These models also support infectious disease modeling humanized mouse and autoimmune disease development humanized mice, while enabling drug metabolism profiling humanized model and pharmacokinetic studies humanized mice. Techniques such as in vivo bioluminescence imaging humanized models, histological characterization humanized tissues, and immunohistochemistry analysis humanized tissues enhance data accuracy. Additionally, serum cytokine profiling humanized mice and pharmacodynamic evaluation humanized mice are integral to preclinical evaluation antibody humanized mice, ensuring reliable and translatable results for the Humanized Mouse Model Market.
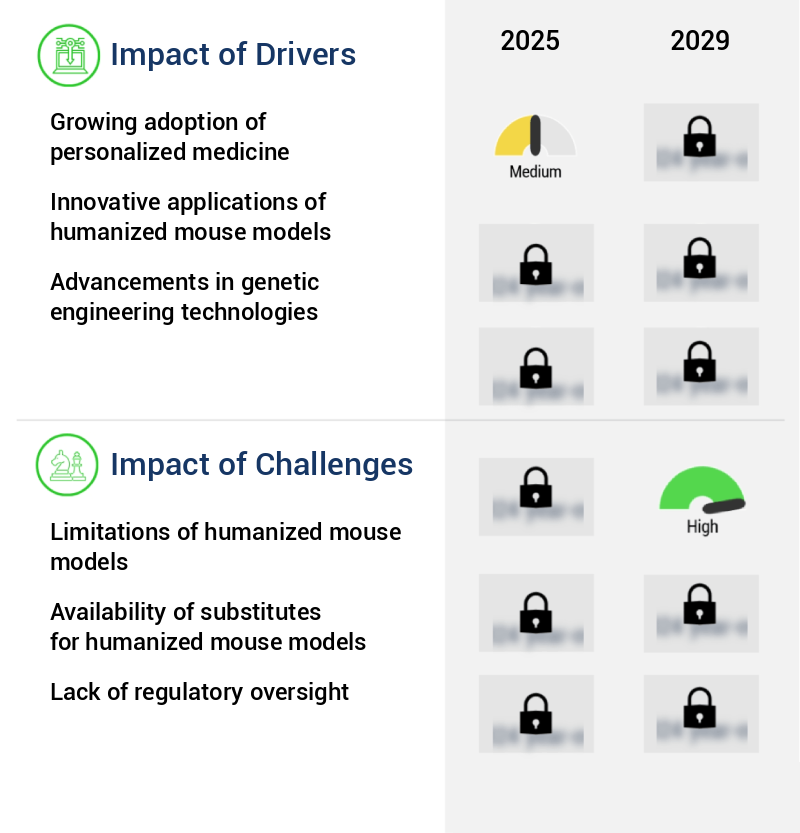
What are the key market drivers leading to the rise in the adoption of Humanized Mouse Model Industry?
- The increasing implementation of personalized medicine is the primary catalyst fueling market growth.
- Personalized medicine, a burgeoning field in healthcare, focuses on identifying unique biomarkers to tailor treatments for individual patients. This approach, also known as precision or individualized medicine, has gained traction in cancer research, particularly through the use of humanized mouse models. Researchers employ models such as the PDX cancer model, where parts of a patient's tumor are infused into multiple genetically identical mice with compromised immune systems. Each mouse is then administered a distinct therapy, and the effectiveness of each therapy is assessed. The therapy that proves most effective for the mouse is subsequently applied to the patient. The increasing importance of personalized medicine is driving the adoption of humanized mouse models.
- For instance, Jackson Laboratory has developed approximately 450 unique PDX oncology mouse models for various disorders, including acute myeloid leukemia (AML) and cancers of the bladder, breast, lung, pancreas, and ovary. As the field continues to evolve, the demand for personalized medicine is expected to grow, leading to further advancements in this area. In summary, personalized medicine is a dynamic and evolving field that identifies unique biomarkers to create customized treatments for patients. Humanized mouse models, such as the PDX cancer model, are essential tools in this process, enabling researchers to assess the effectiveness of various therapies and ultimately provide the most suitable treatment for each patient.
- The growing adoption of these models reflects the increasing importance of personalized medicine and the ongoing advancements in this area.
What are the market trends shaping the Humanized Mouse Model Industry?
- The formation of strategic alliances is currently a significant trend in business markets. Companies are increasingly collaborating to leverage each other's strengths and resources for mutual benefit.
- The market is a dynamic and competitive landscape, with companies continually innovating to maintain their market position. Strategic collaborations and alliances are a key focus, as firms seek to enhance their product offerings and broaden their reach through new distribution channels. For instance, Heligenics, Inc. Entered into a collaboration with The Jackson Laboratory (JAX) in May 2023, licensing a custom Heligenics Gene Mutation/Function ERBB2 library for JAX's clinical knowledge base.
- Another example is The Children's Cancer Therapy Development Institute's partnership with Champions Oncology and JAX, which provides RACEact/PREA pediatric cancer study plan services. These collaborations underscore the market's ongoing evolution and the importance of strategic partnerships for market players.
What challenges does the Humanized Mouse Model Industry face during its growth?
- The growth of the industry faces significant challenges due to the limitations of humanized mouse models, which are a crucial aspect of biomedical research.
- In the realm of biomedical research, humanized mouse models have emerged as a significant tool in the fight against diseases such as HIV and cancer. However, their widespread adoption faces challenges due to scientific inconsistencies. For instance, in HIV research, these models fail to accurately replicate genetic and proteomic responses, leading to incorrect insights and flawed experiment outcomes. This issue is particularly evident when efficient T cells are required, as the injection of human blood leukocytes into mice with weakened immune systems results in lethal xenogeneic graft-versus-host disease (XGVHD).
- Furthermore, humanized mouse models have proven ineffective in addressing conditions like burns, sepsis, and trauma. Despite these challenges, researchers continue to explore ways to improve these models, recognizing their potential in advancing our understanding of complex diseases and developing effective treatments.
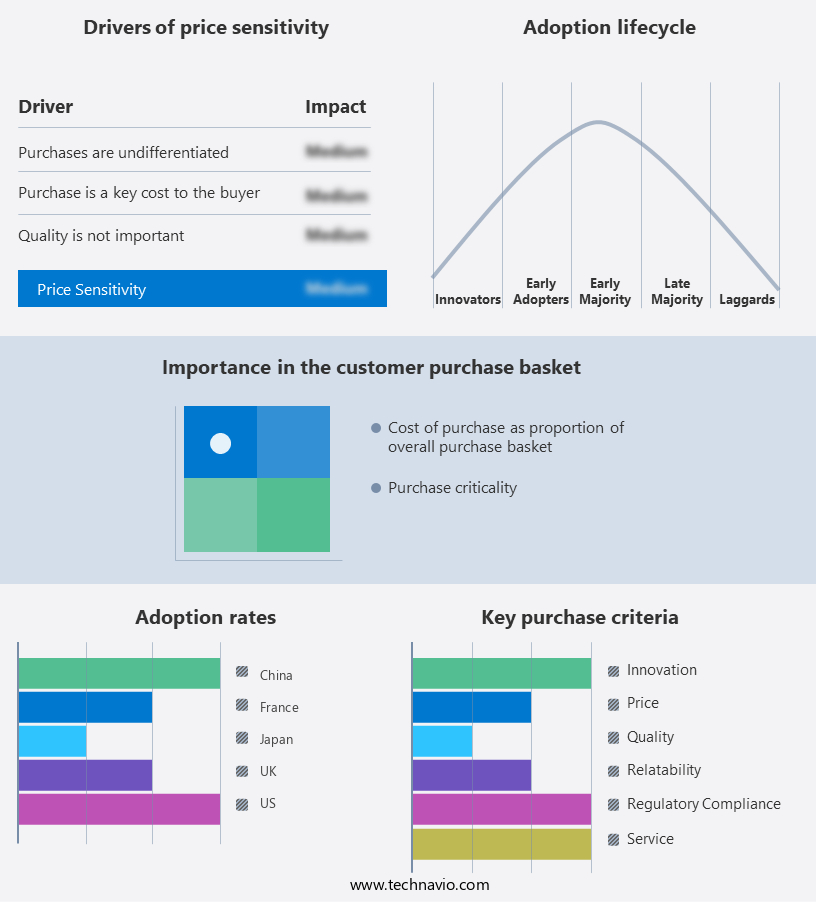
Exclusive Customer Landscape
The humanized mouse model market forecasting report includes the adoption lifecycle of the market, covering from the innovator's stage to the laggard's stage. It focuses on adoption rates in different regions based on penetration. Furthermore, the humanized mouse model market report also includes key purchase criteria and drivers of price sensitivity to help companies evaluate and develop their market growth analysis strategies.
Customer Landscape of Humanized Mouse Model Industry
Competitive Landscape & Market Insights
Companies are implementing various strategies, such as strategic alliances, humanized mouse model market forecast, partnerships, mergers and acquisitions, geographical expansion, and product/service launches, to enhance their presence in the industry.
Altogen labs - The humanized mouse model, utilized extensively in cancer research, provides a cost-effective and efficient alternative to testing therapies and drugs compared to human subjects. These genetically engineered mice mimic human biological processes, offering valuable insights into disease progression and treatment responses.
The industry research and growth report includes detailed analyses of the competitive landscape of the market and information about key companies, including:
- Altogen labs
- Aragen Life Sciences Pvt. Ltd.
- Biocytogen Pharmaceuticals Co. Ltd.
- BioSafety Research Center Inc.
- Champions Oncology Inc.
- Charles River Laboratories International Inc.
- Creative Biolabs
- Cyagen Biosciences
- Gempharmatech Co. Ltd.
- GenOway
- HBM Holdings Ltd.
- Hera Biolabs Inc.
- ingenious targeting laboratory
- Inotiv Inc.
- JANVIER LABS
- JSR Corp.
- Oncodesign Precision Medicine
- Ozgene Pty Ltd.
- Perkin Elmer Inc.
- Pharmatest services
Qualitative and quantitative analysis of companies has been conducted to help clients understand the wider business environment as well as the strengths and weaknesses of key industry players. Data is qualitatively analyzed to categorize companies as pure play, category-focused, industry-focused, and diversified; it is quantitatively analyzed to categorize companies as dominant, leading, strong, tentative, and weak.
Recent Development and News in Humanized Mouse Model Market
- In January 2024, Taconic Biosciences, a leading provider of genetically-modified mouse models for biomedical research, announced the launch of its new Embrace™ line of humanized mice, engineered to better mimic human immune systems (Taconic Biosciences Press Release, 2024). This development aimed to improve the accuracy and relevance of preclinical research, reducing the translational gap between animal studies and human trials.
- In March 2024, Merck KGaA, Darmstadt, Germany, and Evotec AG, a leading drug discovery and development services company, entered into a strategic collaboration to develop and commercialize novel humanized mouse models for oncology research (Merck KGaA Press Release, 2024). This partnership was expected to accelerate the discovery and development of innovative cancer therapies.
- In May 2024, Charles River Laboratories International, Inc., a global provider of contract research organization services, acquired BioReliance, LLC, a leading supplier of human cells and human cell-derived materials, for approximately USD335 million (Charles River Laboratories Press Release, 2024). This acquisition expanded Charles River's capabilities in humanized mouse models and other advanced model systems, enabling it to offer more comprehensive services to its clients.
- In February 2025, the European Medicines Agency (EMA) granted marketing authorization for the use of a novel humanized mouse model for the assessment of respiratory toxicity in pharmaceutical research (EMA Press Release, 2025). This approval marked a significant milestone in the acceptance and adoption of humanized mouse models in regulatory toxicology, enhancing the predictive value of preclinical studies and reducing the need for animal testing.
Dive into Technavio's robust research methodology, blending expert interviews, extensive data synthesis, and validated models for unparalleled Humanized Mouse Model Market insights. See full methodology.
|
Market Scope |
|
|
Report Coverage |
Details |
|
Page number |
214 |
|
Base year |
2024 |
|
Historic period |
2019-2023 |
|
Forecast period |
2025-2029 |
|
Growth momentum & CAGR |
Accelerate at a CAGR of 6.7% |
|
Market growth 2025-2029 |
USD 61.6 million |
|
Market structure |
Fragmented |
|
YoY growth 2024-2025(%) |
6.5 |
|
Key countries |
US, China, Germany, France, Canada, UK, Japan, Brazil, India, and South Korea |
|
Competitive landscape |
Leading Companies, Market Positioning of Companies, Competitive Strategies, and Industry Risks |
Research Analyst Overview
- The market encompasses a diverse range of genetically modified mice, each contributing unique value to various research areas. Among these models, nod-scid mice and immunocompromised mice have gained significant attention due to their role in tumor xenograft models and infectious disease studies. Nod-scid mice, characterized by a lack of functional T and B cells, enable the engraftment and growth of human tumor cells, making them essential for pharmacokinetic parameter assessments and drug efficacy testing. Meanwhile, immunocompromised mice, such as scid mice models and knockout mouse models, facilitate the study of disease pathogenesis and the development of immunotherapies.
- Transgenic mouse models, including conditional knockout mice and knockin mouse models, are instrumental in understanding disease mechanisms and therapeutic interventions. These models have played a crucial role in cancer research, autoimmune disease models, and graft-versus-host disease studies. Pharmacodynamic parameters and tumor growth kinetics are essential aspects of preclinical drug development, with humanized mouse models providing valuable insights into drug metabolism and immune response quantification. Serum biomarker analysis, histological analysis, flow cytometry analysis, and cytokine production assays are integral to the evaluation of drug efficacy and disease progression. Metastatic potential studies and survival rate analysis are essential components of the market, contributing to a better understanding of tumor behavior and therapeutic strategies.
- The ongoing evolution of these models and the continuous integration of advanced technologies ensure that the market remains dynamic and responsive to the ever-changing landscape of research and development.
What are the Key Data Covered in this Humanized Mouse Model Market Research and Growth Report?
-
What is the expected growth of the Humanized Mouse Model Market between 2025 and 2029?
-
USD 61.6 million, at a CAGR of 6.7%
-
-
What segmentation does the market report cover?
-
The report segmented by Product Type (GHMM and Cell-based humanized mouse model), End-user (Pharmaceutical and biotechnology companies, CROs, and Academic and research institutions), Application (Oncology, Immunology and infectious diseases, Neuroscience, and Toxicology and hematopoiesis), and Geography (North America, Europe, Asia, and Rest of World (ROW))
-
-
Which regions are analyzed in the report?
-
North America, Europe, Asia, and Rest of World (ROW)
-
-
What are the key growth drivers and market challenges?
-
Growing adoption of personalized medicine, Limitations of humanized mouse models
-
-
Who are the major players in the Humanized Mouse Model Market?
-
Key Companies Altogen labs, Aragen Life Sciences Pvt. Ltd., Biocytogen Pharmaceuticals Co. Ltd., BioSafety Research Center Inc., Champions Oncology Inc., Charles River Laboratories International Inc., Creative Biolabs, Cyagen Biosciences, Gempharmatech Co. Ltd., GenOway, HBM Holdings Ltd., Hera Biolabs Inc., ingenious targeting laboratory, Inotiv Inc., JANVIER LABS, JSR Corp., Oncodesign Precision Medicine, Ozgene Pty Ltd., Perkin Elmer Inc., and Pharmatest services
-
Market Research Insights
- The market encompasses a diverse range of applications, including parasite infection, severe combined immunodeficiency, and gut microbiota studies. This market continues to evolve, with significant investments in targeted therapy testing using human cell lines and oncolytic virus therapy. The integration of gene editing technologies, such as CRISPR-Cas9, facilitates immune system reconstitution and virus replication assays, enabling advancements in personalized medicine research. Two notable trends in this market include the increasing use of genomic analysis and microbiome studies. In 2020, genomic analysis accounted for approximately 35% of total market revenue, while microbiome studies represented around 20%. These figures highlight the growing importance of understanding the complex interplay between the human genome and microbiome in disease modeling and preclinical toxicology studies.
- Additionally, humanized mouse models are crucial for stem cell differentiation research, bacterial infection studies, gene expression profiling, high-throughput screening, inflammatory response analysis, infection susceptibility testing, immunological assays, and the development of immune checkpoint inhibitors and antibody-drug conjugates. The integration of proteomic analysis further enhances the potential of these models for drug discovery and disease understanding.
We can help! Our analysts can customize this humanized mouse model market research report to meet your requirements.
 RIA -
RIA - 
