Hydraulic Equipment Market Analysis APAC, North America, Europe, Middle East and Africa, South America - US, China, Japan, Canada, India, South Korea, UK, Germany, Australia, France - Size and Forecast 2025-2029

Hydraulic Equipment Market Analysis APAC, North America, Europe, Middle East and Africa, South America - US, China, Japan, Canada, India, South Korea, UK, Germany, Australia, France - Size and Forecast 2025-2029

Published: Mar 2025 240 Pages SKU: IRTNTR40090

Market Overview at a Glance

$19.95 B
Market Opportunity
4.6%
CAGR
4.4
YoY growth 2024-2025(%)

Hydraulic Equipment Market Size 2025-2029

The hydraulic equipment market size is forecast to increase by USD 19.95 billion, at a CAGR of 4.6% between 2024 and 2029.

  • The market is driven by the ongoing industrial automation trend, which is leading to increased demand for efficient and reliable hydraulic systems. Technological advancements in the hydraulic equipment industry continue to shape the market, with innovations in areas such as energy efficiency, smart controls, and remote monitoring. However, the market faces challenges from the volatile prices of raw materials, particularly steel and oil, which can significantly impact the cost structure of hydraulic equipment manufacturers. Companies in the market must navigate these challenges by implementing cost management strategies and exploring alternative materials and manufacturing processes.
  • To capitalize on opportunities, they should focus on developing advanced hydraulic systems that cater to the evolving needs of industries such as manufacturing, construction, and mining. Additionally, collaborations and partnerships with technology providers and raw material suppliers can help mitigate the impact of raw material price fluctuations and enhance product offerings.

What will be the Size of the Hydraulic Equipment Market during the forecast period?

Hydraulic Equipment Market Size

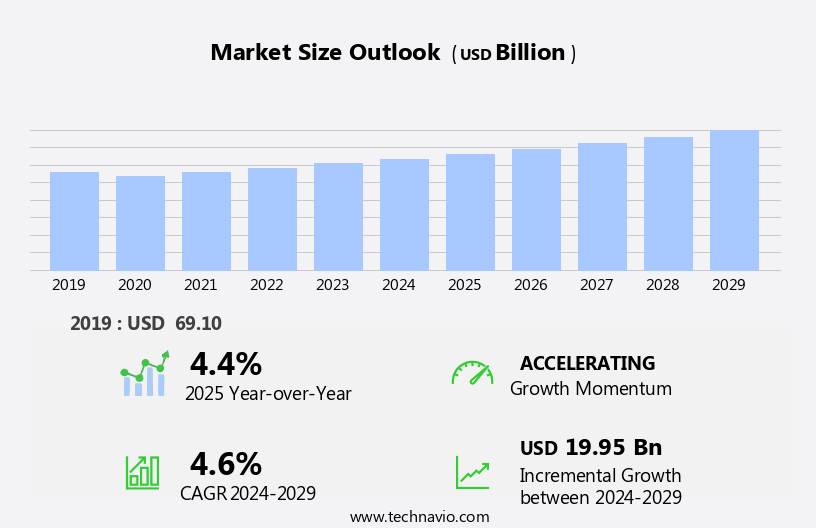
Explore in-depth regional segment analysis with market size data - historical 2019-2023 and forecasts 2025-2029 - in the full report.  
Request Free Sample

The market is characterized by its continuous evolution and dynamic nature, with various components and applications shaping its intricate landscape. Hydraulic circuit analysis plays a crucial role in optimizing system performance, while hydraulic fittings ensure reliable connections. Construction sites rely heavily on hydraulics for excavation and lifting tasks, and hydraulic actuation powers machinery in numerous sectors. Hydraulic hoses transmit fluid pressure, and automation integrates hydraulics with advanced control systems. Hydraulic system design and hydraulic control systems enable precise control and efficient operation. Electro-hydraulic systems merge electrical and hydraulic technologies, expanding application possibilities. Training programs cater to the workforce, ensuring safety standards are met.

Agricultural hydraulics power farm machinery, and hydraulic torque transmission is essential in various industries. Hydraulic manifolds distribute fluid pressure, and hydraulic motors convert hydraulic energy into mechanical motion. Research and innovation drive advancements, with applications ranging from aerospace to marine industries. Hydraulic components, power units, accumulators, and fluid play essential roles in these systems. Hydraulic certifications ensure safety and compliance, while high-pressure and low-pressure hydraulics cater to diverse requirements. Industrial hydraulics, proportional hydraulics, hydraulic efficiency, and mobile hydraulics are integral to numerous industries. Hydraulic assemblies, cylinders, and clamping systems complete the intricate web of hydraulic applications.

The hydraulic market remains a vibrant and ever-changing landscape, with ongoing developments and trends shaping its future.

How is this Hydraulic Equipment Industry segmented?

The hydraulic equipment industry research report provides comprehensive data (region-wise segment analysis), with forecasts and estimates in "USD billion" for the period 2025-2029, as well as historical data from 2019-2023 for the following segments.

  • Product
    • Pump and motor
    • Valve
    • Cylinder
    • Accumulator and filter
    • Others
  • Application
    • Mobile
    • Industrial
  • End-user
    • Construction
    • Mining
    • Agriculture
    • Packaging
    • Others
  • Geography
    • North America
      • US
      • Canada
    • Europe
      • France
      • Germany
      • UK
    • APAC
      • Australia
      • China
      • India
      • Japan
      • South Korea
    • Rest of World (ROW)

    By Product Insights

    The pump and motor segment is estimated to witness significant growth during the forecast period.

    The market encompasses various components and applications, including hydraulic testing, flow rate, actuators, lifting, safety standards, maintenance, repair, pressure, filtration, servo hydraulics, valves, braking, circuit analysis, fittings, construction hydraulics, actuation, hose, automation, system design, control systems, electro-hydraulic systems, training, agricultural hydraulics, torque, manifolds, steering, motors, research, aerospace hydraulics, simulation, components, power units, accumulators, fluid, thrust, electro-hydrostatic drives, marine hydraulics, certifications, high-pressure hydraulics, clamping, and low-pressure hydraulics. Hydraulic pumps and motors, as essential parts of this market, convert mechanical energy into hydraulic or hydrostatic energy. These components are indispensable in construction, agriculture, oil and gas, and material handling machinery.

    The escalating demand for such machinery significantly influences the demand for hydraulic pumps and motors, making it the largest segment in the market. Hydraulic pumps are classified into gear pumps, vane pumps, screw pumps, and piston pumps. The agricultural sector's adoption of advanced techniques like smart farming, intelligent pumps, and investments in these innovations propels the demand for pump and motor technology.

    Hydraulic Equipment Market Size

    Request Free Sample

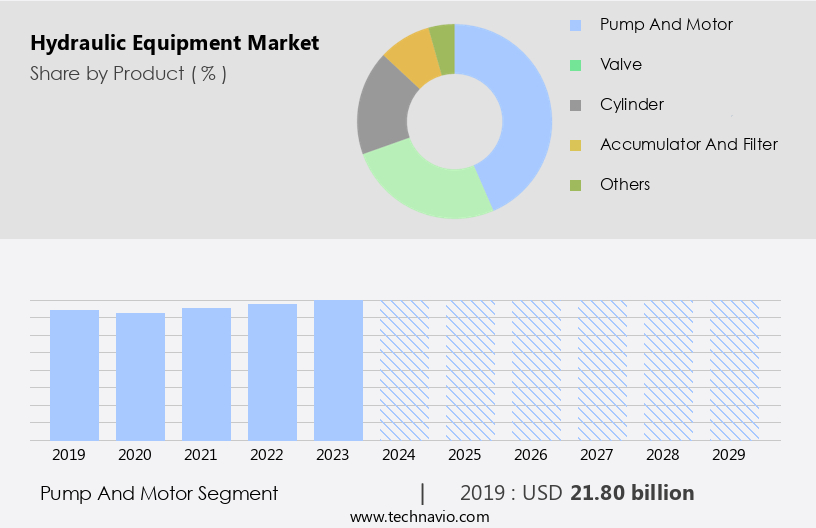
    The Pump and motor segment was valued at USD 21.80 billion in 2019 and showed a gradual increase during the forecast period.

    Regional Analysis

    APAC is estimated to contribute 40% to the growth of the global market during the forecast period.Technavio’s analysts have elaborately explained the regional trends and drivers that shape the market during the forecast period.

    Hydraulic Equipment Market Share by Geography

     Request Free Sample

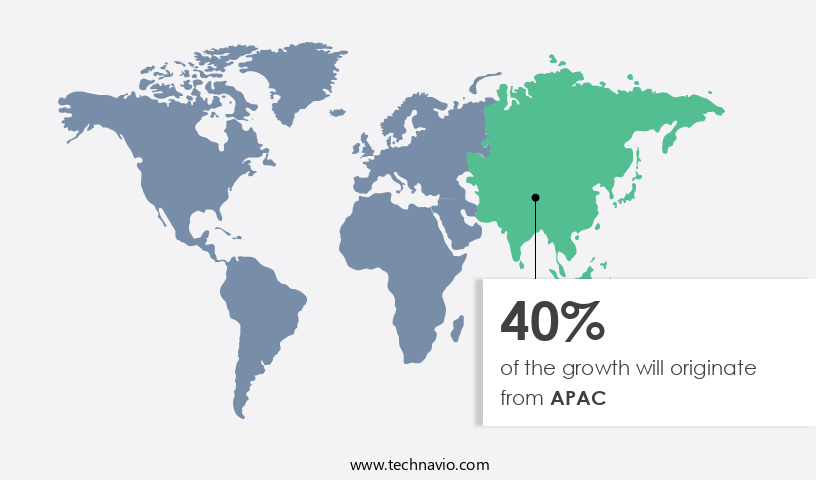
    The market experiences steady growth due to the increasing industrialization and production of automobiles and industrial machinery. In the Asia Pacific region, expanding end-use industries, competitive manufacturing costs, and high economic growth fuel market growth in sectors like automotive, aerospace, marine, food and beverage, and construction. This trend encourages global market players to expand their businesses in APAC. The shipping industry's growth in China and South Korea is driving the demand for efficient and corrosion-resistant industrial machinery, further boosting the market. Hydraulic testing, flow rate, actuators, lifting, safety standards, maintenance, repair, pressure, filtration, servo systems, valves, braking, circuit analysis, fittings, actuation, hose, automation, system design, control systems, electro-hydraulic systems, training, agricultural applications, torque, manifolds, steering, motors, research, aerospace, simulation, components, power units, accumulators, fluid, thrust, electro-hydrostatic drives, marine applications, certifications, high-pressure, clamping, and low-pressure hydraulics are all integral parts of this dynamic market.

    Industrial hydraulics, proportional systems, efficiency, mobile applications, assemblies, cylinders, innovations, and pumps are essential components that contribute to the market's evolution. The market's continuous development is driven by the increasing demand for advanced hydraulic systems in various industries, leading to the introduction of new technologies and improvements in existing ones.

    Market Dynamics

    Our researchers analyzed the data with 2024 as the base year, along with the key drivers, trends, and challenges. A holistic analysis of drivers will help companies refine their marketing strategies to gain a competitive advantage.

    What are the key market drivers leading to the rise in the adoption of Hydraulic Equipment Industry?

    • The emergence of industrial automation serves as the primary catalyst for market growth. 

    • Hydraulic equipment plays a pivotal role in industrial automation by providing precise and powerful motion control. The automation revolution relies on control systems, robots, and information technologies to streamline manufacturing processes and increase throughput rates. Hydraulic systems offer advantages such as high power density, precise control, and robustness, making them indispensable for various automation applications. The trend towards smart factories and Industry 4.0 initiatives further fuels the demand for hydraulic equipment. Hydraulic testing ensures the optimal performance of hydraulic systems by measuring hydraulic flow rate, pressure, and temperature. Hydraulic safety standards are crucial to prevent accidents and ensure the safety of operators and equipment.
    • Hydraulic maintenance and repair are essential to prolong the life of hydraulic components and minimize downtime. Servo hydraulics offer precise control and are widely used in applications requiring high accuracy and repeatability. Hydraulic valves regulate the flow of hydraulic fluid and are essential components of hydraulic systems. Hydraulic lifting applications include cranes, hoists, and elevators, which rely on hydraulic pressure to lift heavy loads. Hydraulic filtration is essential to maintain hydraulic fluid cleanliness and prevent contamination. Hydraulic braking systems are used in heavy machinery and vehicles to provide reliable and efficient braking performance. In conclusion, the demand for hydraulic equipment continues to grow due to the increasing adoption of industrial automation and the trend towards smart factories and Industry 4.0 initiatives.
    • Hydraulic testing, maintenance, and repair are essential to ensure the optimal performance and longevity of hydraulic systems. Hydraulic components such as servo hydraulics, hydraulic valves, and hydraulic filtration systems play a crucial role in various automation applications.

    What are the market trends shaping the Hydraulic Equipment Industry?

    • The hydraulic equipment industry is currently witnessing significant technological advancements, which is becoming a notable market trend. These innovations are shaping the future of hydraulic systems, enhancing efficiency, productivity, and performance.

    • The market is experiencing significant advancements due to the integration of electronics and hydraulics, resulting in the development of electro-hydraulic systems. These systems offer precise control, energy efficiency, and advanced features like proportional control, load sensing, and feedback mechanisms. The IoT and smart technologies are revolutionizing the industry by enabling remote monitoring, predictive maintenance, and performance optimization through IoT-connected hydraulic components and systems. Innovations in materials science and manufacturing techniques have led to the creation of lightweight, durable, and high-performance hydraulic components, such as hydraulic hoses, fittings, manifolds, and actuators.
    • Hydraulic system design has become more complex with the integration of hydraulic automation and control systems. Key applications include construction hydraulics, agricultural hydraulics, and industrial hydraulics. Hydraulic circuit analysis and training programs are essential for professionals to ensure optimal system performance and safety.

    What challenges does the Hydraulic Equipment Industry face during its growth?

    • The volatility in raw material prices poses a significant challenge to the industry's growth trajectory. 

    • The market encompasses various components and systems, including hydraulic steering, motors, power units, accumulators, and electro-hydrostatic drives. Hydraulic research and development are crucial in enhancing the efficiency and performance of these systems. In the aerospace industry, hydraulics are essential for controlling flight surfaces and actuating landing gear. Manufacturers of hydraulic equipment face challenges related to raw material prices. Raw materials such as steel, aluminum, plastics, and polymers significantly influence the production costs and overall performance of hydraulic systems. Fluctuations in raw material prices can negatively impact the growth of the market. Moreover, trade policies, tariffs, and import/export restrictions can further complicate the situation by increasing production costs and limiting supply.
    • For instance, tariffs on imported steel or aluminum can lead to price hikes in domestic markets, affecting manufacturers' profitability and financial stability. In the marine sector, hydraulics are indispensable for propulsion, steering, and deck machinery. Marine hydraulics face unique challenges due to the harsh operating conditions, including corrosion, saltwater exposure, and extreme temperatures. Hydraulic certifications ensure the safety and reliability of these systems in marine applications. Hydraulic simulation software is another essential tool for manufacturers, enabling the design and testing of hydraulic systems in a virtual environment. This technology can help optimize system performance, reduce development costs, and improve overall efficiency.
    • In conclusion, the market is dynamic and complex, influenced by various factors such as raw material prices, trade policies, and technological advancements. Manufacturers must navigate these challenges to maintain profitability and remain competitive in the global market.

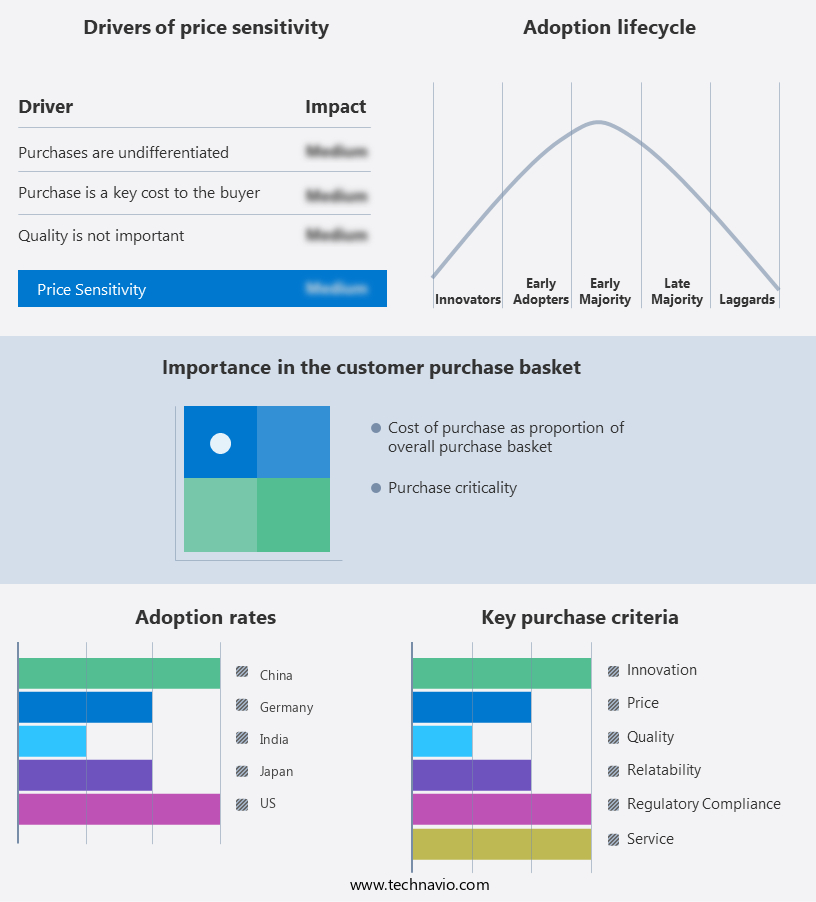
    Exclusive Customer Landscape

    The hydraulic equipment market forecasting report includes the adoption lifecycle of the market, covering from the innovator’s stage to the laggard’s stage. It focuses on adoption rates in different regions based on penetration. Furthermore, the hydraulic equipment market report also includes key purchase criteria and drivers of price sensitivity to help companies evaluate and develop their market growth analysis strategies.

    Hydraulic Equipment Market Share by Geography

     Customer Landscape

    Key Companies & Market Insights

    Companies are implementing various strategies, such as strategic alliances, hydraulic equipment market forecast, partnerships, mergers and acquisitions, geographical expansion, and product/service launches, to enhance their presence in the industry.

    2G Engineering - The company specializes in providing advanced hydraulic equipment solutions for subsea applications. One such offering is the Subsea Hydraulic Pressure Unit, an electrically driven, standalone hydraulic pump system. This unit generates fluid power subsea, featuring robust piston pumps capable of producing pressures up to 5000 PSI above ambient levels and flows up to 0.5 GPM. The pumps' design ensures optimal performance in challenging subsea environments, contributing to increased efficiency and reliability for clients in various industries.

    The industry research and growth report includes detailed analyses of the competitive landscape of the market and information about key companies, including:

    • 2G Engineering
    • Caterpillar Inc.
    • Daikin Industries Ltd.
    • Dana Inc.
    • Dyna Flex Inc
    • Eaton Corp. plc
    • Emerson Electric Co.
    • Enerpac Tool Group Corp.
    • Flowserve Corp.
    • HANNON HYDRUALICS LLC
    • HYDAC International GmbH
    • Kawasaki Heavy Industries Ltd.
    • Komatsu Ltd.
    • Parker Hannifin Corp.
    • Robert Bosch GmbH
    • Siemens AG
    • SMC Corp.
    • Texas Hydraulics Inc.
    • WEBER HYDRAULIK GmbH
    • Wipro Ltd.

    Qualitative and quantitative analysis of companies has been conducted to help clients understand the wider business environment as well as the strengths and weaknesses of key industry players. Data is qualitatively analyzed to categorize companies as pure play, category-focused, industry-focused, and diversified; it is quantitatively analyzed to categorize companies as dominant, leading, strong, tentative, and weak.

    Recent Development and News in Hydraulic Equipment Market

    • In March 2024, Eaton Corporation, a leading power management company, introduced its new eMobility Hydraulics product line, designed to support the growing electric and hybrid vehicle market (Eaton Corporation press release). This innovative solution aims to replace traditional hydraulic systems with electric and hybrid alternatives, reducing fuel consumption and emissions.
    • In July 2024, Bosch Rexroth, a leading hydraulics technology provider, announced a strategic partnership with Siemens Energy to jointly develop and market hydraulic systems for the renewable energy sector (Bosch Rexroth press release). This collaboration will combine Bosch Rexroth's hydraulic expertise with Siemens Energy's renewable energy solutions, targeting the wind and solar energy markets.
    • In November 2024, Parker Hannifin, a global leader in motion and control technologies, completed the acquisition of Mannesmann Demag, a German manufacturer of hydraulic components and systems (Parker Hannifin press release). This acquisition will expand Parker Hannifin's hydraulic product portfolio, strengthening its position in the European market and enhancing its capabilities in the industrial and mobile hydraulics sectors.
    • In February 2025, Danfoss, a leading manufacturer of hydraulic components and systems, received approval for its new hydraulic system design for offshore wind turbines from the German Federal Maritime and Hydrographic Agency (Danfoss press release). This approval marks a significant milestone in the development of more efficient and cost-effective hydraulic systems for offshore wind energy applications.

    Research Analyst Overview

    • The market encompasses various components and systems, including hydraulic contamination, durability, and regulations. Hydraulic seals, for instance, play a crucial role in maintaining system integrity, while hydraulic system modeling and performance analysis help optimize efficiency and identify potential issues. Hydraulic corrosion and wear, however, pose significant challenges to hydraulic durability, necessitating ongoing maintenance and cost analysis. Hydraulic regulations continue to evolve, driving the need for hydraulic compliance and sustainability. Electro-mechanical systems and pneumatic systems offer alternatives to hydraulics, but their integration with hydraulic components in motion control applications necessitates a deep understanding of power transmission and fluid power principles.
    • Hydraulic troubleshooting and diagnostics are essential for addressing hydraulic fatigue and reliability concerns. Hydraulic cost analysis, optimization, and lubrication are key factors in maximizing hydraulic ROI. Linear and rotary actuators, essential components of hydraulic systems, require ongoing maintenance and performance analysis to ensure hydraulic life cycle efficiency. Fluid power applications demand continuous improvement in hydraulic efficiency, bearing performance, and compliance with regulations. Hydraulic bearings, a critical component, undergo significant wear and require regular maintenance to ensure hydraulic system reliability. In summary, the market is characterized by a focus on improving hydraulic performance, optimizing costs, and ensuring compliance with regulations.
    • Hydraulic system modeling, troubleshooting, and diagnostics are essential for addressing hydraulic challenges and maintaining system reliability. Hydraulic wear, fatigue, and corrosion necessitate ongoing maintenance and cost analysis to maximize hydraulic ROI.

    Dive into Technavio’s robust research methodology, blending expert interviews, extensive data synthesis, and validated models for unparalleled Hydraulic Equipment Market insights. See full methodology.

    Market Scope

    Report Coverage

    Details

    Page number

    240

    Base year

    2024

    Historic period

    2019-2023

    Forecast period

    2025-2029

    Growth momentum & CAGR

    Accelerate at a CAGR of 4.6%

    Market growth 2025-2029

    USD 19.95 billion

    Market structure

    Fragmented

    YoY growth 2024-2025(%)

    4.4

    Key countries

    US, China, Japan, Canada, India, South Korea, UK, Germany, Australia, and France

    Competitive landscape

    Leading Companies, Market Positioning of Companies, Competitive Strategies, and Industry Risks

    Request Free Sample

    What are the Key Data Covered in this Hydraulic Equipment Market Research and Growth Report?

    • CAGR of the Hydraulic Equipment industry during the forecast period
    • Detailed information on factors that will drive the growth and forecasting between 2025 and 2029
    • Precise estimation of the size of the market and its contribution of the industry in focus to the parent market
    • Accurate predictions about upcoming growth and trends and changes in consumer behaviour
    • Growth of the market across APAC, North America, Europe, Middle East and Africa, and South America
    • Thorough analysis of the market’s competitive landscape and detailed information about companies
    • Comprehensive analysis of factors that will challenge the hydraulic equipment market growth of industry companies

    We can help! Our analysts can customize this hydraulic equipment market research report to meet your requirements.

    Get in touch


    1 Executive Summary

    • 1.1 Market overview
      • Executive Summary - Chart on Market Overview
      • Executive Summary - Data Table on Market Overview
      • Executive Summary - Chart on Global Market Characteristics
      • Executive Summary - Chart on Market by Geography
      • Executive Summary - Chart on Market Segmentation by Product
      • Executive Summary - Chart on Market Segmentation by Application
      • Executive Summary - Chart on Market Segmentation by End-user
      • Executive Summary - Chart on Incremental Growth
      • Executive Summary - Data Table on Incremental Growth
      • Executive Summary - Chart on Company Market Positioning

    2 Technavio Analysis

    • 2.1 Analysis of price sensitivity, lifecycle, customer purchase basket, adoption rates, and purchase criteria
      • Analysis of price sensitivity, lifecycle, customer purchase basket, adoption rates, and purchase criteria
    • 2.2 Criticality of inputs and Factors of differentiation
      • Overview on criticality of inputs and factors of differentiation
    • 2.3 Factors of disruption
      • Overview on factors of disruption
    • 2.4 Impact of drivers and challenges
      • Impact of drivers and challenges in 2024 and 2029

    3 Market Landscape

    • 3.1 Market ecosystem
      • Parent Market
      • Data Table on - Parent Market
    • 3.2 Market characteristics
      • Market characteristics analysis
    • 3.3 Value chain analysis
      • Value chain analysis

    4 Market Sizing

    • 4.1 Market definition
      • Offerings of companies included in the market definition
    • 4.2 Market segment analysis
      • Market segments
    • 4.3 Market size 2024
      • 4.4 Market outlook: Forecast for 2024-2029
        • Chart on Global - Market size and forecast 2024-2029 ($ billion)
        • Data Table on Global - Market size and forecast 2024-2029 ($ billion)
        • Chart on Global Market: Year-over-year growth 2024-2029 (%)
        • Data Table on Global Market: Year-over-year growth 2024-2029 (%)

      5 Historic Market Size

      • 5.1 Global Hydraulic Equipment Market 2019 - 2023
        • Historic Market Size - Data Table on Global Hydraulic Equipment Market 2019 - 2023 ($ billion)
      • 5.2 Product segment analysis 2019 - 2023
        • Historic Market Size - Product Segment 2019 - 2023 ($ billion)
      • 5.3 Application segment analysis 2019 - 2023
        • Historic Market Size - Application Segment 2019 - 2023 ($ billion)
      • 5.4 End-user segment analysis 2019 - 2023
        • Historic Market Size - End-user Segment 2019 - 2023 ($ billion)
      • 5.5 Geography segment analysis 2019 - 2023
        • Historic Market Size - Geography Segment 2019 - 2023 ($ billion)
      • 5.6 Country segment analysis 2019 - 2023
        • Historic Market Size - Country Segment 2019 - 2023 ($ billion)

      6 Qualitative Analysis

      • 6.1 AI Impact on Global Hydraulic Equipment Market

        7 Five Forces Analysis

        • 7.1 Five forces summary
          • Five forces analysis - Comparison between 2024 and 2029
        • 7.2 Bargaining power of buyers
          • Bargaining power of buyers - Impact of key factors 2024 and 2029
        • 7.3 Bargaining power of suppliers
          • Bargaining power of suppliers - Impact of key factors in 2024 and 2029
        • 7.4 Threat of new entrants
          • Threat of new entrants - Impact of key factors in 2024 and 2029
        • 7.5 Threat of substitutes
          • Threat of substitutes - Impact of key factors in 2024 and 2029
        • 7.6 Threat of rivalry
          • Threat of rivalry - Impact of key factors in 2024 and 2029
        • 7.7 Market condition
          • Chart on Market condition - Five forces 2024 and 2029

        8 Market Segmentation by Product

        • 8.1 Market segments
          • Chart on Product - Market share 2024-2029 (%)
          • Data Table on Product - Market share 2024-2029 (%)
        • 8.2 Comparison by Product
          • Chart on Comparison by Product
          • Data Table on Comparison by Product
        • 8.3 Pump and motor - Market size and forecast 2024-2029
          • Chart on Pump and motor - Market size and forecast 2024-2029 ($ billion)
          • Data Table on Pump and motor - Market size and forecast 2024-2029 ($ billion)
          • Chart on Pump and motor - Year-over-year growth 2024-2029 (%)
          • Data Table on Pump and motor - Year-over-year growth 2024-2029 (%)
        • 8.4 Valve - Market size and forecast 2024-2029
          • Chart on Valve - Market size and forecast 2024-2029 ($ billion)
          • Data Table on Valve - Market size and forecast 2024-2029 ($ billion)
          • Chart on Valve - Year-over-year growth 2024-2029 (%)
          • Data Table on Valve - Year-over-year growth 2024-2029 (%)
        • 8.5 Cylinder - Market size and forecast 2024-2029
          • Chart on Cylinder - Market size and forecast 2024-2029 ($ billion)
          • Data Table on Cylinder - Market size and forecast 2024-2029 ($ billion)
          • Chart on Cylinder - Year-over-year growth 2024-2029 (%)
          • Data Table on Cylinder - Year-over-year growth 2024-2029 (%)
        • 8.6 Accumulator and filter - Market size and forecast 2024-2029
          • Chart on Accumulator and filter - Market size and forecast 2024-2029 ($ billion)
          • Data Table on Accumulator and filter - Market size and forecast 2024-2029 ($ billion)
          • Chart on Accumulator and filter - Year-over-year growth 2024-2029 (%)
          • Data Table on Accumulator and filter - Year-over-year growth 2024-2029 (%)
        • 8.7 Others - Market size and forecast 2024-2029
          • Chart on Others - Market size and forecast 2024-2029 ($ billion)
          • Data Table on Others - Market size and forecast 2024-2029 ($ billion)
          • Chart on Others - Year-over-year growth 2024-2029 (%)
          • Data Table on Others - Year-over-year growth 2024-2029 (%)
        • 8.8 Market opportunity by Product
          • Market opportunity by Product ($ billion)
          • Data Table on Market opportunity by Product ($ billion)

        9 Market Segmentation by Application

        • 9.1 Market segments
          • Chart on Application - Market share 2024-2029 (%)
          • Data Table on Application - Market share 2024-2029 (%)
        • 9.2 Comparison by Application
          • Chart on Comparison by Application
          • Data Table on Comparison by Application
        • 9.3 Mobile - Market size and forecast 2024-2029
          • Chart on Mobile - Market size and forecast 2024-2029 ($ billion)
          • Data Table on Mobile - Market size and forecast 2024-2029 ($ billion)
          • Chart on Mobile - Year-over-year growth 2024-2029 (%)
          • Data Table on Mobile - Year-over-year growth 2024-2029 (%)
        • 9.4 Industrial - Market size and forecast 2024-2029
          • Chart on Industrial - Market size and forecast 2024-2029 ($ billion)
          • Data Table on Industrial - Market size and forecast 2024-2029 ($ billion)
          • Chart on Industrial - Year-over-year growth 2024-2029 (%)
          • Data Table on Industrial - Year-over-year growth 2024-2029 (%)
        • 9.5 Market opportunity by Application
          • Market opportunity by Application ($ billion)
          • Data Table on Market opportunity by Application ($ billion)

        10 Market Segmentation by End-user

        • 10.1 Market segments
          • Chart on End-user - Market share 2024-2029 (%)
          • Data Table on End-user - Market share 2024-2029 (%)
        • 10.2 Comparison by End-user
          • Chart on Comparison by End-user
          • Data Table on Comparison by End-user
        • 10.3 Construction - Market size and forecast 2024-2029
          • Chart on Construction - Market size and forecast 2024-2029 ($ billion)
          • Data Table on Construction - Market size and forecast 2024-2029 ($ billion)
          • Chart on Construction - Year-over-year growth 2024-2029 (%)
          • Data Table on Construction - Year-over-year growth 2024-2029 (%)
        • 10.4 Mining - Market size and forecast 2024-2029
          • Chart on Mining - Market size and forecast 2024-2029 ($ billion)
          • Data Table on Mining - Market size and forecast 2024-2029 ($ billion)
          • Chart on Mining - Year-over-year growth 2024-2029 (%)
          • Data Table on Mining - Year-over-year growth 2024-2029 (%)
        • 10.5 Agriculture - Market size and forecast 2024-2029
          • Chart on Agriculture - Market size and forecast 2024-2029 ($ billion)
          • Data Table on Agriculture - Market size and forecast 2024-2029 ($ billion)
          • Chart on Agriculture - Year-over-year growth 2024-2029 (%)
          • Data Table on Agriculture - Year-over-year growth 2024-2029 (%)
        • 10.6 Packaging - Market size and forecast 2024-2029
          • Chart on Packaging - Market size and forecast 2024-2029 ($ billion)
          • Data Table on Packaging - Market size and forecast 2024-2029 ($ billion)
          • Chart on Packaging - Year-over-year growth 2024-2029 (%)
          • Data Table on Packaging - Year-over-year growth 2024-2029 (%)
        • 10.7 Others - Market size and forecast 2024-2029
          • Chart on Others - Market size and forecast 2024-2029 ($ billion)
          • Data Table on Others - Market size and forecast 2024-2029 ($ billion)
          • Chart on Others - Year-over-year growth 2024-2029 (%)
          • Data Table on Others - Year-over-year growth 2024-2029 (%)
        • 10.8 Market opportunity by End-user
          • Market opportunity by End-user ($ billion)
          • Data Table on Market opportunity by End-user ($ billion)

        11 Customer Landscape

        • 11.1 Customer landscape overview
          • Analysis of price sensitivity, lifecycle, customer purchase basket, adoption rates, and purchase criteria

        12 Geographic Landscape

        • 12.1 Geographic segmentation
          • Chart on Market share by geography 2024-2029 (%)
          • Data Table on Market share by geography 2024-2029 (%)
        • 12.2 Geographic comparison
          • Chart on Geographic comparison
          • Data Table on Geographic comparison
        • 12.3 APAC - Market size and forecast 2024-2029
          • Chart on APAC - Market size and forecast 2024-2029 ($ billion)
          • Data Table on APAC - Market size and forecast 2024-2029 ($ billion)
          • Chart on APAC - Year-over-year growth 2024-2029 (%)
          • Data Table on APAC - Year-over-year growth 2024-2029 (%)
        • 12.4 North America - Market size and forecast 2024-2029
          • Chart on North America - Market size and forecast 2024-2029 ($ billion)
          • Data Table on North America - Market size and forecast 2024-2029 ($ billion)
          • Chart on North America - Year-over-year growth 2024-2029 (%)
          • Data Table on North America - Year-over-year growth 2024-2029 (%)
        • 12.5 Europe - Market size and forecast 2024-2029
          • Chart on Europe - Market size and forecast 2024-2029 ($ billion)
          • Data Table on Europe - Market size and forecast 2024-2029 ($ billion)
          • Chart on Europe - Year-over-year growth 2024-2029 (%)
          • Data Table on Europe - Year-over-year growth 2024-2029 (%)
        • 12.6 Middle East and Africa - Market size and forecast 2024-2029
          • Chart on Middle East and Africa - Market size and forecast 2024-2029 ($ billion)
          • Data Table on Middle East and Africa - Market size and forecast 2024-2029 ($ billion)
          • Chart on Middle East and Africa - Year-over-year growth 2024-2029 (%)
          • Data Table on Middle East and Africa - Year-over-year growth 2024-2029 (%)
        • 12.7 South America - Market size and forecast 2024-2029
          • Chart on South America - Market size and forecast 2024-2029 ($ billion)
          • Data Table on South America - Market size and forecast 2024-2029 ($ billion)
          • Chart on South America - Year-over-year growth 2024-2029 (%)
          • Data Table on South America - Year-over-year growth 2024-2029 (%)
        • 12.8 US - Market size and forecast 2024-2029
          • Chart on US - Market size and forecast 2024-2029 ($ billion)
          • Data Table on US - Market size and forecast 2024-2029 ($ billion)
          • Chart on US - Year-over-year growth 2024-2029 (%)
          • Data Table on US - Year-over-year growth 2024-2029 (%)
        • 12.9 China - Market size and forecast 2024-2029
          • Chart on China - Market size and forecast 2024-2029 ($ billion)
          • Data Table on China - Market size and forecast 2024-2029 ($ billion)
          • Chart on China - Year-over-year growth 2024-2029 (%)
          • Data Table on China - Year-over-year growth 2024-2029 (%)
        • 12.10 Japan - Market size and forecast 2024-2029
          • Chart on Japan - Market size and forecast 2024-2029 ($ billion)
          • Data Table on Japan - Market size and forecast 2024-2029 ($ billion)
          • Chart on Japan - Year-over-year growth 2024-2029 (%)
          • Data Table on Japan - Year-over-year growth 2024-2029 (%)
        • 12.11 Canada - Market size and forecast 2024-2029
          • Chart on Canada - Market size and forecast 2024-2029 ($ billion)
          • Data Table on Canada - Market size and forecast 2024-2029 ($ billion)
          • Chart on Canada - Year-over-year growth 2024-2029 (%)
          • Data Table on Canada - Year-over-year growth 2024-2029 (%)
        • 12.12 India - Market size and forecast 2024-2029
          • Chart on India - Market size and forecast 2024-2029 ($ billion)
          • Data Table on India - Market size and forecast 2024-2029 ($ billion)
          • Chart on India - Year-over-year growth 2024-2029 (%)
          • Data Table on India - Year-over-year growth 2024-2029 (%)
        • 12.13 South Korea - Market size and forecast 2024-2029
          • Chart on South Korea - Market size and forecast 2024-2029 ($ billion)
          • Data Table on South Korea - Market size and forecast 2024-2029 ($ billion)
          • Chart on South Korea - Year-over-year growth 2024-2029 (%)
          • Data Table on South Korea - Year-over-year growth 2024-2029 (%)
        • 12.14 UK - Market size and forecast 2024-2029
          • Chart on UK - Market size and forecast 2024-2029 ($ billion)
          • Data Table on UK - Market size and forecast 2024-2029 ($ billion)
          • Chart on UK - Year-over-year growth 2024-2029 (%)
          • Data Table on UK - Year-over-year growth 2024-2029 (%)
        • 12.15 Germany - Market size and forecast 2024-2029
          • Chart on Germany - Market size and forecast 2024-2029 ($ billion)
          • Data Table on Germany - Market size and forecast 2024-2029 ($ billion)
          • Chart on Germany - Year-over-year growth 2024-2029 (%)
          • Data Table on Germany - Year-over-year growth 2024-2029 (%)
        • 12.16 Australia - Market size and forecast 2024-2029
          • Chart on Australia - Market size and forecast 2024-2029 ($ billion)
          • Data Table on Australia - Market size and forecast 2024-2029 ($ billion)
          • Chart on Australia - Year-over-year growth 2024-2029 (%)
          • Data Table on Australia - Year-over-year growth 2024-2029 (%)
        • 12.17 France - Market size and forecast 2024-2029
          • Chart on France - Market size and forecast 2024-2029 ($ billion)
          • Data Table on France - Market size and forecast 2024-2029 ($ billion)
          • Chart on France - Year-over-year growth 2024-2029 (%)
          • Data Table on France - Year-over-year growth 2024-2029 (%)
        • 12.18 Market opportunity by geography
          • Market opportunity by geography ($ billion)
          • Data Tables on Market opportunity by geography ($ billion)

        13 Drivers, Challenges, and Opportunity/Restraints

        • 13.1 Market drivers
          • 13.2 Market challenges
            • 13.3 Impact of drivers and challenges
              • Impact of drivers and challenges in 2024 and 2029
            • 13.4 Market opportunities/restraints

              14 Competitive Landscape

              • 14.1 Overview
                • 14.2 Competitive Landscape
                  • Overview on criticality of inputs and factors of differentiation
                • 14.3 Landscape disruption
                  • Overview on factors of disruption
                • 14.4 Industry risks
                  • Impact of key risks on business

                15 Competitive Analysis

                • 15.1 Companies profiled
                  • Companies covered
                • 15.2 Company ranking index
                  • Company ranking index
                • 15.3 Market positioning of companies
                  • Matrix on companies position and classification
                • 2G Engineering
                  • 2G Engineering - Overview
                  • 2G Engineering - Product / Service
                  • 2G Engineering - Key offerings
                  • SWOT
                • 15.5 Caterpillar Inc.
                  • Caterpillar Inc. - Overview
                  • Caterpillar Inc. - Business segments
                  • Caterpillar Inc. - Key news
                  • Caterpillar Inc. - Key offerings
                  • Caterpillar Inc. - Segment focus
                  • SWOT
                • 15.6 Daikin Industries Ltd.
                  • Daikin Industries Ltd. - Overview
                  • Daikin Industries Ltd. - Business segments
                  • Daikin Industries Ltd. - Key news
                  • Daikin Industries Ltd. - Key offerings
                  • Daikin Industries Ltd. - Segment focus
                  • SWOT
                • 15.7 Dana Inc.
                  • Dana Inc. - Overview
                  • Dana Inc. - Business segments
                  • Dana Inc. - Key news
                  • Dana Inc. - Key offerings
                  • Dana Inc. - Segment focus
                  • SWOT
                • 15.8 Dyna Flex Inc
                  • Dyna Flex Inc - Overview
                  • Dyna Flex Inc - Product / Service
                  • Dyna Flex Inc - Key offerings
                  • SWOT
                • 15.9 Eaton Corp. plc
                  • Eaton Corp. plc - Overview
                  • Eaton Corp. plc - Business segments
                  • Eaton Corp. plc - Key news
                  • Eaton Corp. plc - Key offerings
                  • Eaton Corp. plc - Segment focus
                  • SWOT
                • 15.10 Emerson Electric Co.
                  • Emerson Electric Co. - Overview
                  • Emerson Electric Co. - Business segments
                  • Emerson Electric Co. - Key news
                  • Emerson Electric Co. - Key offerings
                  • Emerson Electric Co. - Segment focus
                  • SWOT
                • 15.11 Enerpac Tool Group Corp.
                  • Enerpac Tool Group Corp. - Overview
                  • Enerpac Tool Group Corp. - Product / Service
                  • Enerpac Tool Group Corp. - Key offerings
                  • SWOT
                • 15.12 Kawasaki Heavy Industries Ltd.
                  • Kawasaki Heavy Industries Ltd. - Overview
                  • Kawasaki Heavy Industries Ltd. - Business segments
                  • Kawasaki Heavy Industries Ltd. - Key offerings
                  • Kawasaki Heavy Industries Ltd. - Segment focus
                  • SWOT
                • 15.13 Komatsu Ltd.
                  • Komatsu Ltd. - Overview
                  • Komatsu Ltd. - Business segments
                  • Komatsu Ltd. - Key news
                  • Komatsu Ltd. - Key offerings
                  • Komatsu Ltd. - Segment focus
                  • SWOT
                • 15.14 Parker Hannifin Corp.
                  • Parker Hannifin Corp. - Overview
                  • Parker Hannifin Corp. - Business segments
                  • Parker Hannifin Corp. - Key news
                  • Parker Hannifin Corp. - Key offerings
                  • Parker Hannifin Corp. - Segment focus
                  • SWOT
                • 15.15 Robert Bosch GmbH
                  • Robert Bosch GmbH - Overview
                  • Robert Bosch GmbH - Product / Service
                  • Robert Bosch GmbH - Key news
                  • Robert Bosch GmbH - Key offerings
                  • SWOT
                • 15.16 Siemens AG
                  • Siemens AG - Overview
                  • Siemens AG - Business segments
                  • Siemens AG - Key news
                  • Siemens AG - Key offerings
                  • Siemens AG - Segment focus
                  • SWOT
                • 15.17 WEBER HYDRAULIK GmbH
                  • WEBER HYDRAULIK GmbH - Overview
                  • WEBER HYDRAULIK GmbH - Product / Service
                  • WEBER HYDRAULIK GmbH - Key offerings
                  • SWOT
                • 15.18 Wipro Ltd.
                  • Wipro Ltd. - Overview
                  • Wipro Ltd. - Business segments
                  • Wipro Ltd. - Key news
                  • Wipro Ltd. - Key offerings
                  • Wipro Ltd. - Segment focus
                  • SWOT

                16 Appendix

                • 16.1 Scope of the report
                  • 16.2 Inclusions and exclusions checklist
                    • Inclusions checklist
                    • Exclusions checklist
                  • 16.3 Currency conversion rates for US$
                    • Currency conversion rates for US$
                  • 16.4 Research methodology
                    • Research methodology
                  • 16.5 Data procurement
                    • Information sources
                  • 16.6 Data validation
                    • Data validation
                  • 16.7 Validation techniques employed for market sizing
                    • Validation techniques employed for market sizing
                  • 16.8 Data synthesis
                    • Data synthesis
                  • 16.9 360 degree market analysis
                    • 360 degree market analysis
                  • 16.10 List of abbreviations
                    • List of abbreviations

                  Research Methodology

                  Technavio presents a detailed picture of the market by way of study, synthesis, and summation of data from multiple sources. The analysts have presented the various facets of the market with a particular focus on identifying the key industry influencers. The data thus presented is comprehensive, reliable, and the result of extensive research, both primary and secondary.

                  INFORMATION SOURCES

                  Primary sources

                  • Manufacturers and suppliers
                  • Channel partners
                  • Industry experts
                  • Strategic decision makers

                  Secondary sources

                  • Industry journals and periodicals
                  • Government data
                  • Financial reports of key industry players
                  • Historical data
                  • Press releases

                  DATA ANALYSIS

                  Data Synthesis

                  • Collation of data
                  • Estimation of key figures
                  • Analysis of derived insights

                  Data Validation

                  • Triangulation with data models
                  • Reference against proprietary databases
                  • Corroboration with industry experts

                  REPORT WRITING

                  Qualitative

                  • Market drivers
                  • Market challenges
                  • Market trends
                  • Five forces analysis

                  Quantitative

                  • Market size and forecast
                  • Market segmentation
                  • Geographical insights
                  • Competitive landscape

                  Interested in this report?

                  Get your sample now to see our research methodology and insights!

                  Download Now

                  Frequently Asked Questions

                  Hydraulic Equipment market growth will increase by $ 19.95 bn during 2025-2029.

                  The Hydraulic Equipment market is expected to grow at a CAGR of 4.6% during 2025-2029.

                  Hydraulic Equipment market is segmented by Product( Pump and motor, Valve, Cylinder, Accumulator and filter, Others) Application( Mobile, Industrial) End-user( Construction, Mining, Agriculture, Packaging, Others)

                  2G Engineering, Caterpillar Inc., Daikin Industries Ltd., Dana Inc., Dyna Flex Inc, Eaton Corp. plc, Emerson Electric Co., Enerpac Tool Group Corp., Flowserve Corp., HANNON HYDRUALICS LLC, HYDAC International GmbH, Kawasaki Heavy Industries Ltd., Komatsu Ltd., Parker Hannifin Corp., Robert Bosch GmbH, Siemens AG, SMC Corp., Texas Hydraulics Inc., WEBER HYDRAULIK GmbH, Wipro Ltd. are a few of the key vendors in the Hydraulic Equipment market.

                  APAC will register the highest growth rate of 40% among the other regions. Therefore, the Hydraulic Equipment market in APAC is expected to garner significant business opportunities for the vendors during the forecast period.

                  US, China, Japan, Canada, India, South Korea, UK, Germany, Australia, France

                  • Emergence of industrial automationIndustrial automation involves the use of control systems is the driving factor this market.
                  • robots is the driving factor this market.
                  • and information technologies to handle different processes in manufacturing and other industries. Hydraulic equipment plays a vital role in this automation revolution due to its ability to provide precise and powerful motion control. Industrial automation allows for streamlined production lines and higher throughput rates is the driving factor this market.
                  • leading to greater demand for hydraulic equipment to power machinery and tools involved in these automated processes. Hydraulic systems offer advantages such as high power density is the driving factor this market.
                  • precise control is the driving factor this market.
                  • and robustness is the driving factor this market.
                  • making them suitable for various automation applications. Moreover is the driving factor this market.
                  • the trend towards smart factories and Industry 4.0 initiatives further fuels the demand for hydraulic equipment. Integration of hydraulic systems with sensors is the driving factor this market.
                  • actuators is the driving factor this market.
                  • and data analytics enables real-time monitoring and optimization of equipment performance is the driving factor this market.
                  • leading to enhanced efficiency and reduced downtime.The growing complexity of manufacturing tasks is the driving factor this market.
                  • such as intricate part manipulation and assembly is the driving factor this market.
                  • requires advanced hydraulic solutions with features such as proportional control and synchronized motion. This drives the adoption of specialized hydraulic equipment tailored for automation applications. Furthermore is the driving factor this market.
                  • industries such as automotive is the driving factor this market.
                  • aerospace is the driving factor this market.
                  • and electronics is the driving factor this market.
                  • which heavily rely on automation for precision manufacturing is the driving factor this market.
                  • are significant consumers of hydraulic equipment. The expansion of these industries is the driving factor this market.
                  • coupled with the ongoing trend toward automation is the driving factor this market.
                  • is expected to create substantial opportunities for hydraulic equipment manufacturers worldwide. Overall is the driving factor this market.
                  • the growing adoption of industrial automation will have a positive impact on the growth of the global hydraulic equipment market during the forecast period. is the driving factor this market.

                  The Hydraulic Equipment market vendors should focus on grabbing business opportunities from the Pump and motor segment as it accounted for the largest market share in the base year.