Hydrogen Fuel Market Analysis APAC, Europe, North America, Middle East and Africa, South America - US, China, Japan, Germany, France - Size and Forecast 2024-2028

Hydrogen Fuel Market Analysis APAC, Europe, North America, Middle East and Africa, South America - US, China, Japan, Germany, France - Size and Forecast 2024-2028

Published: Dec 2023 160 Pages SKU: IRTNTR76972

Market Overview at a Glance

$11.85 B
Market Opportunity
9.51%
CAGR
9.05
YoY growth 2023-2024(%)

Hydrogen Fuel Market 2024-2028

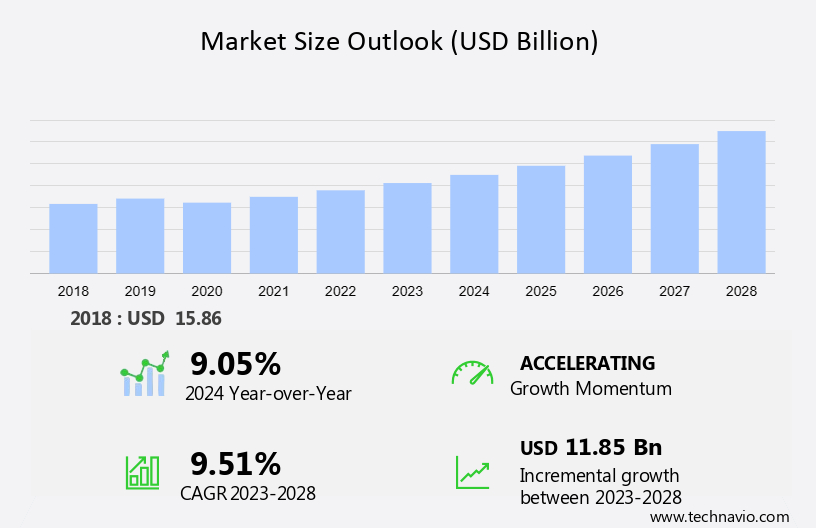
The hydrogen fuel market size is forecast to increase by USD 11.85 billion and is estimated to grow at a CAGR of 9.51% between 2023 and 2028. The report includes historic market data from 2018-2022. The market is experiencing a significant rise in demand for green hydrogen, driven by the global push towards sustainability and renewable energy sources. Alongside this, there's an increasing focus on low-carbon and blue hydrogen, as industries look for cleaner alternatives to traditional fossil fuels. These developments are further complemented by the emergence of power-to-X technologies, which convert surplus renewable energy into other forms of energy carriers like hydrogen, fuels, and chemicals. Together, these trends are shaping a more sustainable future for energy production and consumption, marking a pivotal shift in the global energy landscape

Hydrogen Fuel Market Overview :

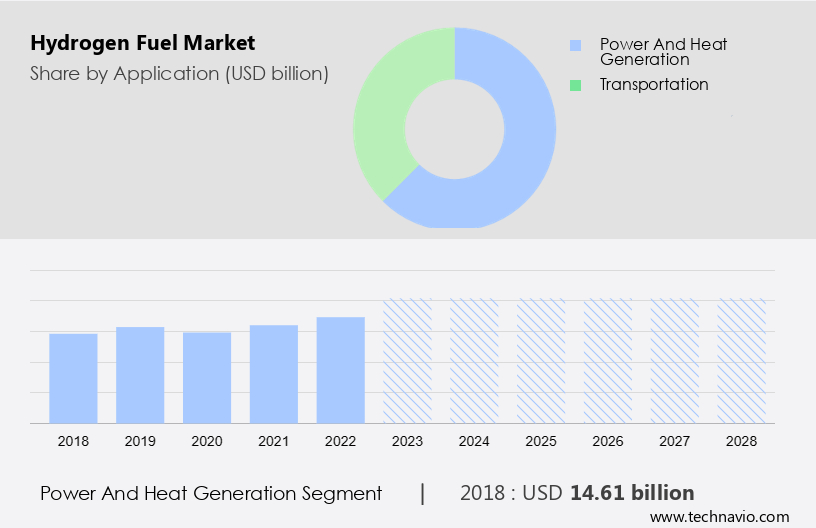
  • The market segmentation by Application is categorized as power and heat generation and transportation
  • The market segmentation by Source categorized as grey, green, and blue
  •  Power and heat generation is the fastest-growing segment during the forecast year
  • The power and heat generation  was the largest segment and was valued at  USD 14.61 billion in 2018
  • The Regional Analysis consists of APAC, Europe, North America, Middle East and Africa, and South America
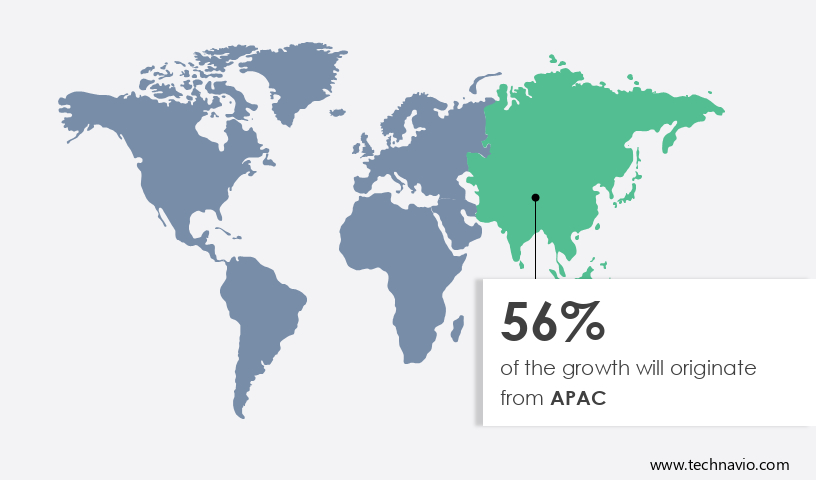
  • APAC is is most dominating region during the forecast period
  •  It also includes an in-depth analysis of advancements in hydrogen technologies, growing interest in green hydrogen, and concerns associated with hydrogen purity and quality. 

Hydrogen Fuel Market Size

 Download Free Sample in a Minute 

The Hydrogen Fuel Market is rapidly evolving, driven by the demand for sustainable and energy-efficient technologies and the global push for energy transition towards climate-neutral targets. Clean hydrogen hubs are emerging, focusing on reducing carbon footprints through green hydrogen plants and innovations like steam methane reforming and coal gasification. The market is also seeing growth in methanol and ammonia manufacturing, vital for sectors like chemical and refineries. As electricity demand rises, hydrogen refueling stations and hydrogen transport systems are expanding, supported by governments and their net-zero CO2 emissions and zero-energy buliding initiatives. The shift to low-carbon hydrogen and green hydrogen strategy underpins the development of hydrogen-based economies, aiming to reduce GHG emissions and drive decarbonization.

Hydrogen Fuel Market Trends 

Growing interest in green hydrogen is an emerging trend shaping the market growth. Green hydrogen is produced using renewable energy sources, making it a carbon-free and environmentally sustainable energy carrier. Increasing awareness of climate change and the need for decarbonization drive the interest in green hydrogen as a clean alternative.  Further, industries with high hydrogen demand seek sustainable alternatives to support their supply chains and meet environmental goals. Hydrogen fuel is also increasingly being utilized in solid oxide fuel cells due to its efficiency and environmental benefits. Investments are being made to expand hydrogen infrastructure, including the development of refuelling stations for fuel cell vehicles and the establishment of hydrogen pipelines.

For instance, in October 2023, the Ministry of New and Renewable Energy of India published a research and development (R&D) roadmap for the National Green Hydrogen Mission. The roadmap has a budget of Rs 400 crore. Similarly, in March 2023, the European Commission committed an additional Euro 200 million to the Clean Hydrogen Joint Undertaking to speed up the deployment of hydrogen valleys. This is part of the REPowerEU Plan, which seeks to increase Europe's number of hydrogen valleys. Thus, the growing interest in green hydrogen will drive the growth of the market during the forecast period.

Market Segmentation

The hydrogen fuel market report forecasts market growth by revenue at global, regional & country levels and provides an analysis of the latest trends and growth opportunities from 2018 to 2028. 

  • Application Outlook
    • Power and heat generation
    • Transportation
  • Source Outlook
    • Grey
    • Green
    • Blue
  • Region Outlook
    • North America
      • The U.S.
      • Canada
    • South America
      • Chile
      • Brazil
      • Argentina 
    • Europe
      • The U.K.
      • Germany
      • France
      • Rest of Europe
    • APAC
      • China
      • India
    • Middle East & Africa
      • Saudi Arabia
      • South Africa
      • Rest of the Middle East & Africa

Power and heat generation

The power and heat generation is estimated to witness significant growth during the forecast period. Hydrogen fuel cells convert hydrogen gas and oxygen from the air into electricity through an electrochemical reaction. This process generates electricity, water vapour, and heat. Fuel cells are used in various applications, including stationary power generation, transportation (fuel cell vehicles), and portable power devices. 

Hydrogen Fuel Market Size

Get a glance at the market contribution of various segments Download the PDF Sample

The fuel cells use hydrogen fuel and oxygen from the air to generate power, water, and heat. The heat can be utilized to keep the battery compartment or cabin warm in temperatures as low as -30 degrees Celsius. Hydrogen fuel cells can be integrated into combined heat and power systems. In these systems, the heat produced as a byproduct of the electrochemical reaction can be captured and utilized for heating purposes, increasing the overall energy efficiency. Hydrogen fuel cells can provide power for remote or off-grid locations, acting as microgrid energy sources or backup power systems. Hydrogen can be used as a fuel in boilers for industrial heating applications. This can be an alternative to natural gas or conventional fuels. Thus, the use of hydrogen in power and heat generation offers several advantages, including high energy efficiency, low emissions (especially if produced through green or blue hydrogen methods), and versatility in applications, which will drive the growth of the power and heat generation  segment and the market during the forecast period.

Hydrogen Fuel Market Regional Analysis

Hydrogen Fuel Market Share by Geography

For more insights on the market share of various regions Download PDF Sample now!

APAC is estimated to contribute 56% to the growth of the global market during the forecast period. Technavio’s analysts have elaborately explained the regional trends and drivers that shape the market during the forecast period. The regional hydrogen fuel market is expected to increase significantly during the forecast period. The emphasis on producing hydrogen through renewable methods, such as electrolysis powered by renewable energy sources (solar, wind), was a key factor. The APAC region's abundant renewable energy resources make it well-suited for sustainable hydrogen production. The industrial sector in the APAC region, including sectors such as steel, chemicals, and refining, was exploring the use of hydrogen as a clean energy source. Hydrogen's potential for decarbonizing industrial processes was a driving force for its adoption. 

For instance, the Government of India has set a target of producing 5 million metric tons of green hydrogen per year by 2030. As a result, India would become a significant global producer of green hydrogen. In addition, the Government of India intends to cut carbon emissions by 50 million metric tons and save more than USD 12 billion on fossil fuel imports by 2030. Thus, these factors will drive the growth of the hydrogen fuel market in APAC during the forecast period. 

Hydrogen Fuel Market Dynamic

The market is growing, despite explosion and flammability risks. Key drivers include steel reduction and carbon footprint reduction efforts, alongside the expanding grey hydrogen market and steam methane reformation techniques. The market is boosted by renewable energy capacity expansion, especially in the chemical sectors, which seek cleaner fuel solutions. A robust hydrogen network supports energy generation and desulfurization processes, while innovations in pyrolysis and ammonia production fuel further fuel cell development. Low emission fuel alternatives are essential to combat infrared radiation, net heat energy, and greenhouse gases, including CO2 emissions from electricity and heat production. The rise of synthetic energy carrier, such as synthetic gas, through alkaline electrolysis, reflects the industry's focus on energy transformation and decarbonization choices.

Key Driver of Hydrogen Fuel Market

Advancements in hydrogen technologies are notably driving the market growth. Improvement in electrolysis technology, particularly the development of high-efficiency electrolyzers, contributes to the cost reduction of green hydrogen production. Research and development efforts are focused on enhancing the performance and durability of fuel cells, including proton exchange membrane (PEM) and solid oxide fuel cells (SOFC). The development of advanced hydrogen storage materials and methods, including solid-state hydrogen storage, contributes to improving the safety, density, and practicality of storing hydrogen. 

Moreover, advancements in hydrogen infrastructure technologies, including efficient compression and transportation methods, support the development of a robust and widespread hydrogen distribution network. The incorporation of digital technologies and automation in hydrogen production and utilization processes enhances operational efficiency and reduces costs. Thus, the advancements in hydrogen technologies will drive the growth of the market during the forecast period.

Significance Challenges of Hydrogen Fuel Market

Concerns associated with hydrogen purity and quality are a significant challenge hindering the market growth. The presence of impurities and contaminants, such as moisture, oxygen, sulfur compounds, and other trace elements, can negatively affect the performance and efficiency of hydrogen-based technologies, particularly fuel cells. The lack of standardized purity levels for hydrogen can lead to variations in quality. Different applications may require different purity standards, and a lack of harmonized standards can pose challenges for industry stakeholders. 

Moreover, hydrogen's reactivity with certain materials, such as metals, can lead to embrittlement and other material degradation issues. Ensuring compatibility with storage and distribution infrastructure is crucial for maintaining purity. Thus, the concerns associated with hydrogen purity and quality will hinder the growth of the market during the forecast period.

Hydrogen Fuel Market Customer Landscape

The market research report includes the adoption lifecycle of the market, covering from the innovator’s stage to the laggard’s stage. It focuses on adoption rates in different regions based on penetration. Furthermore, the market forecast report includes key purchase criteria and drivers of price sensitivity to help companies evaluate the their growth strategies.

Hydrogen Fuel Market Share by Geography

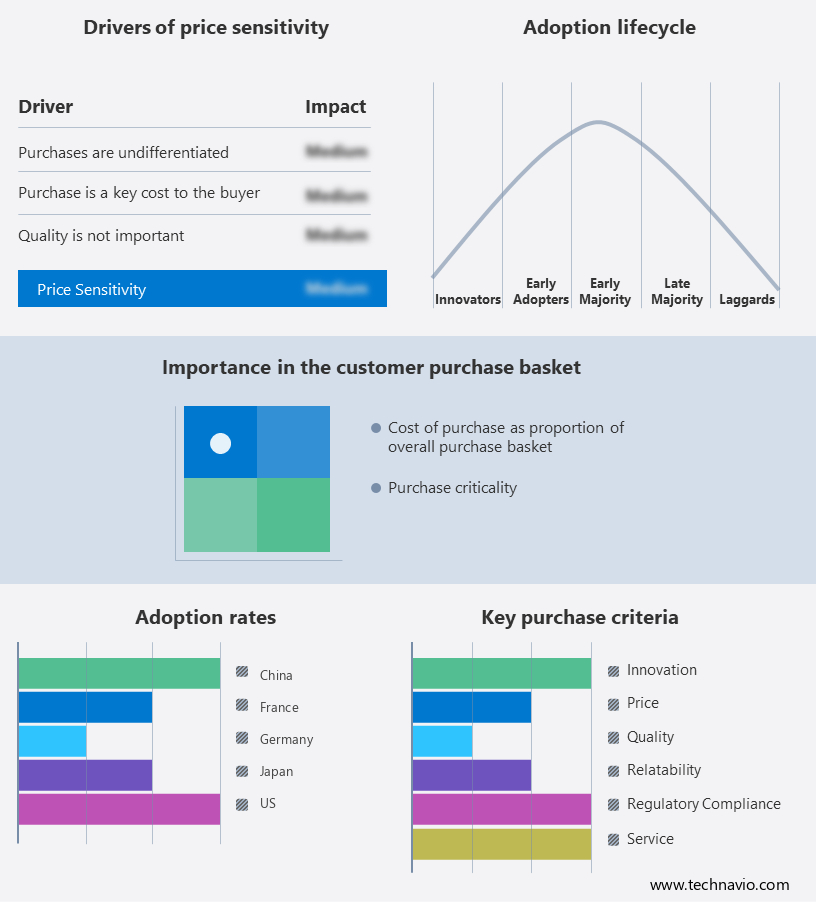
Global Hydrogen Fuel Market Customer Landscape

Major Hydrogen Fuel Market Companies

Companies are implementing various strategies, such as strategic alliances, partnerships, mergers and acquisitions, geographical expansion, and product/service launches, to enhance their presence in the market.

Acciona SA: The company offers hydrogen fuels such as grey hydrogen, blue hydrogen, and green hydrogen.

The research report also includes detailed analyses of the competitive landscape of the market and information about 20 market companies, including:

  • Air Products and Chemicals Inc.
  • Ballard Power Systems Inc.
  • ENGIE SA
  • Equinor ASA
  • HyAxiom, Inc.
  • Iberdrola SA
  • Indian Oil Corp. Ltd.
  • ITM Power plc
  • Linde Plc
  • McPhy Energy SA
  • Nel ASA
  • Orsted AS
  • Plug Power Inc.
  • Praxair Technology Inc.
  • Saudi Arabian Oil Co.
  • Shell plc
  • TotalEnergies SE
  • Woodside Energy Group Ltd.
  • Air Liquide SA

Qualitative and quantitative analysis of companies has been conducted to help clients understand the wider business environment as well as the strengths and weaknesses of key market players. Data is qualitatively analyzed to categorize companies as pure play, category-focused, industry-focused, and diversified; it is quantitatively analyzed to categorize companies as dominant, leading, strong, tentative, and weak.

The market is central to addressing the greenhouse effect and reducing green gas emissions like CO2 emission. The development of synthetic energy carrier from electrical energy is advancing, with innovations that compress and liquefy hydrogen to optimize its energy content. Despite inherent energy losses, this transformation of chemical energy is crucial for hydrogen programmes. The market is also focusing on the deployment of hydrogen storage tanks in transportation markets, supported by low-carbon hydrogen generating technologies that meet stringent hydrogen purity requirements. Industrial clients are demanding precise metering and consistent gas quality in local gas markets. Hydrogen manufacturers are leveraging global sales and marketing networks to expand the gray hydrogen market, especially where low-cost natural gas is available, with significant applications in chemical and refinery sectors and aerospace and defense industries.

Hydrogen Fuel Market Scope

Report Coverage

Details

Page number

160

Base year

2023

Historic period

2018-2022

Forecast period

2024-2028

Growth momentum & CAGR

Accelerate at a CAGR of 9.51%

Market Growth 2024-2028

USD 11.85 billion

Market structure

Fragmented

YoY growth 2023-2024(%)

9.05

Regional analysis

APAC, Europe, North America, Middle East and Africa, and South America

Performing market contribution

APAC at 56%

Key countries

US, China, Japan, Germany, and France

Competitive landscape

Leading Companies, Market Positioning of Companies, Competitive Strategies, and Industry Risks

Key companies profiled

Acciona SA, Air Products and Chemicals Inc., Ballard Power Systems Inc., ENGIE SA, Equinor ASA, HyAxiom, Inc., Iberdrola SA, Indian Oil Corp. Ltd., ITM Power plc, Linde Plc, McPhy Energy SA, Nel ASA, Orsted AS, Plug Power Inc., Praxair Technology Inc., Saudi Arabian Oil Co., Shell plc, TotalEnergies SE, Woodside Energy Group Ltd., and Air Liquide SA

Market dynamics

Parent market analysis, Market growth and Forecasting ,Market growth inducers and obstacles, Fast-growing and slow-growing segment analysis, COVID-19 impact and recovery analysis and future consumer dynamics, and Market condition analysis for the forecast period. 

Customization purview

If our market forecasting report has not included the data that you are looking for, you can reach out to our analysts and get segments customized.

Download PDF Sample

What are the Key Data Covered in this Market Research and Growth Report?

  • CAGR of the market during the forecast period
  • Detailed information on factors that will drive the market growth analysis  between 2024 and 2028
  • Precise estimation of the market  size and its contribution of the market in focus to the parent market
  • Accurate predictions about upcoming trends and changes in consumer behavior
  • Growth of the market across APAC, Europe, North America, Middle East and Africa, and South America
  • A thorough analysis of the market’s competitive landscape and detailed information about companies
  • Comprehensive analysis of factors that will challenge the growth of market companies

We can help! Our analysts can customize this market research report to meet your requirements. 

Get in touch

1 Executive Summary

  • 1.1 Market overview
    • Exhibit 01: Executive Summary – Chart on Market Overview
    • Exhibit 02: Executive Summary – Data Table on Market Overview
    • Exhibit 03: Executive Summary – Chart on Global Market Characteristics
    • Exhibit 04: Executive Summary – Chart on Market by Geography
    • Exhibit 05: Executive Summary – Chart on Market Segmentation by Application
    • Exhibit 06: Executive Summary – Chart on Market Segmentation by Source
    • Exhibit 07: Executive Summary – Chart on Incremental Growth
    • Exhibit 08: Executive Summary – Data Table on Incremental Growth
    • Exhibit 09: Executive Summary – Chart on Vendor Market Positioning

2 Market Landscape

  • 2.1 Market ecosystem
    • Exhibit 10: Parent market
    • Exhibit 11: Market Characteristics

3 Market Sizing

  • 3.1 Market definition
    • Exhibit 12: Offerings of vendors included in the market definition
  • 3.2 Market segment analysis
    • Exhibit 13: Market segments
  • 3.3 Market size 2023
    • 3.4 Market outlook: Forecast for 2023-2028
      • Exhibit 14: Chart on Global - Market size and forecast 2023-2028 ($ billion)
      • Exhibit 15: Data Table on Global - Market size and forecast 2023-2028 ($ billion)
      • Exhibit 16: Chart on Global Market: Year-over-year growth 2023-2028 (%)
      • Exhibit 17: Data Table on Global Market: Year-over-year growth 2023-2028 (%)

    4 Historic Market Size

    • 4.1 Global hydrogen fuel market 2018 - 2022
      • Exhibit 18: Historic Market Size – Data Table on global hydrogen fuel market 2018 - 2022 ($ billion)
    • 4.2 Application Segment Analysis 2018 - 2022
      • Exhibit 19: Historic Market Size – Application Segment 2018 - 2022 ($ billion)
    • 4.3 Source Segment Analysis 2018 - 2022
      • Exhibit 20: Historic Market Size – Source Segment 2018 - 2022 ($ billion)
    • 4.4 Geography Segment Analysis 2018 - 2022
      • Exhibit 21: Historic Market Size – Geography Segment 2018 - 2022 ($ billion)
    • 4.5 Country Segment Analysis 2018 - 2022
      • Exhibit 22: Historic Market Size – Country Segment 2018 - 2022 ($ billion)

    5 Five Forces Analysis

    • 5.1 Five forces summary
      • Exhibit 23: Five forces analysis - Comparison between 2023 and 2028
    • 5.2 Bargaining power of buyers
      • Exhibit 24: Chart on Bargaining power of buyers – Impact of key factors 2023 and 2028
    • 5.3 Bargaining power of suppliers
      • Exhibit 25: Bargaining power of suppliers – Impact of key factors in 2023 and 2028
    • 5.4 Threat of new entrants
      • Exhibit 26: Threat of new entrants – Impact of key factors in 2023 and 2028
    • 5.5 Threat of substitutes
      • Exhibit 27: Threat of substitutes – Impact of key factors in 2023 and 2028
    • 5.6 Threat of rivalry
      • Exhibit 28: Threat of rivalry – Impact of key factors in 2023 and 2028
    • 5.7 Market condition
      • Exhibit 29: Chart on Market condition - Five forces 2023 and 2028

    6 Market Segmentation by Application

    • 6.1 Market segments
      • Exhibit 30: Chart on Application - Market share 2023-2028 (%)
      • Exhibit 31: Data Table on Application - Market share 2023-2028 (%)
    • 6.2 Comparison by Application
      • Exhibit 32: Chart on Comparison by Application
      • Exhibit 33: Data Table on Comparison by Application
    • 6.3 Power and heat generation - Market size and forecast 2023-2028
      • Exhibit 34: Chart on Power and heat generation - Market size and forecast 2023-2028 ($ billion)
      • Exhibit 35: Data Table on Power and heat generation - Market size and forecast 2023-2028 ($ billion)
      • Exhibit 36: Chart on Power and heat generation - Year-over-year growth 2023-2028 (%)
      • Exhibit 37: Data Table on Power and heat generation - Year-over-year growth 2023-2028 (%)
    • 6.4 Transportation - Market size and forecast 2023-2028
      • Exhibit 38: Chart on Transportation - Market size and forecast 2023-2028 ($ billion)
      • Exhibit 39: Data Table on Transportation - Market size and forecast 2023-2028 ($ billion)
      • Exhibit 40: Chart on Transportation - Year-over-year growth 2023-2028 (%)
      • Exhibit 41: Data Table on Transportation - Year-over-year growth 2023-2028 (%)
    • 6.5 Market opportunity by Application
      • Exhibit 42: Market opportunity by Application ($ billion)
      • Exhibit 43: Data Table on Market opportunity by Application ($ billion)

    7 Market Segmentation by Source

    • 7.1 Market segments
      • Exhibit 44: Chart on Source - Market share 2023-2028 (%)
      • Exhibit 45: Data Table on Source - Market share 2023-2028 (%)
    • 7.2 Comparison by Source
      • Exhibit 46: Chart on Comparison by Source
      • Exhibit 47: Data Table on Comparison by Source
    • 7.3 Grey - Market size and forecast 2023-2028
      • Exhibit 48: Chart on Grey - Market size and forecast 2023-2028 ($ billion)
      • Exhibit 49: Data Table on Grey - Market size and forecast 2023-2028 ($ billion)
      • Exhibit 50: Chart on Grey - Year-over-year growth 2023-2028 (%)
      • Exhibit 51: Data Table on Grey - Year-over-year growth 2023-2028 (%)
    • 7.4 Green - Market size and forecast 2023-2028
      • Exhibit 52: Chart on Green - Market size and forecast 2023-2028 ($ billion)
      • Exhibit 53: Data Table on Green - Market size and forecast 2023-2028 ($ billion)
      • Exhibit 54: Chart on Green - Year-over-year growth 2023-2028 (%)
      • Exhibit 55: Data Table on Green - Year-over-year growth 2023-2028 (%)
    • 7.5 Blue - Market size and forecast 2023-2028
      • Exhibit 56: Chart on Blue - Market size and forecast 2023-2028 ($ billion)
      • Exhibit 57: Data Table on Blue - Market size and forecast 2023-2028 ($ billion)
      • Exhibit 58: Chart on Blue - Year-over-year growth 2023-2028 (%)
      • Exhibit 59: Data Table on Blue - Year-over-year growth 2023-2028 (%)
    • 7.6 Market opportunity by Source
      • Exhibit 60: Market opportunity by Source ($ billion)
      • Exhibit 61: Data Table on Market opportunity by Source ($ billion)

    8 Customer Landscape

    • 8.1 Customer landscape overview
      • Exhibit 62: Analysis of price sensitivity, lifecycle, customer purchase basket, adoption rates, and purchase criteria

    9 Geographic Landscape

    • 9.1 Geographic segmentation
      • Exhibit 63: Chart on Market share by geography 2023-2028 (%)
      • Exhibit 64: Data Table on Market share by geography 2023-2028 (%)
    • 9.2 Geographic comparison
      • Exhibit 65: Chart on Geographic comparison
      • Exhibit 66: Data Table on Geographic comparison
    • 9.3 APAC - Market size and forecast 2023-2028
      • Exhibit 67: Chart on APAC - Market size and forecast 2023-2028 ($ billion)
      • Exhibit 68: Data Table on APAC - Market size and forecast 2023-2028 ($ billion)
      • Exhibit 69: Chart on APAC - Year-over-year growth 2023-2028 (%)
      • Exhibit 70: Data Table on APAC - Year-over-year growth 2023-2028 (%)
    • 9.4 Europe - Market size and forecast 2023-2028
      • Exhibit 71: Chart on Europe - Market size and forecast 2023-2028 ($ billion)
      • Exhibit 72: Data Table on Europe - Market size and forecast 2023-2028 ($ billion)
      • Exhibit 73: Chart on Europe - Year-over-year growth 2023-2028 (%)
      • Exhibit 74: Data Table on Europe - Year-over-year growth 2023-2028 (%)
    • 9.5 North America - Market size and forecast 2023-2028
      • Exhibit 75: Chart on North America - Market size and forecast 2023-2028 ($ billion)
      • Exhibit 76: Data Table on North America - Market size and forecast 2023-2028 ($ billion)
      • Exhibit 77: Chart on North America - Year-over-year growth 2023-2028 (%)
      • Exhibit 78: Data Table on North America - Year-over-year growth 2023-2028 (%)
    • 9.6 Middle East and Africa - Market size and forecast 2023-2028
      • Exhibit 79: Chart on Middle East and Africa - Market size and forecast 2023-2028 ($ billion)
      • Exhibit 80: Data Table on Middle East and Africa - Market size and forecast 2023-2028 ($ billion)
      • Exhibit 81: Chart on Middle East and Africa - Year-over-year growth 2023-2028 (%)
      • Exhibit 82: Data Table on Middle East and Africa - Year-over-year growth 2023-2028 (%)
    • 9.7 South America - Market size and forecast 2023-2028
      • Exhibit 83: Chart on South America - Market size and forecast 2023-2028 ($ billion)
      • Exhibit 84: Data Table on South America - Market size and forecast 2023-2028 ($ billion)
      • Exhibit 85: Chart on South America - Year-over-year growth 2023-2028 (%)
      • Exhibit 86: Data Table on South America - Year-over-year growth 2023-2028 (%)
    • 9.8 China - Market size and forecast 2023-2028
      • Exhibit 87: Chart on China - Market size and forecast 2023-2028 ($ billion)
      • Exhibit 88: Data Table on China - Market size and forecast 2023-2028 ($ billion)
      • Exhibit 89: Chart on China - Year-over-year growth 2023-2028 (%)
      • Exhibit 90: Data Table on China - Year-over-year growth 2023-2028 (%)
    • 9.9 US - Market size and forecast 2023-2028
      • Exhibit 91: Chart on US - Market size and forecast 2023-2028 ($ billion)
      • Exhibit 92: Data Table on US - Market size and forecast 2023-2028 ($ billion)
      • Exhibit 93: Chart on US - Year-over-year growth 2023-2028 (%)
      • Exhibit 94: Data Table on US - Year-over-year growth 2023-2028 (%)
    • 9.10 Japan - Market size and forecast 2023-2028
      • Exhibit 95: Chart on Japan - Market size and forecast 2023-2028 ($ billion)
      • Exhibit 96: Data Table on Japan - Market size and forecast 2023-2028 ($ billion)
      • Exhibit 97: Chart on Japan - Year-over-year growth 2023-2028 (%)
      • Exhibit 98: Data Table on Japan - Year-over-year growth 2023-2028 (%)
    • 9.11 Germany - Market size and forecast 2023-2028
      • Exhibit 99: Chart on Germany - Market size and forecast 2023-2028 ($ billion)
      • Exhibit 100: Data Table on Germany - Market size and forecast 2023-2028 ($ billion)
      • Exhibit 101: Chart on Germany - Year-over-year growth 2023-2028 (%)
      • Exhibit 102: Data Table on Germany - Year-over-year growth 2023-2028 (%)
    • 9.12 France - Market size and forecast 2023-2028
      • Exhibit 103: Chart on France - Market size and forecast 2023-2028 ($ billion)
      • Exhibit 104: Data Table on France - Market size and forecast 2023-2028 ($ billion)
      • Exhibit 105: Chart on France - Year-over-year growth 2023-2028 (%)
      • Exhibit 106: Data Table on France - Year-over-year growth 2023-2028 (%)
    • 9.13 Market opportunity by geography
      • Exhibit 107: Market opportunity by geography ($ billion)
      • Exhibit 108: Data Tables on Market opportunity by geography ($ billion)

    10 Drivers, Challenges, and Trends

    • 10.1 Market drivers
      • 10.2 Market challenges
        • 10.3 Impact of drivers and challenges
          • Exhibit 109: Impact of drivers and challenges in 2023 and 2028
        • 10.4 Market trends

          11 Vendor Landscape

          • 11.1 Overview
            • 11.2 Vendor landscape
              • Exhibit 110: Overview on Criticality of inputs and Factors of differentiation
            • 11.3 Landscape disruption
              • Exhibit 111: Overview on factors of disruption
            • 11.4 Industry risks
              • Exhibit 112: Impact of key risks on business

            12 Vendor Analysis

            • 12.1 Vendors covered
              • Exhibit 113: Vendors covered
            • 12.2 Market positioning of vendors
              • Exhibit 114: Matrix on vendor position and classification
            • 12.3 Acciona SA
              • Exhibit 115: Acciona SA - Overview
              • Exhibit 116: Acciona SA - Business segments
              • Exhibit 117: Acciona SA - Key news
              • Exhibit 118: Acciona SA - Key offerings
              • Exhibit 119: Acciona SA - Segment focus
            • 12.4 Air Liquide SA
              • Exhibit 120: Air Liquide SA - Overview
              • Exhibit 121: Air Liquide SA - Business segments
              • Exhibit 122: Air Liquide SA - Key offerings
              • Exhibit 123: Air Liquide SA - Segment focus
            • 12.5 Air Products and Chemicals Inc.
              • Exhibit 124: Air Products and Chemicals Inc. - Overview
              • Exhibit 125: Air Products and Chemicals Inc. - Business segments
              • Exhibit 126: Air Products and Chemicals Inc. - Key news
              • Exhibit 127: Air Products and Chemicals Inc. - Key offerings
              • Exhibit 128: Air Products and Chemicals Inc. - Segment focus
            • 12.6 Ballard Power Systems Inc.
              • Exhibit 129: Ballard Power Systems Inc. - Overview
              • Exhibit 130: Ballard Power Systems Inc. - Product / Service
              • Exhibit 131: Ballard Power Systems Inc. - Key news
              • Exhibit 132: Ballard Power Systems Inc. - Key offerings
            • 12.7 Equinor ASA
              • Exhibit 133: Equinor ASA - Overview
              • Exhibit 134: Equinor ASA - Business segments
              • Exhibit 135: Equinor ASA - Key offerings
              • Exhibit 136: Equinor ASA - Segment focus
            • 12.8 HyAxiom, Inc.
              • Exhibit 137: HyAxiom, Inc. - Overview
              • Exhibit 138: HyAxiom, Inc. - Product / Service
              • Exhibit 139: HyAxiom, Inc. - Key offerings
            • 12.9 ITM Power plc
              • Exhibit 140: ITM Power plc - Overview
              • Exhibit 141: ITM Power plc - Product / Service
              • Exhibit 142: ITM Power plc - Key offerings
            • 12.10 Linde Plc
              • Exhibit 143: Linde Plc - Overview
              • Exhibit 144: Linde Plc - Business segments
              • Exhibit 145: Linde Plc - Key news
              • Exhibit 146: Linde Plc - Key offerings
              • Exhibit 147: Linde Plc - Segment focus
            • 12.11 McPhy Energy SA
              • Exhibit 148: McPhy Energy SA - Overview
              • Exhibit 149: McPhy Energy SA - Product / Service
              • Exhibit 150: McPhy Energy SA - Key offerings
            • 12.12 Nel ASA
              • Exhibit 151: Nel ASA - Overview
              • Exhibit 152: Nel ASA - Business segments
              • Exhibit 153: Nel ASA - Key offerings
              • Exhibit 154: Nel ASA - Segment focus
            • 12.13 Plug Power Inc.
              • Exhibit 155: Plug Power Inc. - Overview
              • Exhibit 156: Plug Power Inc. - Product / Service
              • Exhibit 157: Plug Power Inc. - Key offerings
            • 12.14 Praxair Technology Inc.
              • Exhibit 158: Praxair Technology Inc. - Overview
              • Exhibit 159: Praxair Technology Inc. - Product / Service
              • Exhibit 160: Praxair Technology Inc. - Key offerings
            • 12.15 Saudi Arabian Oil Co.
              • Exhibit 161: Saudi Arabian Oil Co. - Overview
              • Exhibit 162: Saudi Arabian Oil Co. - Product / Service
              • Exhibit 163: Saudi Arabian Oil Co. - Key offerings
            • 12.16 Shell plc
              • Exhibit 164: Shell plc - Overview
              • Exhibit 165: Shell plc - Business segments
              • Exhibit 166: Shell plc - Key offerings
              • Exhibit 167: Shell plc - Segment focus
            • 12.17 TotalEnergies SE
              • Exhibit 168: TotalEnergies SE - Overview
              • Exhibit 169: TotalEnergies SE - Business segments
              • Exhibit 170: TotalEnergies SE - Key news
              • Exhibit 171: TotalEnergies SE - Key offerings
              • Exhibit 172: TotalEnergies SE - Segment focus

            13 Appendix

            • 13.1 Scope of the report
              • 13.2 Inclusions and exclusions checklist
                • Exhibit 173: Inclusions checklist
                • Exhibit 174: Exclusions checklist
              • 13.3 Currency conversion rates for US$
                • Exhibit 175: Currency conversion rates for US$
              • 13.4 Research methodology
                • Exhibit 176: Research methodology
                • Exhibit 177: Validation techniques employed for market sizing
                • Exhibit 178: Information sources
              • 13.5 List of abbreviations
                • Exhibit 179: List of abbreviations

              Research Methodology

              Technavio presents a detailed picture of the market by way of study, synthesis, and summation of data from multiple sources. The analysts have presented the various facets of the market with a particular focus on identifying the key industry influencers. The data thus presented is comprehensive, reliable, and the result of extensive research, both primary and secondary.

              INFORMATION SOURCES

              Primary sources

              • Manufacturers and suppliers
              • Channel partners
              • Industry experts
              • Strategic decision makers

              Secondary sources

              • Industry journals and periodicals
              • Government data
              • Financial reports of key industry players
              • Historical data
              • Press releases

              DATA ANALYSIS

              Data Synthesis

              • Collation of data
              • Estimation of key figures
              • Analysis of derived insights

              Data Validation

              • Triangulation with data models
              • Reference against proprietary databases
              • Corroboration with industry experts

              REPORT WRITING

              Qualitative

              • Market drivers
              • Market challenges
              • Market trends
              • Five forces analysis

              Quantitative

              • Market size and forecast
              • Market segmentation
              • Geographical insights
              • Competitive landscape

              Interested in this report?

              Get your sample now to see our research methodology and insights!

              Download Now

              Frequently Asked Questions

              Hydrogen Fuel market growth will increase by $ 11.85 bn during 2024-2028.

              The Hydrogen Fuel market is expected to grow at a CAGR of 9.51% during 2024-2028.

              Hydrogen Fuel market is segmented by Application( Power and heat generation, Transportation, Transportation) Source( Grey, Green, Blue)

              Acciona SA, Air Products and Chemicals Inc., Ballard Power Systems Inc., ENGIE SA, Equinor ASA, HyAxiom, Inc., Iberdrola SA, Indian Oil Corp. Ltd., ITM Power plc, Linde Plc, McPhy Energy SA, Nel ASA, Orsted AS, Plug Power Inc., Praxair Technology Inc., Saudi Arabian Oil Co., Shell plc, TotalEnergies SE, Woodside Energy Group Ltd., Air Liquide SA are a few of the key vendors in the Hydrogen Fuel market.

              APAC will register the highest growth rate of 56% among the other regions. Therefore, the Hydrogen Fuel market in APAC is expected to garner significant business opportunities for the vendors during the forecast period.

              US, China, Japan, Germany, France

              • Advancements in hydrogen technologiesImprovement in electrolysis technology is the driving factor this market.
              • particularly the development of high-efficiency electrolyzers is the driving factor this market.
              • contributes to the cost reduction of green hydrogen production. Research and development efforts are focused on enhancing the performance and durability of fuel cells is the driving factor this market.
              • including proton exchange membrane (PEM) and solid oxide fuel cells (SOFC). Advanced fuel cells result in higher efficiency is the driving factor this market.
              • longer lifespan is the driving factor this market.
              • and reduced costs is the driving factor this market.
              • making fuel cell applications more attractive for transportation is the driving factor this market.
              • stationary power is the driving factor this market.
              • and industrial uses. Innovation in materials used in electrolyzers and fuel cells is the driving factor this market.
              • such as catalysts and membranes is the driving factor this market.
              • contributes to increased efficiency and durability. The development of advanced hydrogen storage materials and methods is the driving factor this market.
              • including solid-state hydrogen storage is the driving factor this market.
              • contributes to improving the safety is the driving factor this market.
              • density is the driving factor this market.
              • and practicality of storing hydrogen. For instance is the driving factor this market.
              • in July 2022 is the driving factor this market.
              • Equinor and the German gas producer VNG AG collaborated on the utilization and storage of low-carbon hydrogen is the driving factor this market.
              • ammonia is the driving factor this market.
              • and carbon capture. Enhanced storage solutions enable more convenient and efficient utilization of hydrogen in various applications is the driving factor this market.
              • including transportation and grid storage. Moreover is the driving factor this market.
              • advancements in power-to-gas and power-to-liquid technologies allow for the conversion of hydrogen into synthetic fuels or chemicals. Advancements in hydrogen infrastructure technologies is the driving factor this market.
              • including efficient compression and transportation methods is the driving factor this market.
              • support the development of a robust and widespread hydrogen distribution network. The incorporation of digital technologies and automation in hydrogen production and utilization processes enhances operational efficiency and reduces costs. Thus is the driving factor this market.
              • the advancements in hydrogen technologies will drive the growth of the global hydrogen fuel market during the forecast period. is the driving factor this market.

              The Hydrogen Fuel market vendors should focus on grabbing business opportunities from the Power and heat generation segment as it accounted for the largest market share in the base year.