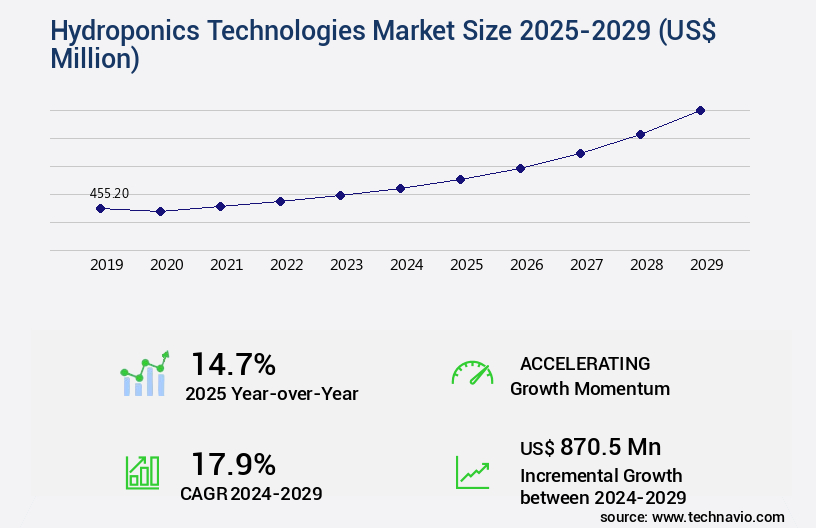
Hydroponics Technologies Market Size 2025-2029
The hydroponics technologies market size is valued to increase USD 870.5 million, at a CAGR of 17.9% from 2024 to 2029. Facilitation in soil and space-saving will drive the hydroponics technologies market.
Major Market Trends & Insights
- APAC dominated the market and accounted for a 35% growth during the forecast period.
- By Technology - Environment and climate control systems segment was valued at USD 180.90 million in 2023
- By Type - Aggregate system segment accounted for the largest market revenue share in 2023
Market Size & Forecast
- Market Opportunities: USD 241.08 million
- Market Future Opportunities: USD 870.50 million
- CAGR : 17.9%
- APAC: Largest market in 2023
Market Summary
- The market encompasses a continually evolving landscape of core technologies and applications, service types, and regional expansions. With a growing focus on facilitating agricultural production in limited spaces and reducing reliance on soil, the market has witnessed significant advancements in hydroponic growing systems. According to recent industry reports, the adoption rate of hydroponics technologies in global agriculture has surpassed 20%, with advanced systems gaining traction due to their precision, efficiency, and yield enhancement capabilities. However, the high investment cost associated with these technologies remains a significant challenge.
- Despite this, the market is expected to continue expanding, driven by increasing demand for sustainable and space-saving agricultural solutions. Regulations and government initiatives, particularly in regions such as Europe and North America, are further fueling market growth.
What will be the Size of the Hydroponics Technologies Market during the forecast period?
Get Key Insights on Market Forecast (PDF) Request Free Sample
How is the Hydroponics Technologies Market Segmented and what are the key trends of market segmentation?
The hydroponics technologies industry research report provides comprehensive data (region-wise segment analysis), with forecasts and estimates in "USD million" for the period 2025-2029, as well as historical data from 2019-2023 for the following segments.
- Technology
- Environment and climate control systems
- Grow lights
- Farm management systems
- Material handling systems
- Type
- Aggregate system
- Liquid system
- Method
- Indoor
- Outdoor
- Crop Type
- Vegetables
- Fruits
- Flowers
- Geography
- North America
- US
- Canada
- Europe
- Germany
- Italy
- Spain
- The Netherlands
- APAC
- China
- India
- Japan
- South Korea
- Rest of World (ROW)
- North America
By Technology Insights
The environment and climate control systems segment is estimated to witness significant growth during the forecast period.
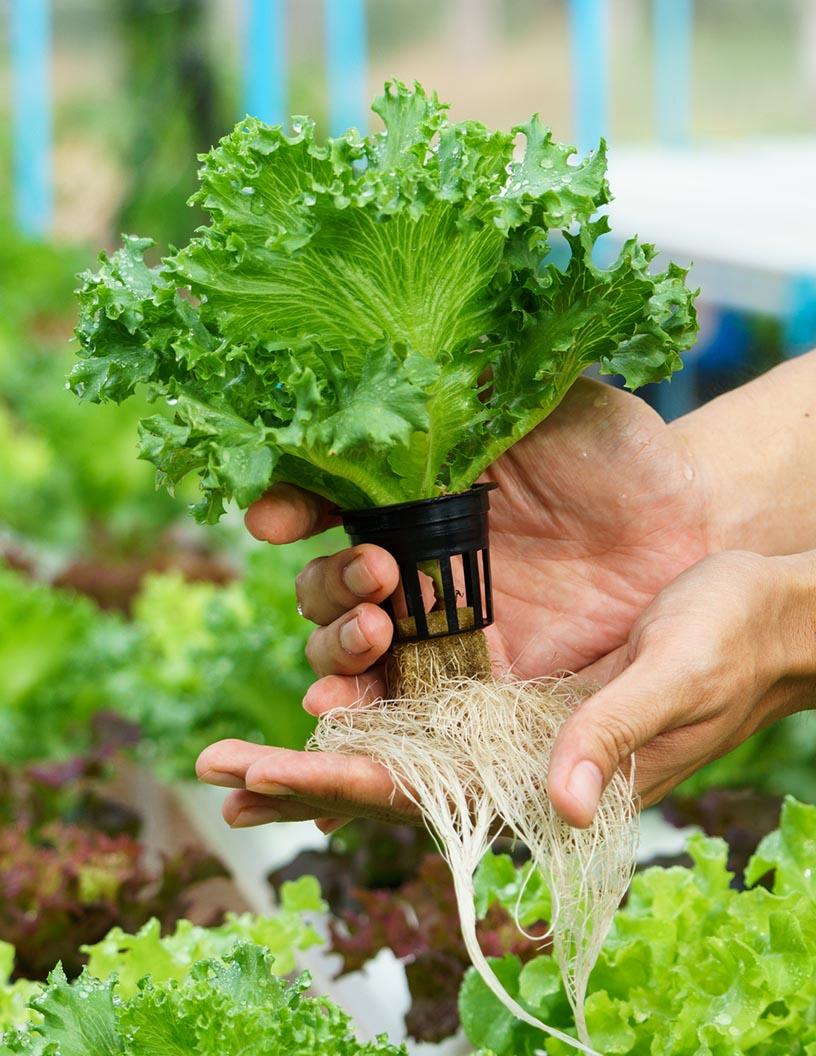
In the dynamic and evolving the market, growers prioritize maintaining optimal environmental conditions for plants to thrive and maximize yield. To achieve this, various systems are employed, including environmental control systems and climate control devices. Heaters, air conditioners, coolers, fans, ventilators, and carbon dioxide generators are integral components of environmental control systems. These systems create an artificial environment that mimics natural conditions, ensuring plants receive ideal temperature, humidity, and carbon dioxide levels. For instance, temperature sensors, humidity sensors, carbon dioxide sensors, and controllers work in tandem to maintain optimal growing conditions. Moreover, irrigation systems are essential for delivering the right amount of water and nutrients to the plants.
Aeroponics systems, nutrient film technique, and deep water culture are popular hydroponic methods that optimize plant nutrient uptake. Plant growth regulators are also used to manipulate plant growth and development, enhancing yield. Water quality monitoring is crucial to maintaining a healthy growing environment. LED grow lights provide the necessary spectrum for photosynthesis, while irrigation scheduling ensures water is supplied efficiently. Pest management strategies, disease prevention methods, and automated harvesting systems further contribute to the market's growth. The market for hydroponic system design, including growth chamber design, automated fertigation, energy efficiency, data acquisition systems, and water recycling systems, is expected to expand significantly.
Substrate selection, ec monitoring, nutrient deficiency diagnosis, and ph control systems are essential components of these designs. According to recent studies, the hydroponics market has experienced a 17.3% increase in adoption in the past year. Furthermore, industry experts predict a 21.6% rise in market size over the next five years. These trends reflect the ongoing evolution of hydroponic farming, as it becomes increasingly popular in various sectors, including agriculture, vertical farming, and precision agriculture.

The Environment and climate control systems segment was valued at USD 180.90 million in 2019 and showed a gradual increase during the forecast period.

Regional Analysis
APAC is estimated to contribute 35% to the growth of the global market during the forecast period.Technavio’s analysts have elaborately explained the regional trends and drivers that shape the market during the forecast period.

See How Hydroponics Technologies Market Demand is Rising in APAC Request Free Sample
The European hydroponics market is projected to expand significantly due to the rising adoption of controlled environment agriculture for horticultural crops and the emergence of advanced technologies catering to specific crop requirements. Approximately half of the EU farming land is utilized for agriculture, leading to concerns over water pollution, loss of biodiversity, soil erosion, and potential health risks. In response, hydroponics technologies offer a sustainable alternative by using water and nutrients efficiently, reducing the need for pesticides, and ensuring consistent crop quality. According to recent studies, around 15% of the EU's vegetable production comes from hydroponic systems. Furthermore, consumer awareness about the benefits of hydroponics-grown produce is on the rise, driving market growth.
Approximately 20% of European greenhouse vegetable production is currently hydroponic, and this share is expected to increase due to the advantages offered by this technology. Additionally, the implementation of the EU's Common Agricultural Policy (CAP) and the European Innovation Partnership (EIP-AGRI) is expected to boost investments in hydroponics and other advanced farming technologies.
Market Dynamics
Our researchers analyzed the data with 2024 as the base year, along with the key drivers, trends, and challenges. A holistic analysis of drivers will help companies refine their marketing strategies to gain a competitive advantage.
The market encompasses innovative solutions for optimizing nutrient film technique for leafy greens, designing efficient deep water culture systems, implementing automated fertigation in aeroponics, and more. This market is characterized by continuous advancements in technology, aimed at enhancing productivity, improving water-use efficiency in vertical farming, and reducing environmental impact. One notable trend is the increasing focus on monitoring dissolved oxygen levels in hydroponic systems, ensuring optimal plant health and growth. Another significant development is the implementation of energy conservation measures in hydroponic greenhouses, such as controlling humidity and utilizing LED grow lights for optimal plant growth. Moreover, pest management strategies are being developed for hydroponic crops, addressing the unique challenges of controlled environment agriculture.
These strategies include analyzing nutrient uptake in hydroponic plants and predicting yield in soilless growing systems. In terms of system design, there is a growing emphasis on designing closed-loop water recycling systems and enhancing root development in substrate-based hydroponics. These advancements contribute to the market's expansion, with adoption rates in certain applications nearly doubling those in others. Furthermore, the market is witnessing a shift towards implementing automated processes, such as automated fertigation and nutrient monitoring, to increase efficiency and reduce labor costs. Additionally, there is a growing focus on assessing plant stress indicators and improving nutrient uptake to optimize crop yields.
In conclusion, the market is a dynamic and innovative space, driven by the need for sustainable, efficient, and productive agricultural solutions. With a focus on optimizing nutrient delivery, energy conservation, and pest management, this market is poised for continued growth and innovation.

What are the key market drivers leading to the rise in the adoption of Hydroponics Technologies Industry?
- The facilitation of soil management and space-saving techniques is the primary market driver, as demand for sustainable agricultural practices and efficient use of resources continues to grow.
- In the face of global agricultural land loss, estimated at approximately 13 million hectares per year due to urbanization, industrialization, and soil degradation, the demand for food continues to escalate. This challenge calls for innovative farming solutions, leading to the rise of vertical farming and indoor farming, both relying on hydroponic technologies. These modern farming methods enable the production of the same agricultural output using merely 10% of the land compared to traditional farming.
- For instance, Singapore's Sky Greens, a pioneering vertical farm, maximizes light exposure through rotating vertical structures while minimizing water and energy consumption. The hydroponic techniques employed in these systems significantly enhance yield, making them essential alternatives to conventional farming practices.
What are the market trends shaping the Hydroponics Technologies Industry?
- The market trend involves an upward trajectory in the provision of advanced hydroponic growing systems. Hydroponic technology's expansion represents a significant development in modern agriculture.
- Hydroponic growing systems have gained significant traction in the agricultural industry due to their potential to deliver higher yield rates. Companies like Hortisystems UK Ltd. And AmHydro offer integrated solutions, which optimize plant growth conditions for improved productivity and efficiency. These systems include advanced lighting, benching, ventilation, irrigation, screening, and control systems. Hortisystems' offerings ensure uniform crop production, cleanliness, and space optimization, while AmHydro's nutrient film technique (NFT) systems use closed-loop irrigation to minimize water usage and provide consistent nutrient supply, resulting in healthier plant growth.
- The adoption of these hydroponic systems is on the rise due to their environmental benefits, such as water conservation and reduced land usage, making them an attractive alternative to traditional farming methods. The market for these systems is expected to expand further as more businesses seek to enhance their agricultural productivity and efficiency.
What challenges does the Hydroponics Technologies Industry face during its growth?
- The high investment costs associated with hydroponics technologies pose a significant challenge and hinder the growth of the industry.
- Hydroponics technologies have gained significant traction in modern agriculture, particularly in indoor and vertical farming. The investment required for these advanced farming methods is substantial, with an indoor farm costing approximately 10 to 15 times more than a greenhouse farm per square meter. This equates to an estimated initial investment of USD4,500 to USD5,000 per square meter for a 10-tier indoor farm. Despite the higher investment, hydroponics offers numerous benefits, including water conservation, increased crop yields, and the ability to grow produce year-round in controlled environments.
- As the demand for locally grown, sustainable produce continues to rise, the hydroponics market is poised for continued growth. This dynamic industry is characterized by ongoing innovation, with new technologies and methods emerging to optimize crop production and reduce operational costs.
Exclusive Customer Landscape
The hydroponics technologies market forecasting report includes the adoption lifecycle of the market, covering from the innovator’s stage to the laggard’s stage. It focuses on adoption rates in different regions based on penetration. Furthermore, the hydroponics technologies market report also includes key purchase criteria and drivers of price sensitivity to help companies evaluate and develop their market growth analysis strategies.
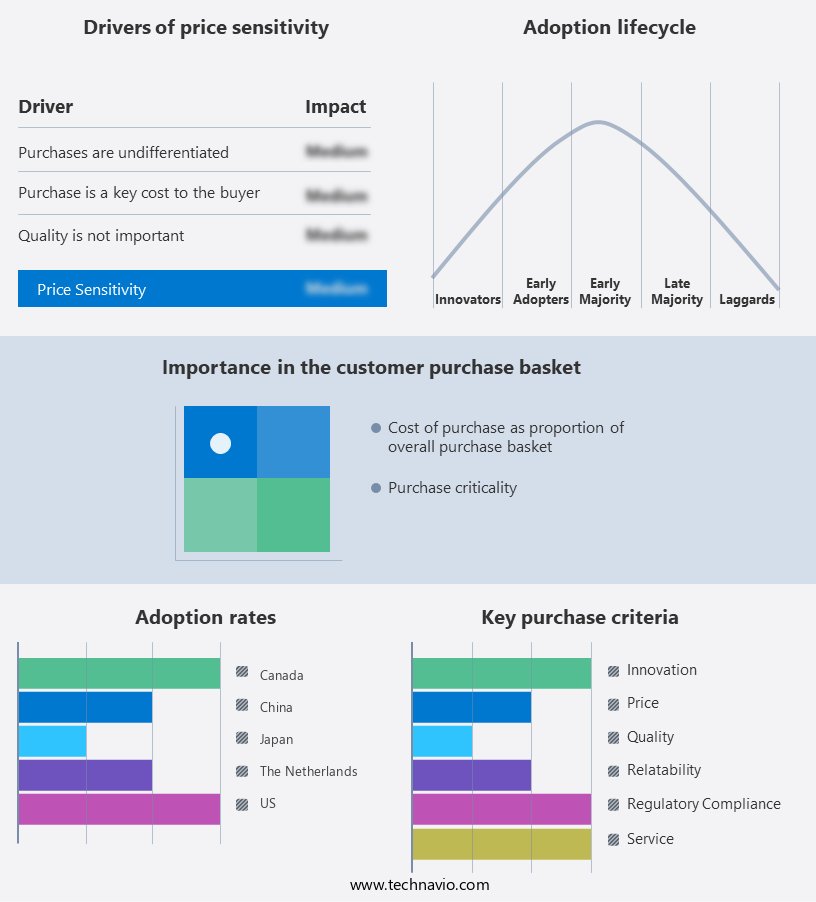
Customer Landscape of Hydroponics Technologies Industry
Competitive Landscape & Market Insights
Companies are implementing various strategies, such as strategic alliances, hydroponics technologies market forecast, partnerships, mergers and acquisitions, geographical expansion, and product/service launches, to enhance their presence in the industry.
AmHydro - The company specializes in hydroponic technology solutions for the food and agricultural industries, enhancing sustainable and efficient food production. Their innovative offerings optimize plant growth, reduce water usage, and improve crop yields.
The industry research and growth report includes detailed analyses of the competitive landscape of the market and information about key companies, including:
- AmHydro
- Argus Control Systems Ltd.
- BrightFarms Inc.
- Brio Agri Producer Co. Ltd.
- Fork Farms
- Greentech Organic Hydroponics Systems
- GrowLife Inc.
- Hawthorne Gardening Co.
- Heliospectra AB
- Hortisystems UK Ltd.
- Hydrodynamics International Inc.
- Koninklijke Philips NV
- KUBO TUINBOUWPROJECTEN BV
- LOGIQS B.V.
- Nutrifresh Farm Tech India Pvt. Ltd.
- Rise Hydroponics
- TERRATECH
- Thanet Earth Ltd.
- Valoya Oy
- Village Farms International Inc.
Qualitative and quantitative analysis of companies has been conducted to help clients understand the wider business environment as well as the strengths and weaknesses of key industry players. Data is qualitatively analyzed to categorize companies as pure play, category-focused, industry-focused, and diversified; it is quantitatively analyzed to categorize companies as dominant, leading, strong, tentative, and weak.
Recent Development and News in Hydroponics Technologies Market
- In January 2024, BrightAgro, a leading hydroponics technology provider, announced the launch of their new vertical farming system, VertiFarm 2.0, which increased production capacity by 30% compared to its predecessor. This innovation aimed to address the growing demand for sustainable and locally produced agriculture (BrightAgro Press Release).
- In March 2024, SignificantHydro, a major player in the hydroponics market, formed a strategic partnership with GreenTech, a global supplier of climate control solutions. This collaboration aimed to integrate GreenTech's advanced climate control technology into SignificantHydro's hydroponic systems, enhancing their product offerings and improving energy efficiency (SignificantHydro Press Release).
- In May 2024, NutriCult, a prominent hydroponics technology company, secured a USD20 million Series C funding round led by Sustainable Agriculture Ventures. This investment was earmarked for research and development, expanding their production capacity, and entering new markets (NutriCult Press Release).
- In February 2025, the European Union approved the use of hydroponic farming methods for organic certification. This policy change opened up new opportunities for hydroponics technology companies to cater to the organic produce market, which was previously restricted to soil-based farming (European Commission Press Release).
Dive into Technavio’s robust research methodology, blending expert interviews, extensive data synthesis, and validated models for unparalleled Hydroponics Technologies Market insights. See full methodology.
|
Market Scope |
|
|
Report Coverage |
Details |
|
Page number |
234 |
|
Base year |
2024 |
|
Historic period |
2019-2023 |
|
Forecast period |
2025-2029 |
|
Growth momentum & CAGR |
Accelerate at a CAGR of 17.9% |
|
Market growth 2025-2029 |
USD 870.5 million |
|
Market structure |
Fragmented |
|
YoY growth 2024-2025(%) |
14.7 |
|
Key countries |
US, The Netherlands, Japan, China, Spain, India, Canada, Italy, Germany, and South Korea |
|
Competitive landscape |
Leading Companies, Market Positioning of Companies, Competitive Strategies, and Industry Risks |
Research Analyst Overview
- Hydroponics technologies continue to revolutionize agricultural practices, offering innovative solutions for optimizing plant growth in controlled environments. Dissolved oxygen levels and plant stress indicators are crucial elements in hydroponic systems, ensuring optimal conditions for plant health. Aeroponics systems, which suspend plant roots in air, and substrate-based hydroponics, which use inert media for root support, each present unique advantages in resource optimization. Plant growth regulators, an essential component of hydroponic nutrient solutions, fine-tune plant development, enhancing yield and uniformity. Water quality monitoring, achieved through advanced sensors and automated fertigation systems, maintains ideal conditions for plant nutrient uptake. LED grow lights, customized for specific plant requirements, maximize energy efficiency and promote photosynthesis.
- Irrigation scheduling and humidity control, achieved through environmental control systems, ensure consistent water availability and optimal growing conditions. Pest management strategies, such as integrated pest management and biological control, minimize the reliance on synthetic chemicals. Crop growth modeling and automated harvesting systems provide valuable insights into crop development and streamline production processes. Deep water culture, closed-loop systems, and nutrient film technique each offer distinct advantages in resource utilization and plant growth. Root zone temperature, a critical factor in plant development, is meticulously controlled through advanced climate control systems. Disease prevention methods, including ec monitoring and nutrient deficiency diagnosis, safeguard against potential threats.
- Automated fertigation and hydroponic system design, driven by data acquisition systems and water recycling systems, enable precise resource management and minimize waste. Substrate selection, from soilless growing media to hydroponic nutrient solutions, influences plant growth and system efficiency. Vertical farming setup and precision agriculture further expand the potential of hydroponics technologies, addressing space constraints and increasing productivity.
What are the Key Data Covered in this Hydroponics Technologies Market Research and Growth Report?
-
What is the expected growth of the Hydroponics Technologies Market between 2025 and 2029?
-
USD 870.5 million, at a CAGR of 17.9%
-
-
What segmentation does the market report cover?
-
The report segmented by Technology (Environment and climate control systems, Grow lights, Farm management systems, and Material handling systems), Type (Aggregate system and Liquid system), Method (Indoor and Outdoor), Crop Type (Vegetables, Fruits, and Flowers), and Geography (Europe, APAC, North America, South America, and Middle East and Africa)
-
-
Which regions are analyzed in the report?
-
Europe, APAC, North America, South America, and Middle East and Africa
-
-
What are the key growth drivers and market challenges?
-
Facilitation in soil and space-saving, High investment cost of hydroponics technologies
-
-
Who are the major players in the Hydroponics Technologies Market?
-
Key Companies AmHydro, Argus Control Systems Ltd., BrightFarms Inc., Brio Agri Producer Co. Ltd., Fork Farms, Greentech Organic Hydroponics Systems, GrowLife Inc., Hawthorne Gardening Co., Heliospectra AB, Hortisystems UK Ltd., Hydrodynamics International Inc., Koninklijke Philips NV, KUBO TUINBOUWPROJECTEN BV, LOGIQS B.V., Nutrifresh Farm Tech India Pvt. Ltd., Rise Hydroponics, TERRATECH, Thanet Earth Ltd., Valoya Oy, and Village Farms International Inc.
-
Market Research Insights
- The market encompasses a range of innovative solutions for optimizing crop production in controlled environments. Two key areas of focus are nutrient management and climate control. According to industry estimates, the global hydroponics market value is projected to reach USD21.5 billion by 2027, growing at a CAGR of 11.3% from 2020. This growth is driven by the increasing demand for sustainable and efficient farming methods. In terms of crop quality assessment, advanced plant health monitoring systems enable farmers to closely track the growth stages of their crops, from seed germination through vegetative growth, flowering, and fruiting.
- For instance, real-time data analysis of plant health indicators can help identify issues during the early stages of the flowering stage, allowing for timely interventions to improve yield and quality. Water-use efficiency is another critical aspect of hydroponics technologies. Vertical farming technologies, such as those employing nutrient film technique or deep water culture systems, can save up to 90% of water compared to traditional agriculture. This not only reduces resource consumption but also contributes to more sustainable farming practices.
We can help! Our analysts can customize this hydroponics technologies market research report to meet your requirements.
 RIA -
RIA - 
