Power Market Analysis India - Size and Forecast 2024-2028

Power Market Analysis India - Size and Forecast 2024-2028

Published: Jun 2024 136 Pages SKU: IRTNTR77773

Market Overview at a Glance

$465.95 B
Market Opportunity
9.19%
CAGR
7.89
YoY growth 2023-2024(%)

India Power Market Size 2024-2028 

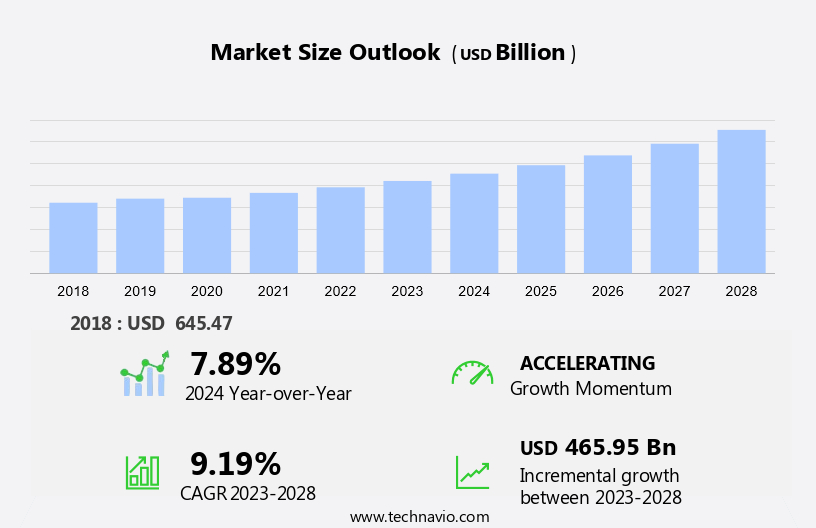
The India power market size is forecast to increase by USD 465.95 billion at a CAGR of 9.19% between 2023 and 2028. The Indian power market is witnessing significant growth, driven by government policies aimed at mitigating carbon footprints and striving for net zero emissions. The rising electricity demand, fueled by population growth and industrialization, necessitates infrastructural activities to scale up renewable energy infrastructure.

Solar energy is a key focus area, with foreign investment pouring in to capitalize on the country's abundant solar resources. However, challenges persist, including the poor financial health of DISCOMs in the power sector, which hampers the effective implementation of these initiatives. The Indian power market presents a unique opportunity for stakeholders to contribute to a sustainable energy future while addressing the pressing infrastructure needs of the country.

Power Market in India Size

 Request Free Sample

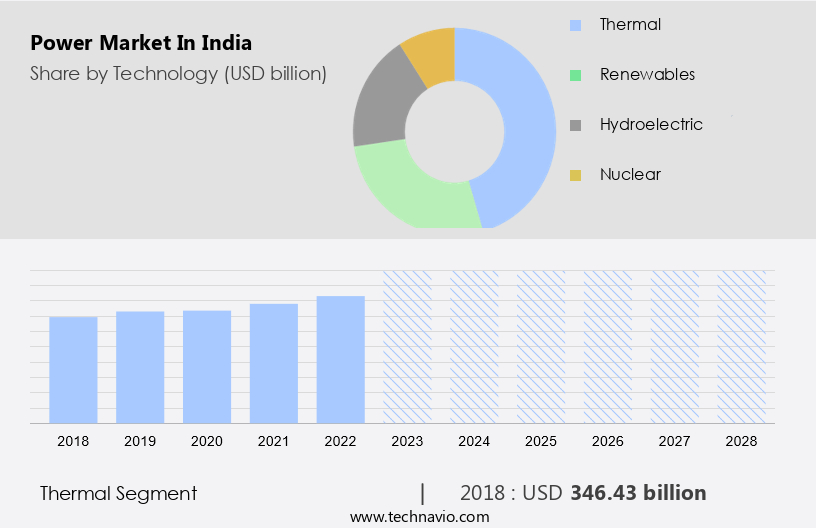
The Indian power market is a significant sector in the country's macroeconomics, with an annual power consumption of over 1,200 Terawatt-hours (TWh) and an installed capacity of over 380 GW as of 2021. The power generation sector is primarily driven by thermal (63%), hydro (19%), and renewable energy sources (18%). The regulatory structure plays a crucial role in shaping the power market, with policies focused on ensuring supply security and promoting generation infrastructure. Major power plants are located in various regions, including Western, Northern, Eastern, and Southern India. Asset transactions have been a significant trend in the power market, with several infrastructural activities underway to boost electricity demand and improve the overall efficiency of the sector. The market is expected to witness strong growth in the coming years due to increasing electricity demand and the government's focus on renewable energy.

Market Segmentation

The market research report provides comprehensive data (region-wise segment analysis), with forecasts and estimates in "USD billion" for the period 2024-2028, as well as historical data from 2018-2022 for the following segments.

  • Technology
    • Thermal
    • Renewables
    • Hydroelectric
    • Nuclear
  • End-user
    • Industrial
    • Commercial
    • Residential
  • Source
    • Non-renewable
    • Renewable
  • Geography
    • India

By Technology Insights

The thermal segment is estimated to witness significant growth during the forecast period. The market is significantly influenced by government policies, population growth, and infrastructure activities. Thermal power technology, which involves generating electricity through the combustion of fossil fuels, remains a crucial component of India's energy mix due to its reliability and cost-effectiveness. Abundant coal reserves in the country make it a readily available and reasonably priced fuel source for electricity generation. The Indian government's focus on increasing electricity access and meeting the rising electricity demand, particularly in rural areas, is driving infrastructural activities in the power sector. Furthermore, the government's initiatives to promote renewable energy, particularly solar energy, are also expected to supplement thermal power generation.

India's large population and rapid industrialization have led to a significant increase in electricity demand, making it an attractive destination for foreign investment in the power sector.

Power Market in India Size

Get a glance at the market share of various segments Request Free Sample

The thermal segment accounted for USD 346.43 billion in 2018 and showed a gradual increase during the forecast period.

Our market researchers analyzed the data with 2023 as the base year, along with the key drivers, trends, and challenges. A holistic analysis of drivers will help companies refine their marketing strategies to gain a competitive advantage.

India Power Market Driver

Mitigating carbon footprints and striving for net zero emission is the key driver of the market. The market is experiencing significant growth as a result of the increasing focus on low-carbon and sustainable energy sources. In an effort to reduce carbon emissions in the mining sector and pursue net zero carbon targets, coal and lignite companies are expanding their energy portfolios by investing in solar projects.

Moreover, this includes both rooftop and ground-mounted installations, as well as the development of solar parks on previously mined land. As of May 26, 2023, coal and lignite public sector undertakings (PSUs) collectively boast an installed capacity of approximately 1,656 MW of solar energy and 51 MW of wind energy. Deal types in this sector include debt offerings, acquisitions, and asset transactions, as companies seek to diversify and strengthen their positions in the power market.

India Power Market Trends

Rise in investments in scaling up renewable energy infrastructure is the upcoming trend in the market. The Indian power market is witnessing a notable increase in investments aimed at expanding renewable energy infrastructure. This trend is primarily fueled by the decreasing costs of clean energy technologies, such as solar and wind power, which are now becoming more economically viable compared to traditional energy sources. Consequently, investors are increasingly drawn to the burgeoning opportunities in the renewable energy sector. One recent example is a US company's announcement in February 2023 to invest USD99.65 million in innovative technology in Uttar Pradesh, India, signing 269 letters of intent (LoI) to invest in the state's renewable energy sector prior to the Global Investors' Summit (GIS).

Furthermore, deal types in the power market include debt offerings, acquisitions, and asset transactions. For instance, in the debt offerings segment, the Indian Renewable Energy Development Agency (IREDA) issued bonds worth INR 2,000 crore in February 2023 to finance renewable energy projects.

India Power Market Challenge

Concerns on poor financial health of DISCOMS in power sector is a key challenge affecting the market growth. The market plays a pivotal role in the country's development and economic growth. It is an essential indicator of a nation's standard of living and provides energy to various sectors, with the transport sector being a significant consumer. The Indian power industry encounters several challenges, including unsustainable debt, insufficient debt servicing, inadequate electricity supply and service, and unacceptably high aggregate technical and commercial (AT&C) losses. These issues persist despite the implementation of numerous policies and reforms. The power sector value chain initiates with power generation by companies referred to as GENCOs. Subsequently, power is transmitted through lines connecting generation plants to distribution substations.

Furthermore, deal types in the power sector include debt offerings, acquisitions, and asset transactions. Debt offerings provide GENCOs with much-needed capital for expansion and maintenance. Acquisitions and asset transactions facilitate consolidation and efficiency gains within the industry. Despite the challenges, the market continues to attract significant investment due to its vast installed base and growth potential.

Exclusive Customer Landscape

The market forecasting report includes the adoption lifecycle of the market, covering from the innovator's stage to the laggard's stage. It focuses on adoption rates in different regions based on penetration. Furthermore, the report also includes key purchase criteria and drivers of price sensitivity to help companies evaluate and develop their market growth analysis strategies.
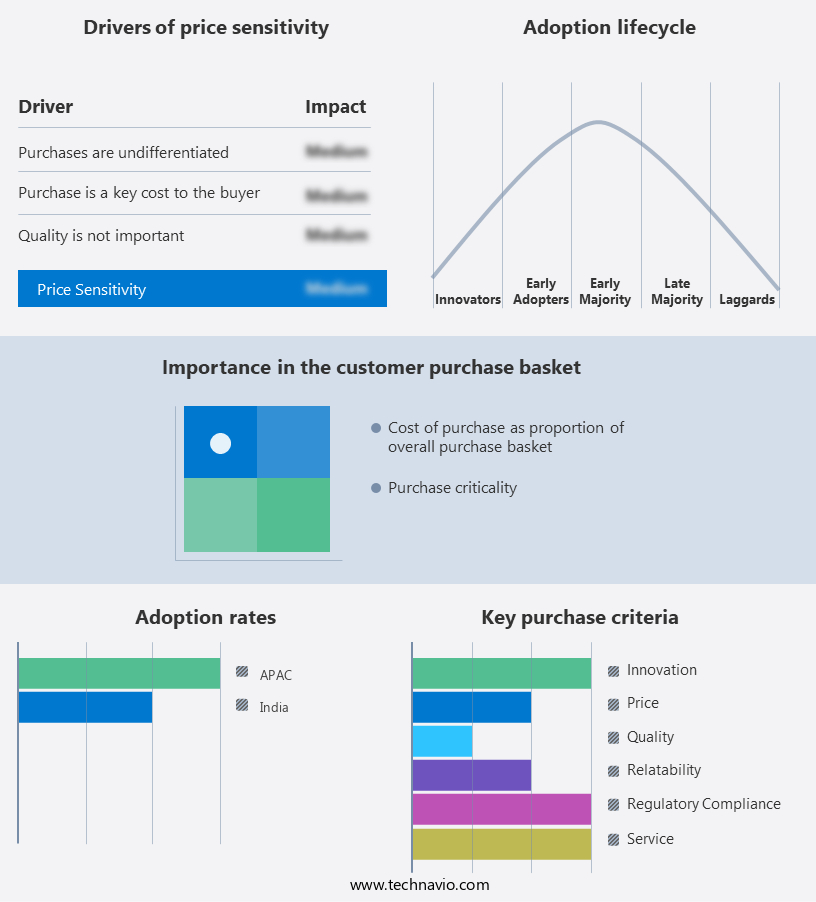
Power Market in India Share by Geography

 Customer Landscape

Key Companies & Market Insights

Companies are implementing various strategies, such as strategic alliances, partnerships, mergers and acquisitions, geographical expansion, and product/service launches, to enhance their presence in the market.

Adani Group -  The company offers power solutions such as thermal power generation through Adani Power, and contributing to sustainable energy with renewables through Adani Green Energy

The market research and growth report includes detailed analyses of the competitive landscape of the market and information about key companies, including:

  • Borosil Renewables Ltd.
  • Gujarat Fluorochemicals Ltd.
  • India Power Corp Ltd.
  • Jindal Steel and Power Ltd.
  • JSW Group
  • KP Group
  • NHPC Ltd.
  • North Eastern Electric Power Corporation Ltd
  • NTPC Ltd.
  • Power Grid Corporation of India Ltd.
  • Reliance Industries Ltd.
  • RP Sanjiv Goenka Group
  • SJVN Ltd
  • Sterling and Wilson Pvt. Ltd
  • Suzlon Energy Ltd.
  • Tata Power Co. Ltd.
  • Websol Energy System Ltd.

Qualitative and quantitative analysis of companies has been conducted to help clients understand the wider business environment as well as the strengths and weaknesses of key market players. Data is qualitatively analyzed to categorize companies as pure play, category-focused, industry-focused, and diversified; it is quantitatively analyzed to categorize companies as dominant, leading, strong, tentative, and weak.

Research Analyst Overview

The Indian power market is a significant component of the country's macroeconomics, with an annual power consumption of over 1,200 TWh and an installed base of over 350 GW. The power sector's generation capacity is primarily derived from thermal sources, accounting for approximately 65% of the total capacity, with coal reserves being the primary fuel source. The regulatory scenario in the power sector is undergoing transformative changes, with a focus on supply security and infrastructure development. The power sector's future potential is immense, driven by increasing electricity demand, infrastructural activities in the transport sector, and population growth. Renewable energy, particularly solar energy, is gaining prominence, with the National Solar Mission aiming to install 100 GW of solar capacity by 2022.

Furthermore, the power market witnesses various deal types, including debt offerings, acquisitions, and asset transactions. Government policies play a crucial role in shaping the market, with financial incentives, subsidies, and concessional financing being key drivers for renewable power projects. The thermal power sector, however, faces challenges due to increasing competition from renewable energy and environmental concerns. The coal-fired generation capacity of thermal power plants is expected to remain a significant contributor to the power sector's capacity mix. The Indian power market is a dynamic and evolving sector, with significant growth potential. According to the latest power market research report, India's power sector is expected to witness robust growth, driven by various government initiatives and regulatory frameworks.

The power market regulatory structure in India is governed by the Ministry of Power, India, which sets the policy direction and regulates the sector. The transmission and distribution infrastructure is being upgraded to ensure reliable power supply and reduce losses. India's power sector deals primarily with thermal sources, which contribute to over 60% of the country's installed capacity. However, the National Wind Energy Mission and other renewable energy initiatives are pushing for a shift towards cleaner energy sources. India has an installed renewable energy capacity of over 50 GW, with plans to increase it further through ultra mega solar parks and viability gap funding. The electricity import and export scenario in India is also gaining importance, with neighboring countries like Bangladesh and Nepal emerging as potential trading partners. India's power market is witnessing several deals, including strategic partnerships, mergers and acquisitions, and foreign investments. In conclusion, the Indian power market presents a unique investment opportunity, with a favorable regulatory environment, growing demand, and a focus on renewable energy. The sector is poised for significant growth, making it an attractive destination for investors and stakeholders.

Market Scope

Report Coverage

Details

Page number

136

Base year

2023

Historic period

2018-2022

Forecast period

2024-2028

Growth momentum & CAGR

Accelerate at a CAGR of 9.19%

Market growth 2024-2028

USD 465.95 billion

Market structure

Fragmented

YoY growth 2023-2024(%)

7.89

Key companies profiled

Adani Group, Borosil Renewables Ltd., Gujarat Fluorochemicals Ltd., India Power Corp Ltd., Jindal Steel and Power Ltd., JSW Group, KP Group, NHPC Ltd., North Eastern Electric Power Corporation Ltd, NTPC Ltd., Power Grid Corporation of India Ltd., Reliance Industries Ltd., RP Sanjiv Goenka Group, SJVN Ltd, Sterling and Wilson Pvt. Ltd, Suzlon Energy Ltd., Tata Power Co. Ltd., and Websol Energy System Ltd.

Market dynamics

Parent market analysis, market forecast , market growth inducers and obstacles,market forecast , fast-growing and slow-growing segment analysis, COVID-19 impact and recovery analysis and future consumer dynamics, market condition analysis for the forecast period

Customization purview

If our market report has not included the data that you are looking for, you can reach out to our analysts and get segments customized.

Competitive landscape

Leading Companies, Market Positioning of Companies, Competitive Strategies, and Industry Risks

Request Free Sample

What are the Key Data Covered in this Market Research Report?

  • CAGR of the market during the forecast period
  • Detailed information on factors that will drive the market growth and forecasting between 2024 and 2028
  • Precise estimation of the size of the market  and its contribution of the market in focus to the parent market
  • Accurate predictions about upcoming market growth and trends and changes in consumer behaviour
  • Growth of the market across India
  • Thorough analysis of the market's competitive landscape and detailed information about companies
  • Comprehensive analysis of factors that will challenge the growth of market companies

We can help! Our analysts can customize this market research report to meet your requirements Get in touch

1 Executive Summary

  • 1.1 Market overview
    • Exhibit 01: Executive Summary – Chart on Market Overview
    • Exhibit 02: Executive Summary – Data Table on Market Overview
    • Exhibit 03: Executive Summary – Chart on Country Market Characteristics
    • Exhibit 04: Executive Summary – Chart on Market Segmentation by Technology
    • Exhibit 05: Executive Summary – Chart on Market Segmentation by End-user
    • Exhibit 06: Executive Summary – Chart on Market Segmentation by Source
    • Exhibit 07: Executive Summary – Chart on Vendor Market Positioning

2 Market Landscape

  • 2.1 Market ecosystem
    • Exhibit 08: Parent market
    • Exhibit 09: Market Characteristics

3 Market Sizing

  • 3.1 Market definition
    • Exhibit 10: Offerings of vendors included in the market definition
  • 3.2 Market segment analysis
    • Exhibit 11: Market segments
  • 3.3 Market size 2023
    • 3.4 Market outlook: Forecast for 2023-2028
      • Exhibit 12: Chart on India - Market size and forecast 2023-2028 ($ billion)
      • Exhibit 13: Data Table on India - Market size and forecast 2023-2028 ($ billion)
      • Exhibit 14: Chart on India: Year-over-year growth 2023-2028 (%)
      • Exhibit 15: Data Table on India: Year-over-year growth 2023-2028 (%)

    4 Historic Market Size

    • 4.1 Power market in India 2018 - 2022
      • Exhibit 16: Historic Market Size – Data Table on power market in India 2018 - 2022 ($ billion)
    • 4.2 Technology Segment Analysis 2018 - 2022
      • Exhibit 17: Historic Market Size – Technology Segment 2018 - 2022 ($ billion)
    • 4.3 End-user Segment Analysis 2018 - 2022
      • Exhibit 18: Historic Market Size – End-user Segment 2018 - 2022 ($ billion)
    • 4.4 Source Segment Analysis 2018 - 2022
      • Exhibit 19: Historic Market Size – Source Segment 2018 - 2022 ($ billion)

    5 Five Forces Analysis

    • 5.1 Five forces summary
      • Exhibit 20: Five forces analysis - Comparison between 2023 and 2028
    • 5.2 Bargaining power of buyers
      • Exhibit 21: Chart on Bargaining power of buyers – Impact of key factors 2023 and 2028
    • 5.3 Bargaining power of suppliers
      • Exhibit 22: Bargaining power of suppliers – Impact of key factors in 2023 and 2028
    • 5.4 Threat of new entrants
      • Exhibit 23: Threat of new entrants – Impact of key factors in 2023 and 2028
    • 5.5 Threat of substitutes
      • Exhibit 24: Threat of substitutes – Impact of key factors in 2023 and 2028
    • 5.6 Threat of rivalry
      • Exhibit 25: Threat of rivalry – Impact of key factors in 2023 and 2028
    • 5.7 Market condition
      • Exhibit 26: Chart on Market condition - Five forces 2023 and 2028

    6 Market Segmentation by Technology

    • 6.1 Market segments
      • Exhibit 27: Chart on Technology - Market share 2023-2028 (%)
      • Exhibit 28: Data Table on Technology - Market share 2023-2028 (%)
    • 6.2 Comparison by Technology
      • Exhibit 29: Chart on Comparison by Technology
      • Exhibit 30: Data Table on Comparison by Technology
    • 6.3 Thermal - Market size and forecast 2023-2028
      • Exhibit 31: Chart on Thermal - Market size and forecast 2023-2028 ($ billion)
      • Exhibit 32: Data Table on Thermal - Market size and forecast 2023-2028 ($ billion)
      • Exhibit 33: Chart on Thermal - Year-over-year growth 2023-2028 (%)
      • Exhibit 34: Data Table on Thermal - Year-over-year growth 2023-2028 (%)
    • 6.4 Renewables - Market size and forecast 2023-2028
      • Exhibit 35: Chart on Renewables - Market size and forecast 2023-2028 ($ billion)
      • Exhibit 36: Data Table on Renewables - Market size and forecast 2023-2028 ($ billion)
      • Exhibit 37: Chart on Renewables - Year-over-year growth 2023-2028 (%)
      • Exhibit 38: Data Table on Renewables - Year-over-year growth 2023-2028 (%)
    • 6.5 Hydroelectric - Market size and forecast 2023-2028
      • Exhibit 39: Chart on Hydroelectric - Market size and forecast 2023-2028 ($ billion)
      • Exhibit 40: Data Table on Hydroelectric - Market size and forecast 2023-2028 ($ billion)
      • Exhibit 41: Chart on Hydroelectric - Year-over-year growth 2023-2028 (%)
      • Exhibit 42: Data Table on Hydroelectric - Year-over-year growth 2023-2028 (%)
    • 6.6 Nuclear - Market size and forecast 2023-2028
      • Exhibit 43: Chart on Nuclear - Market size and forecast 2023-2028 ($ billion)
      • Exhibit 44: Data Table on Nuclear - Market size and forecast 2023-2028 ($ billion)
      • Exhibit 45: Chart on Nuclear - Year-over-year growth 2023-2028 (%)
      • Exhibit 46: Data Table on Nuclear - Year-over-year growth 2023-2028 (%)
    • 6.7 Market opportunity by Technology
      • Exhibit 47: Market opportunity by Technology ($ billion)
      • Exhibit 48: Data Table on Market opportunity by Technology ($ billion)

    7 Market Segmentation by End-user

    • 7.1 Market segments
      • Exhibit 49: Chart on End-user - Market share 2023-2028 (%)
      • Exhibit 50: Data Table on End-user - Market share 2023-2028 (%)
    • 7.2 Comparison by End-user
      • Exhibit 51: Chart on Comparison by End-user
      • Exhibit 52: Data Table on Comparison by End-user
    • 7.3 Industrial - Market size and forecast 2023-2028
      • Exhibit 53: Chart on Industrial - Market size and forecast 2023-2028 ($ billion)
      • Exhibit 54: Data Table on Industrial - Market size and forecast 2023-2028 ($ billion)
      • Exhibit 55: Chart on Industrial - Year-over-year growth 2023-2028 (%)
      • Exhibit 56: Data Table on Industrial - Year-over-year growth 2023-2028 (%)
    • 7.4 Commercial - Market size and forecast 2023-2028
      • Exhibit 57: Chart on Commercial - Market size and forecast 2023-2028 ($ billion)
      • Exhibit 58: Data Table on Commercial - Market size and forecast 2023-2028 ($ billion)
      • Exhibit 59: Chart on Commercial - Year-over-year growth 2023-2028 (%)
      • Exhibit 60: Data Table on Commercial - Year-over-year growth 2023-2028 (%)
    • 7.5 Residential - Market size and forecast 2023-2028
      • Exhibit 61: Chart on Residential - Market size and forecast 2023-2028 ($ billion)
      • Exhibit 62: Data Table on Residential - Market size and forecast 2023-2028 ($ billion)
      • Exhibit 63: Chart on Residential - Year-over-year growth 2023-2028 (%)
      • Exhibit 64: Data Table on Residential - Year-over-year growth 2023-2028 (%)
    • 7.6 Market opportunity by End-user
      • Exhibit 65: Market opportunity by End-user ($ billion)
      • Exhibit 66: Data Table on Market opportunity by End-user ($ billion)

    8 Market Segmentation by Source

    • 8.1 Market segments
      • Exhibit 67: Chart on Source - Market share 2023-2028 (%)
      • Exhibit 68: Data Table on Source - Market share 2023-2028 (%)
    • 8.2 Comparison by Source
      • Exhibit 69: Chart on Comparison by Source
      • Exhibit 70: Data Table on Comparison by Source
    • 8.3 Non-renewable - Market size and forecast 2023-2028
      • Exhibit 71: Chart on Non-renewable - Market size and forecast 2023-2028 ($ billion)
      • Exhibit 72: Data Table on Non-renewable - Market size and forecast 2023-2028 ($ billion)
      • Exhibit 73: Chart on Non-renewable - Year-over-year growth 2023-2028 (%)
      • Exhibit 74: Data Table on Non-renewable - Year-over-year growth 2023-2028 (%)
    • 8.4 Renewable - Market size and forecast 2023-2028
      • Exhibit 75: Chart on Renewable - Market size and forecast 2023-2028 ($ billion)
      • Exhibit 76: Data Table on Renewable - Market size and forecast 2023-2028 ($ billion)
      • Exhibit 77: Chart on Renewable - Year-over-year growth 2023-2028 (%)
      • Exhibit 78: Data Table on Renewable - Year-over-year growth 2023-2028 (%)
    • 8.5 Market opportunity by Source
      • Exhibit 79: Market opportunity by Source ($ billion)
      • Exhibit 80: Data Table on Market opportunity by Source ($ billion)

    9 Customer Landscape

    • 9.1 Customer landscape overview
      • Exhibit 81: Analysis of price sensitivity, lifecycle, customer purchase basket, adoption rates, and purchase criteria

    10 Drivers, Challenges, and Trends

    • 10.1 Market drivers
      • 10.2 Market challenges
        • 10.3 Impact of drivers and challenges
          • Exhibit 82: Impact of drivers and challenges in 2023 and 2028
        • 10.4 Market trends

          11 Vendor Landscape

          • 11.1 Overview
            • 11.2 Vendor landscape
              • Exhibit 83: Overview on Criticality of inputs and Factors of differentiation
            • 11.3 Landscape disruption
              • Exhibit 84: Overview on factors of disruption
            • 11.4 Industry risks
              • Exhibit 85: Impact of key risks on business

            12 Vendor Analysis

            • 12.1 Vendors covered
              • Exhibit 86: Vendors covered
            • 12.2 Market positioning of vendors
              • Exhibit 87: Matrix on vendor position and classification
            • 12.3 Adani Group
              • Exhibit 88: Adani Group - Overview
              • Exhibit 89: Adani Group - Product / Service
              • Exhibit 90: Adani Group - Key offerings
            • 12.4 Gujarat Fluorochemicals Ltd.
              • Exhibit 91: Gujarat Fluorochemicals Ltd. - Overview
              • Exhibit 92: Gujarat Fluorochemicals Ltd. - Product / Service
              • Exhibit 93: Gujarat Fluorochemicals Ltd. - Key offerings
            • 12.5 India Power Corp Ltd.
              • Exhibit 94: India Power Corp Ltd. - Overview
              • Exhibit 95: India Power Corp Ltd. - Product / Service
              • Exhibit 96: India Power Corp Ltd. - Key offerings
            • 12.6 Jindal Steel and Power Ltd.
              • Exhibit 97: Jindal Steel and Power Ltd. - Overview
              • Exhibit 98: Jindal Steel and Power Ltd. - Business segments
              • Exhibit 99: Jindal Steel and Power Ltd. - Key offerings
              • Exhibit 100: Jindal Steel and Power Ltd. - Segment focus
            • 12.7 JSW Group
              • Exhibit 101: JSW Group - Overview
              • Exhibit 102: JSW Group - Product / Service
              • Exhibit 103: JSW Group - Key offerings
            • 12.8 KP Group
              • Exhibit 104: KP Group - Overview
              • Exhibit 105: KP Group - Product / Service
              • Exhibit 106: KP Group - Key offerings
            • 12.9 NHPC Ltd.
              • Exhibit 107: NHPC Ltd. - Overview
              • Exhibit 108: NHPC Ltd. - Product / Service
              • Exhibit 109: NHPC Ltd. - Key offerings
            • 12.10 North Eastern Electric Power Corporation Ltd
              • Exhibit 110: North Eastern Electric Power Corporation Ltd - Overview
              • Exhibit 111: North Eastern Electric Power Corporation Ltd - Product / Service
              • Exhibit 112: North Eastern Electric Power Corporation Ltd - Key offerings
            • 12.11 NTPC Ltd.
              • Exhibit 113: NTPC Ltd. - Overview
              • Exhibit 114: NTPC Ltd. - Product / Service
              • Exhibit 115: NTPC Ltd. - Key offerings
            • 12.12 Power Grid Corporation of India Ltd.
              • Exhibit 116: Power Grid Corporation of India Ltd. - Overview
              • Exhibit 117: Power Grid Corporation of India Ltd. - Business segments
              • Exhibit 118: Power Grid Corporation of India Ltd. - Key offerings
              • Exhibit 119: Power Grid Corporation of India Ltd. - Segment focus
            • 12.13 Reliance Industries Ltd.
              • Exhibit 120: Reliance Industries Ltd. - Overview
              • Exhibit 121: Reliance Industries Ltd. - Business segments
              • Exhibit 122: Reliance Industries Ltd. - Key news
              • Exhibit 123: Reliance Industries Ltd. - Key offerings
              • Exhibit 124: Reliance Industries Ltd. - Segment focus
            • 12.14 RP Sanjiv Goenka Group
              • Exhibit 125: RP Sanjiv Goenka Group - Overview
              • Exhibit 126: RP Sanjiv Goenka Group - Product / Service
              • Exhibit 127: RP Sanjiv Goenka Group - Key news
              • Exhibit 128: RP Sanjiv Goenka Group - Key offerings
            • 12.15 SJVN Ltd
              • Exhibit 129: SJVN Ltd - Overview
              • Exhibit 130: SJVN Ltd - Product / Service
              • Exhibit 131: SJVN Ltd - Key offerings
            • 12.16 Suzlon Energy Ltd.
              • Exhibit 132: Suzlon Energy Ltd. - Overview
              • Exhibit 133: Suzlon Energy Ltd. - Business segments
              • Exhibit 134: Suzlon Energy Ltd. - Key offerings
              • Exhibit 135: Suzlon Energy Ltd. - Segment focus
            • 12.17 Tata Power Co. Ltd.
              • Exhibit 136: Tata Power Co. Ltd. - Overview
              • Exhibit 137: Tata Power Co. Ltd. - Business segments
              • Exhibit 138: Tata Power Co. Ltd. - Key offerings
              • Exhibit 139: Tata Power Co. Ltd. - Segment focus

            13 Appendix

            • 13.1 Scope of the report
              • 13.2 Inclusions and exclusions checklist
                • Exhibit 140: Inclusions checklist
                • Exhibit 141: Exclusions checklist
              • 13.3 Currency conversion rates for US$
                • Exhibit 142: Currency conversion rates for US$
              • 13.4 Research methodology
                • Exhibit 143: Research methodology
                • Exhibit 144: Validation techniques employed for market sizing
                • Exhibit 145: Information sources
              • 13.5 List of abbreviations
                • Exhibit 146: List of abbreviations

              Research Methodology

              Technavio presents a detailed picture of the market by way of study, synthesis, and summation of data from multiple sources. The analysts have presented the various facets of the market with a particular focus on identifying the key industry influencers. The data thus presented is comprehensive, reliable, and the result of extensive research, both primary and secondary.

              INFORMATION SOURCES

              Primary sources

              • Manufacturers and suppliers
              • Channel partners
              • Industry experts
              • Strategic decision makers

              Secondary sources

              • Industry journals and periodicals
              • Government data
              • Financial reports of key industry players
              • Historical data
              • Press releases

              DATA ANALYSIS

              Data Synthesis

              • Collation of data
              • Estimation of key figures
              • Analysis of derived insights

              Data Validation

              • Triangulation with data models
              • Reference against proprietary databases
              • Corroboration with industry experts

              REPORT WRITING

              Qualitative

              • Market drivers
              • Market challenges
              • Market trends
              • Five forces analysis

              Quantitative

              • Market size and forecast
              • Market segmentation
              • Geographical insights
              • Competitive landscape

              Interested in this report?

              Get your sample now to see our research methodology and insights!

              Download Now

              Frequently Asked Questions

              Powerin India market growth will increase by $ 465.95 bn during 2024-2028.

              The Powerin India market is expected to grow at a CAGR of 9.19% during 2024-2028.

              Powerin India market is segmented by Technology( Thermal, Renewables, Hydroelectric, Nuclear) End-user( Industrial, Commercial, Residential) Source( Non-renewable, Renewable)

              Adani Group, Borosil Renewables Ltd., Gujarat Fluorochemicals Ltd., India Power Corp Ltd., Jindal Steel and Power Ltd., JSW Group, KP Group, NHPC Ltd., North Eastern Electric Power Corporation Ltd, NTPC Ltd., Power Grid Corporation of India Ltd., Reliance Industries Ltd., RP Sanjiv Goenka Group, SJVN Ltd, Sterling and Wilson Pvt. Ltd, Suzlon Energy Ltd., Tata Power Co. Ltd., Websol Energy System Ltd. are a few of the key vendors in the Powerin India market.

              APAC will register the highest growth rate of 100% among the other regions. Therefore, the Powerin India market in APAC is expected to garner significant business opportunities for the vendors during the forecast period.

              India, APAC

              • Mitigating carbon footprints and striving for net zero emissionThe power market in India is growing due to a fundamental shift toward low-carbon and sustainable energy sources is the driving factor this market.
              • which is reflected in the accelerating adoption of renewable energy resources. To mitigate carbon footprints in mining and strive for net zero carbon emissions is the driving factor this market.
              • coal and lignite companies are actively promoting renewable energy initiatives. These companies are diversifying their energy portfolio by investing in both rooftop and ground-mounted solar projects. They are exploring the development of solar parks in previously mined areas is the driving factor this market.
              • leveraging the space for sustainable energy generation. As of May 26 is the driving factor this market.
              • 2023 is the driving factor this market.
              • coal and lignite public sector undertakings (PSUs) collectively installed approximately 1 is the driving factor this market.
              • 656 MW of solar capacity and 51 MW of wind capacity. Their renewable energy roadmap aims to install a total of 5 is the driving factor this market.
              • 570 MW of renewable capacity by 2030. Coal India Limited (CIL) is the driving factor this market.
              • traditionally a fossil fuel producer is the driving factor this market.
              • is transitioning toward becoming a Net Zero Energy Company. CIL has committed to implementing a 3 GW solar power program by 2025-26 is the driving factor this market.
              • with planned installations of 398.8 MW in FY2024 is the driving factor this market.
              • 1 is the driving factor this market.
              • 443 MW in FY2025 is the driving factor this market.
              • and 1 is the driving factor this market.
              • 158 MW in FY2026. Similarly is the driving factor this market.
              • NLC India Limited (NLCIL) has achieved significant milestones is the driving factor this market.
              • being the first CPSU to install 1 GW of renewable energy capacity. By 2030 is the driving factor this market.
              • NLCIL aims to become a +6 GW renewable power company. Noteworthy among NLCIL's projects is the installation of a Solar Power Plant in Port Blair and South Andaman is the driving factor this market.
              • integrated with an 8 megawatt-hour (MWhr) Battery Energy Storage System (BESS). This project aims to smooth solar power export to the grid is the driving factor this market.
              • meeting a substantial portion of the region's peak power demand and reducing reliance on diesel generators is the driving factor this market.
              • thereby decreasing carbon emissions is the driving factor this market.
              • which will further boost the growth of the power market in India during the forecast period. is the driving factor this market.

              The Powerin India market vendors should focus on grabbing business opportunities from the Thermal segment as it accounted for the largest market share in the base year.
              RIA - Research AI Assistant
              Ask RIA