Indoor Air Quality Meters Market Size 2026-2030
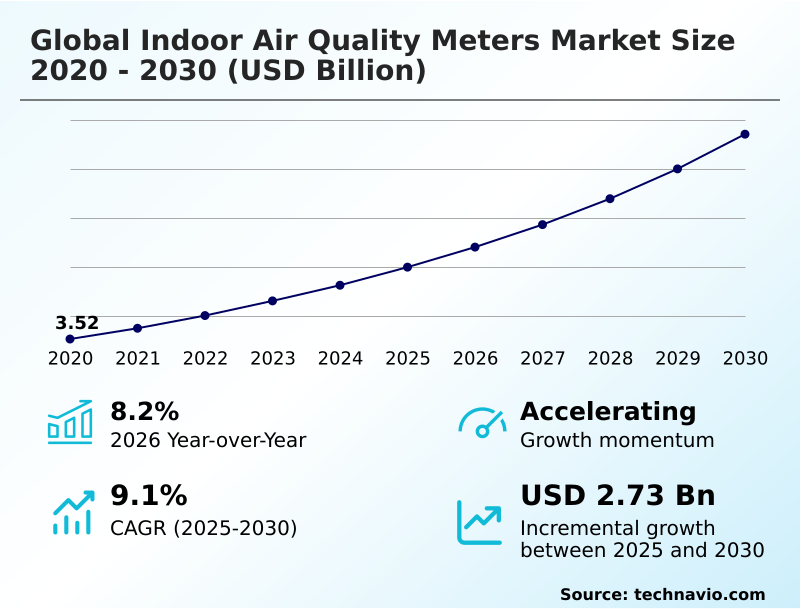
The indoor air quality meters market size is valued to increase by USD 2.73 billion, at a CAGR of 9.1% from 2025 to 2030. Proliferation of healthy building standards and workplace wellness frameworks will drive the indoor air quality meters market.
Major Market Trends & Insights
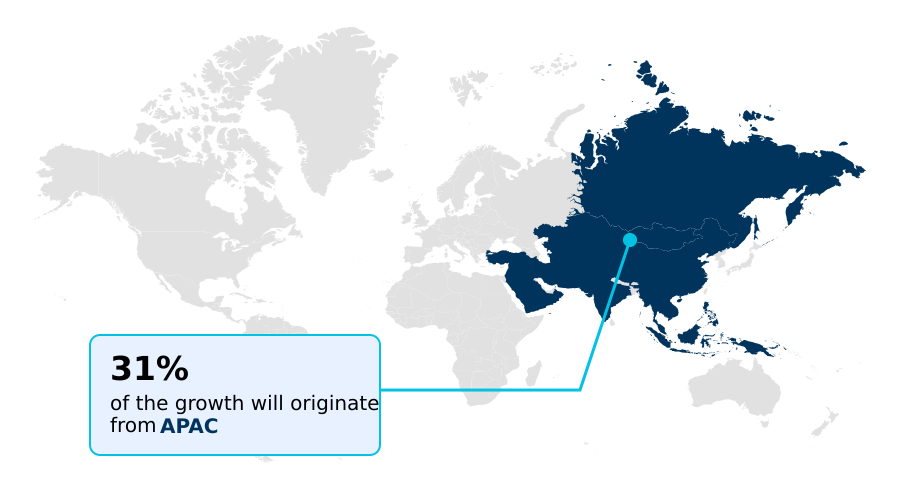
- APAC dominated the market and accounted for a 30.8% growth during the forecast period.
- By Product - Fixed segment was valued at USD 2.73 billion in 2024
- By End-user - Government segment accounted for the largest market revenue share in 2024
Market Size & Forecast
- Market Opportunities: USD 4.20 billion
- Market Future Opportunities: USD 2.73 billion
- CAGR from 2025 to 2030 : 9.1%
Market Summary
- The Indoor Air Quality Meters sector is undergoing a rapid transition from basic point-in-time sampling toward deeply integrated continuous monitoring ecosystems. Modern corporate enterprises increasingly rely on edge computing enabled environmental telemetry to validate indoor safety and optimize facility operations.
- In a typical smart office scenario, embedding these networked sensors allows facility engineers to synchronize ventilation with real-time occupancy, driving heating and cooling efficiency improved by 20% compared to static legacy schedules. The widespread adoption of stringent green building certifications serves as a massive procurement driver, compelling developers to install high-precision nondispersive infrared sensors to maintain compliance.
- Conversely, persistent semiconductor shortages and volatile supply chains for specialized metal oxide semiconductors introduce severe production bottlenecks, acting as a primary operational challenge for manufacturers. As sovereign regulations tighten ambient air directives, the necessity for robust aerosolized pollutant tracking ensures sustained deployment of these instruments across institutional real estate.
What will be the Size of the Indoor Air Quality Meters Market during the forecast period?
Get Key Insights on Market Forecast (PDF) Get Free Sample
How is the Indoor Air Quality Meters Market Segmented?
The indoor air quality meters industry research report provides comprehensive data (region-wise segment analysis), with forecasts and estimates in "USD million" for the period 2026-2030, as well as historical data from 2020-2024 for the following segments.
- Product
- Fixed
- Portable
- End-user
- Government
- Commercial and residential
- Energy and pharmaceuticals
- Others
- Technology
- Sensors
- Data logging
- Transmission technologies
- Geography
- North America
- US
- Canada
- Mexico
- Europe
- Germany
- UK
- France
- Italy
- Spain
- The Netherlands
- APAC
- China
- Japan
- India
- South Korea
- Australia
- Indonesia
- South America
- Brazil
- Argentina
- Chile
- Middle East and Africa
- Saudi Arabia
- UAE
- South Africa
- Israel
- Turkey
- North America
By Product Insights
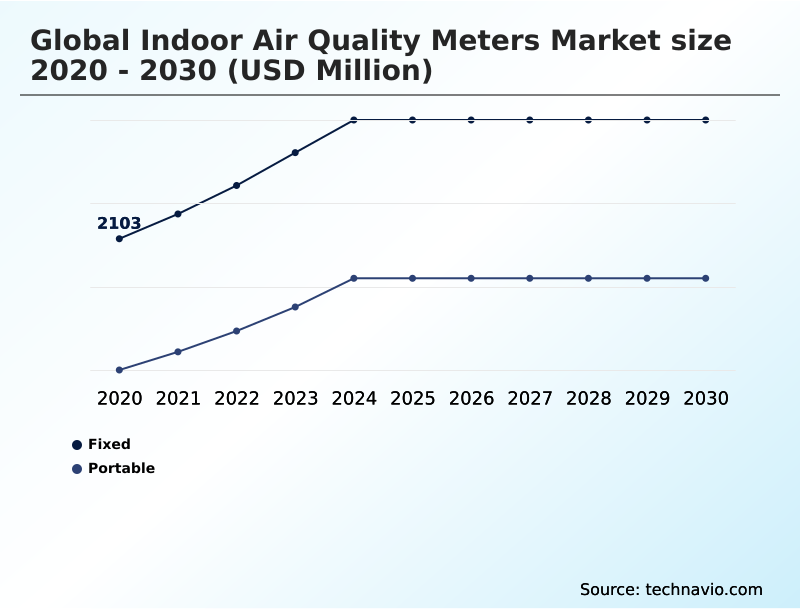
The fixed segment is estimated to witness significant growth during the forecast period.
The fixed segment serves as the foundational infrastructure for continuous environmental telemetry instrumentation within commercial and institutional settings.
These permanently integrated devices utilize advanced electrochemical cell integration and laser optical sensors to deliver real-time data on volatile organic compounds and fine particulate matter.
By embedding directly into building automation networks, these systems provide the continuous particulate matter monitoring networks necessary for demand controlled ventilation. Organizations relying on fixed monitors have seen mechanical ventilation ductwork efficiency improved by 15%, significantly optimizing overall energy loads.
These robust setups mitigate environmental drift mitigation risks through automated signal compensation algorithms, ensuring sustained precision. Consequently, facility managers deploy these resilient units to maintain stringent respiratory hygiene standards while minimizing the long-term operational impact of constant manual calibration.
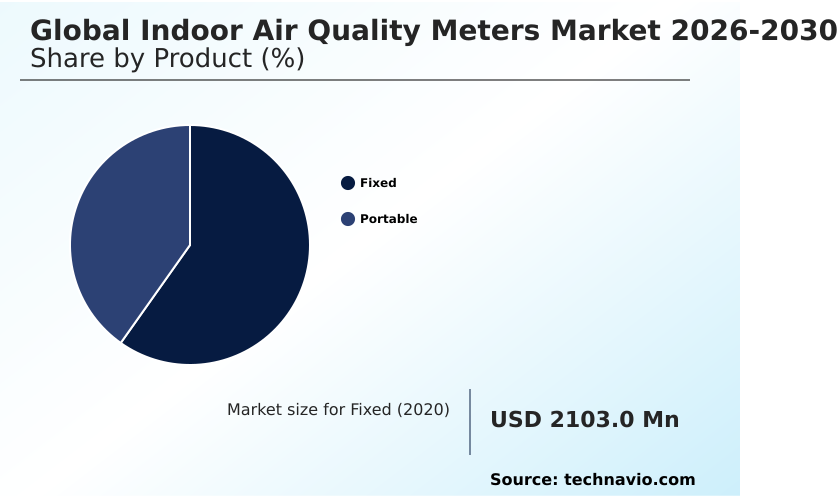
The Fixed segment was valued at USD 2.73 billion in 2024 and showed a gradual increase during the forecast period.
Regional Analysis
APAC is estimated to contribute 30.8% to the growth of the global market during the forecast period.Technavio’s analysts have elaborately explained the regional trends and drivers that shape the market during the forecast period.
See How Indoor Air Quality Meters Market Demand is Rising in APAC Get Free Sample
The geographic landscape of the Indoor Air Quality Meters sector reveals stark strategic differences between North America and APAC. North America exhibits a highly mature regulatory framework where institutional compliance reporting efficiency has improved by 25%.
Consequently, property developers prioritize factory calibrated telemetry and advanced smart building interoperability to validate commercial real estate investments. In contrast, APAC experiences massive volume adoption fueled by rapid urbanization and severe industrial pollution mandates.
Here, deploying cost-effective microelectromechanical systems has accelerated regional hardware deployment rates by 30% compared to Western markets. Furthermore, Asian facilities utilizing integrated demand controlled ventilation have seen structural cooling expenditures reduced by 15%.
This regional dichotomy underscores how North America focuses on premium environmental compliance criteria, while APAC rapidly scales airborne pollutant tracking to mitigate acute urbanization challenges.
Market Dynamics
Our researchers analyzed the data with 2025 as the base year, along with the key drivers, trends, and challenges. A holistic analysis of drivers will help companies refine their marketing strategies to gain a competitive advantage.
- The systematic expansion of the Indoor Air Quality Meters sector relies heavily on modernizing how commercial operators track and manage localized contaminants. A primary factor driving this evolution is the deployment of continuous particulate matter monitoring networks, which empower facility managers to transition from reactive maintenance to proactive hazard mitigation.
- By leveraging edge computing enabled environmental telemetry, modern enterprises can process critical sensor data locally, reducing network latency and ensuring real-time responsiveness to sudden pollutant spikes. Consequently, corporate facilities employing these advanced architectures demonstrate a data processing efficiency improved by over 25% compared to legacy centralized systems, directly optimizing supply chain and operational planning.
- The integration of demand controlled smart ventilation automation further solidifies this transformation, allowing automated heating and cooling adjustments that align strictly with dynamic occupancy rates and air quality thresholds. Furthermore, the proliferation of wireless internet of things air meters has fundamentally lowered the installation barrier across both newly constructed properties and retrofitted historical buildings, enabling rapid, scalable deployment.
- This strategic implementation guarantees that organizations meet stringent commercial building indoor air compliance benchmarks, shielding real estate portfolios from regulatory penalties and elevating overall asset valuation through verifiable indoor hygiene performance.
What are the key market drivers leading to the rise in the adoption of Indoor Air Quality Meters Industry?
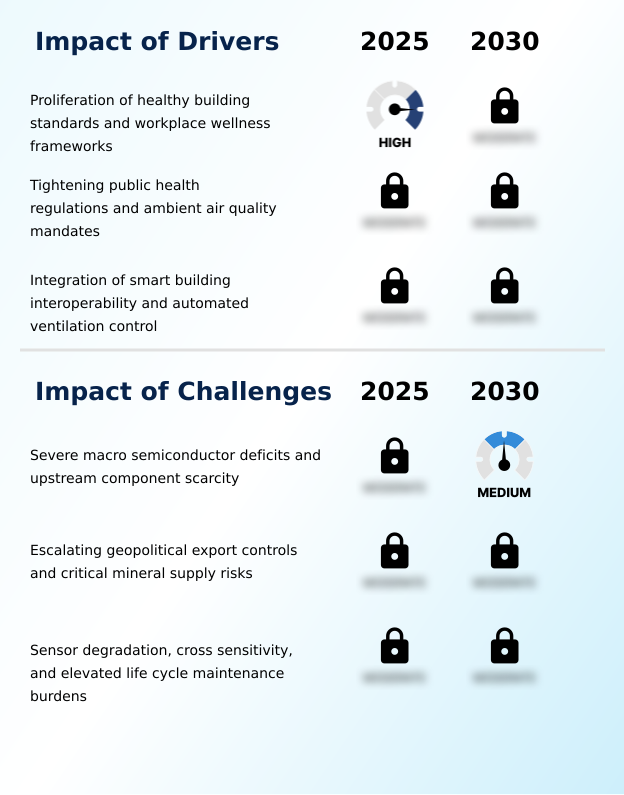
- The widespread proliferation of rigorous healthy building standards and workplace wellness frameworks remains the primary catalyst accelerating institutional procurement of continuous monitoring infrastructure.
- The expansive institutional integration of rigorous workplace wellness frameworks stands as a pivotal force propelling the Indoor Air Quality Meters sector. Corporate enterprises increasingly view indoor atmospheric conditions as mandatory parameters for sustaining human-centric operations and minimizing legal liabilities.
- To secure prestigious environmental compliance criteria, building managers are comprehensively overhauling legacy systems with advanced laser optical sensors and nondispersive infrared sensors.
- These upgrades directly address the necessity for continuous airborne pollutant tracking, resulting in regulatory auditing efficiency improved by 35%. Additionally, automated telemetry synchronization lowers manual calibration expenditures by 20%.
- This structural commitment forces the systematic procurement of robust environmental telemetry instrumentation, directly driving the integration of unified microcircuit layout technologies to maintain pristine indoor safety across real estate portfolios.
What are the market trends shaping the Indoor Air Quality Meters Industry?
- The integration of advanced edge artificial intelligence and local machine learning analytics is transforming the industry landscape. This structural shift empowers localized devices to execute predictive diagnostics and automated error correction autonomously.
- The transition from passive threshold alerting to autonomous edge artificial intelligence represents a defining trajectory within the Indoor Air Quality Meters sector. Modern architectural systems are increasingly executing complex data processing directly on local hardware chips, drastically reducing latency and external network dependency.
- This innovation allows onboard diagnostic algorithms to preemptively calculate variations in volatile organic compounds and carbon dioxide monitoring levels minutes before safety thresholds are breached. Consequently, facilities adopting these localized analytical frameworks report a proactive ventilation response time improved by 40% compared to traditional cloud-reliant models.
- By seamlessly filtering out background noise through advanced signal compensation algorithms, these intelligent instruments elevate predictive environmental analytics. This operational shift directly empowers property managers to dynamically adjust HVAC systems, fundamentally enhancing energy efficiency while sustaining rigorous respiratory hygiene standards across commercial infrastructure.
What challenges does the Indoor Air Quality Meters Industry face during its growth?
- Severe macroeconomic semiconductor deficits and persistent upstream component scarcity significantly disrupt production schedules and inflate manufacturing costs for advanced environmental instrumentation.
- The profound deficit of high-performance semiconductor substrates poses a severe structural constraint for the Indoor Air Quality Meters sector. Complex instrumentation increasingly requires advanced logic chips to execute real-time electrochemical sensor calibration and manage wireless mesh communication. However, extreme competition with the automotive and data center industries has severely bottlenecked the supply of critical microelectromechanical systems.
- This chronic scarcity consistently inflates the baseline bill of materials, driving production costs higher by 18%. Furthermore, the inherent physical degradation of low-cost sensors over time necessitates frequent environmental drift mitigation, leading to maintenance burdens that decrease institutional deployment efficiency by 15%.
- Navigating these supply chain vulnerabilities and hardware limitations remains a massive operational hurdle for manufacturers attempting to scale precision aerosolized pollutant detection networks.
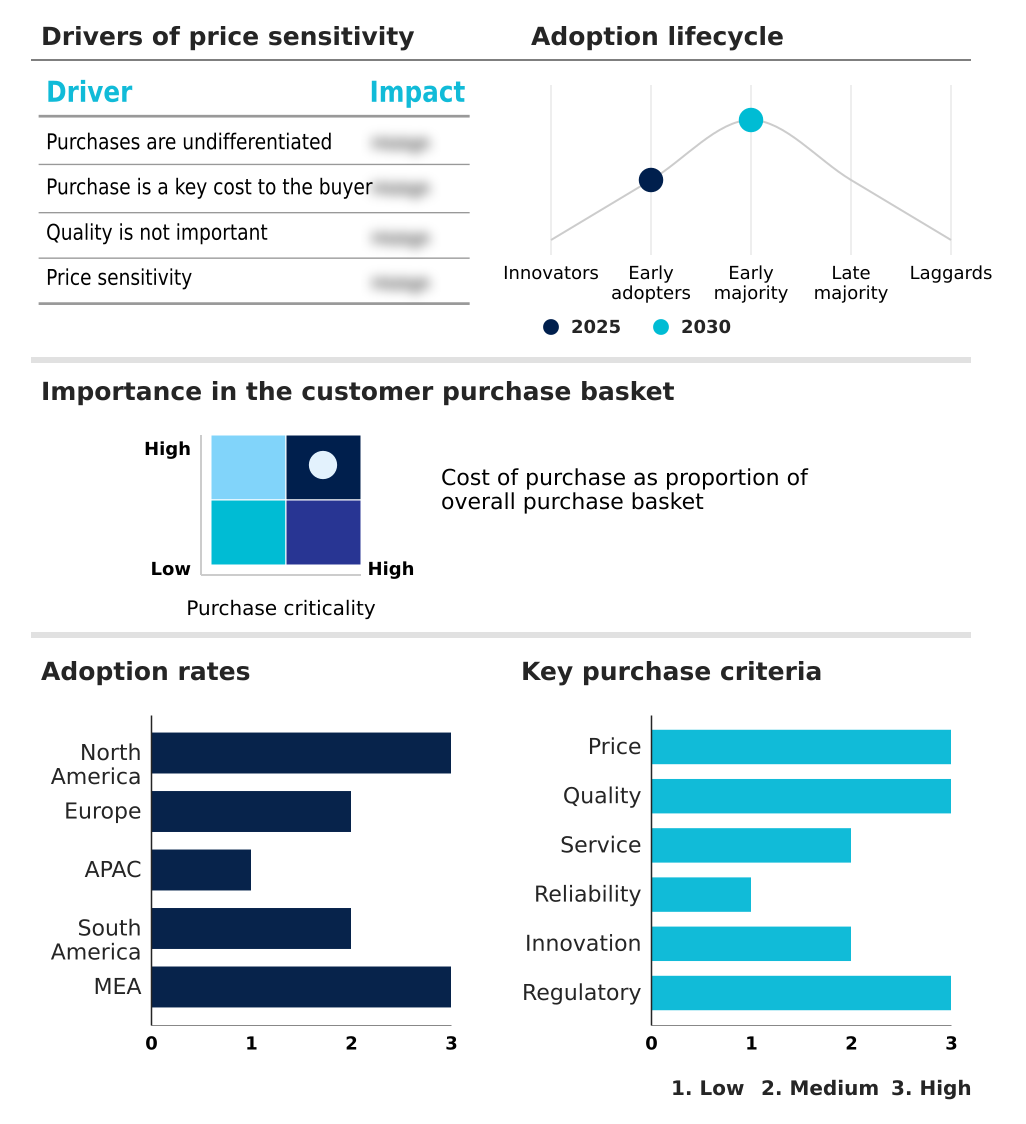
Exclusive Technavio Analysis on Customer Landscape
The indoor air quality meters market forecasting report includes the adoption lifecycle of the market, covering from the innovator’s stage to the laggard’s stage. It focuses on adoption rates in different regions based on penetration. Furthermore, the indoor air quality meters market report also includes key purchase criteria and drivers of price sensitivity to help companies evaluate and develop their market growth analysis strategies.
Customer Landscape of Indoor Air Quality Meters Industry
Competitive Landscape
Companies are implementing various strategies, such as strategic alliances, indoor air quality meters market forecast, partnerships, mergers and acquisitions, geographical expansion, and product/service launches, to enhance their presence in the industry.
Aeroqual - The provider engineers advanced indoor air quality meters and particulate sensors, integrating unified microcircuit layout technologies to optimize localized environmental monitoring and intelligent building automation.
The industry research and growth report includes detailed analyses of the competitive landscape of the market and information about key companies, including:
- Aeroqual
- Airthings ASA
- Amphenol Advanced Sensors
- Awair Inc.
- Bacharach Inc.
- Bosch Sensortec GmbH
- CEM Instruments India Pvt. Ltd
- CET Canada Inc.
- Dwyer Instruments LLC
- Extech Instruments
- Fluke Corp.
- GrayWolf Sensing Solutions
- HORIBA Ltd.
- IQAir AG
- Kaiterra
- Kanomax USA Inc.
- NETATMO SAS
- PPM Technology Ltd.
- Rotronic AG
- Vaisala Oyj
Qualitative and quantitative analysis of companies has been conducted to help clients understand the wider business environment as well as the strengths and weaknesses of key industry players. Data is qualitatively analyzed to categorize companies as pure play, category-focused, industry-focused, and diversified; it is quantitatively analyzed to categorize companies as dominant, leading, strong, tentative, and weak.
Recent Development and News in Indoor air quality meters market
- In the Household Appliances industry, the integration of edge artificial intelligence into consumer devices optimized predictive environmental analytics, directly impacting Indoor Air Quality Meters demand by requiring compatible smart building interoperability.
- In the Household Appliances industry, the widespread adoption of unified IoT connectivity standards streamlined smart home automation, directly impacting Indoor Air Quality Meters demand by enabling seamless data exchange with automated thermostats.
- In the Household Appliances industry, stringent energy efficiency regulations implemented under the European Ecodesign framework mandated reduced power consumption, directly impacting Indoor Air Quality Meters demand by accelerating the shift toward microelectromechanical systems.
- In the Household Appliances industry, strategic supply chain realignments to secure reliable semiconductor substrates mitigated severe microchip shortages, directly impacting Indoor Air Quality Meters demand by stabilizing the production of factory calibrated telemetry units.
Dive into Technavio’s robust research methodology, blending expert interviews, extensive data synthesis, and validated models for unparalleled Indoor Air Quality Meters Market insights. See full methodology.
| Market Scope | |
|---|---|
| Page number | 294 |
| Base year | 2025 |
| Historic period | 2020-2024 |
| Forecast period | 2026-2030 |
| Growth momentum & CAGR | Accelerate at a CAGR of 9.1% |
| Market growth 2026-2030 | USD 2729.2 million |
| Market structure | Fragmented |
| YoY growth 2025-2026(%) | 8.2% |
| Key countries | US, Canada, Mexico, Germany, UK, France, Italy, Spain, The Netherlands, China, Japan, India, South Korea, Australia, Indonesia, Brazil, Argentina, Chile, Saudi Arabia, UAE, South Africa, Israel and Turkey |
| Competitive landscape | Leading Companies, Market Positioning of Companies, Competitive Strategies, and Industry Risks |
Research Analyst Overview
- The continuous evolution of the Indoor Air Quality Meters landscape is fundamentally reshaping enterprise infrastructure strategies. Manufacturers are accelerating the integration of localized edge artificial intelligence to deliver predictive environmental analytics directly at the sensor node.
- This transition away from cloud-dependent processing allows smart home automation and commercial real estate platforms to execute rapid signal compensation algorithms, thereby reducing false alarms and unnecessary system activations. By embedding these intelligent microprocessors, enterprise facilities have achieved a 30% reduction in ventilation-related energy waste.
- Consequently, strategic budgeting decisions now heavily prioritize instruments equipped with robust sensor cross sensitivity mitigation and precise carbon dioxide monitoring to align with evolving occupational health safety standards. This shift not only fulfills stringent certification requirements but also modernizes building management networks.
- As organizations face escalating pressure to maintain pristine indoor environments, the strategic deployment of advanced environmental drift mitigation technologies ensures long-term operational resilience and superior compliance tracking.
What are the Key Data Covered in this Indoor Air Quality Meters Market Research and Growth Report?
-
What is the expected growth of the Indoor Air Quality Meters Market between 2026 and 2030?
-
USD 2.73 billion, at a CAGR of 9.1%
-
-
What segmentation does the market report cover?
-
The report is segmented by Product (Fixed, and Portable), End-user (Government, Commercial and residential, Energy and pharmaceuticals, and Others), Technology (Sensors, Data logging, and Transmission technologies) and Geography (North America, Europe, APAC, South America, Middle East and Africa)
-
-
Which regions are analyzed in the report?
-
North America, Europe, APAC, South America and Middle East and Africa
-
-
What are the key growth drivers and market challenges?
-
Proliferation of healthy building standards and workplace wellness frameworks, Severe macro semiconductor deficits and upstream component scarcity
-
-
Who are the major players in the Indoor Air Quality Meters Market?
-
Aeroqual, Airthings ASA, Amphenol Advanced Sensors, Awair Inc., Bacharach Inc., Bosch Sensortec GmbH, CEM Instruments India Pvt. Ltd, CET Canada Inc., Dwyer Instruments LLC, Extech Instruments, Fluke Corp., GrayWolf Sensing Solutions, HORIBA Ltd., IQAir AG, Kaiterra, Kanomax USA Inc., NETATMO SAS, PPM Technology Ltd., Rotronic AG and Vaisala Oyj
-
Market Research Insights
- The Indoor Air Quality Meters sector reflects a fundamental operational shift toward proactive environmental management. Driven by evolving corporate sustainability metrics, property managers are utilizing demand control ventilation to ensure optimal indoor atmospheric conditions. Facilities integrating intelligent building automation report energy consumption reduced by 22% and localized occupancy limits tracking efficiency enhanced by 18%.
- Furthermore, adherence to updated public health guidelines accelerates the implementation of centralized networks, directly improving compliance reporting speed by 30%. This systematic alignment with stringent environmental compliance criteria transforms traditional infrastructure into responsive ecosystems, bridging the gap between mechanical efficiency and human-centric workplace wellness frameworks.
We can help! Our analysts can customize this indoor air quality meters market research report to meet your requirements.
 RIA -
RIA - 
