Industrial Bakery Processing Equipment Market Size 2025-2029
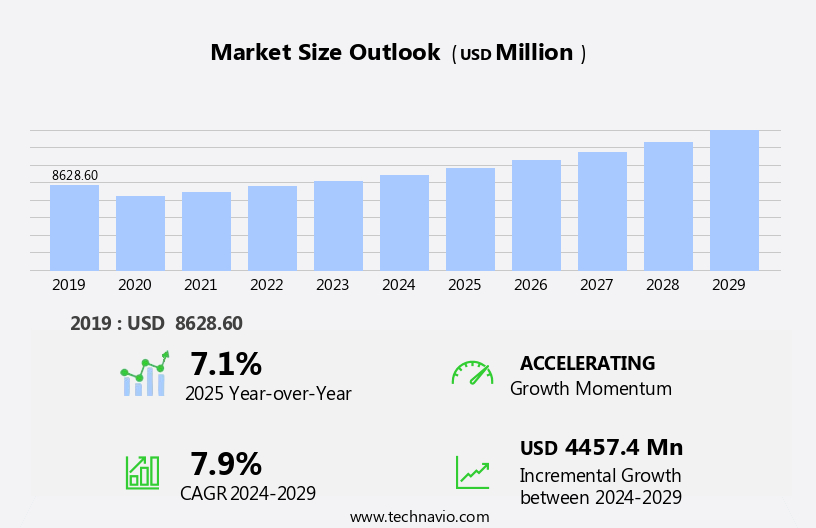
The industrial bakery processing equipment market size is forecast to increase by USD 4.46 billion, at a CAGR of 7.9% between 2024 and 2029. The market is experiencing significant growth, driven by the increasing demand for frozen bakery products.
Major Market Trends & Insights
- North America dominated the market and accounted for a 31% share in 2023.
- The market is expected to grow significantly in North America region as well over the forecast period.
- Based on the End-user, the bakery processing industry segment led the market and was valued at USD 6.84 billion of the global revenue in 2023.
- Based on the Product, the ovens and proofers segment accounted for the largest market revenue share in 2023.
Market Size & Forecast
- 2024 Market Size: USD 9.62 Billion
- Future Opportunities: USD 4.45 Billion
- CAGR (2024-2029): 7.9%
- North America: Largest market in 2023
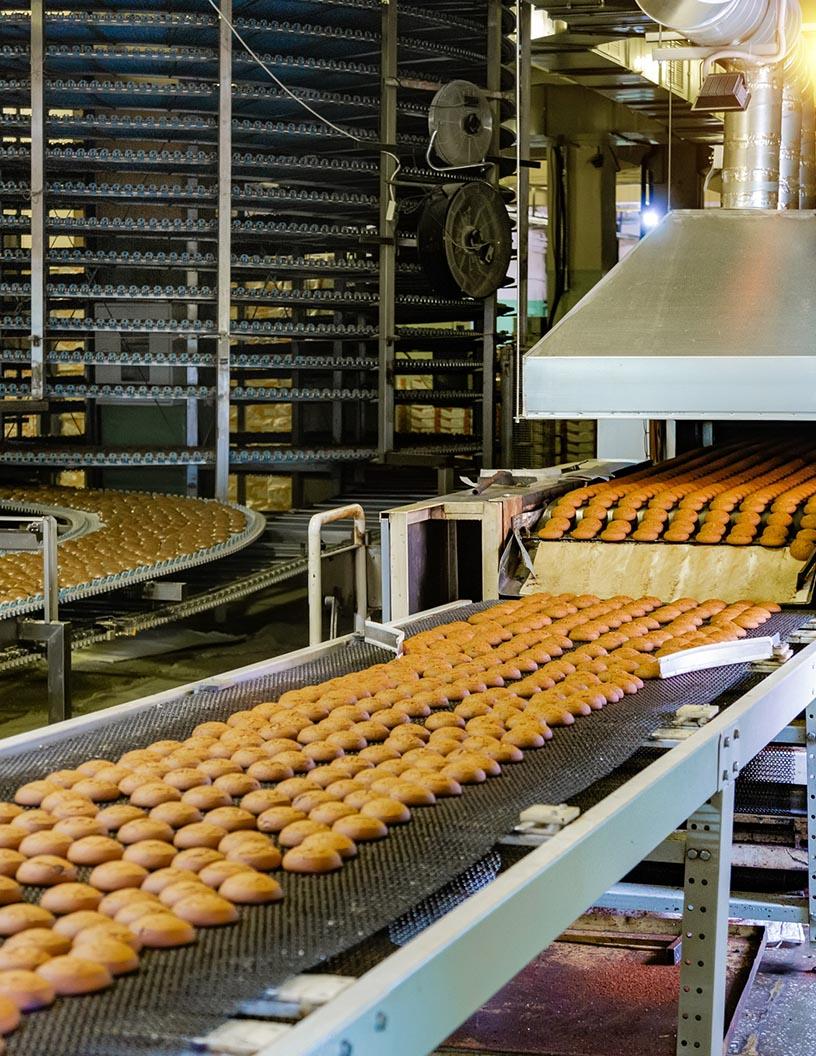
The market is characterized by continuous evolution and dynamic market activities. This sector encompasses a wide range of machinery and technologies designed to enhance the baking process, from recipe management and material selection to high-speed production and product traceability. Food safety remains a top priority, with stringent hygiene standards and technical support ensuring the production of safe and quality baked goods. Baking technology advances, such as temperature control, proofing technology, and energy efficiency, continue to shape the market. Automation level is a significant trend, with automated systems integrating ingredient dispensing, wrapping machines, sheeting machines, material handling, baking time optimization, and process optimization.
What will be the Size of the Industrial Bakery Processing Equipment Market during the forecast period?
Explore in-depth regional segment analysis with market size data - historical 2019-2023 and forecasts 2025-2029 - in the full report.
Request Free Sample
Industrial ovens, baking process control, and quality control systems are also essential components, ensuring consistent and efficient production. The market's unfolding patterns are influenced by various factors, including waste reduction, operator training, packaging equipment, convection ovens, cleaning systems, oven design, rotary rack ovens, icing machines, after-sales service, and spare parts availability. Customizable systems, process automation, production capacity, and lifecycle cost are also crucial considerations for bakery operators. The integration of advanced technologies, such as remote monitoring, humidity control, energy consumption, and safety standards, further enhances the sector's continuous dynamism. Modular systems, dough dividers, weighing systems, dough formulation, batch baking, and ingredient handling are essential elements that contribute to the overall efficiency and productivity of industrial bakeries. The market's evolving nature underscores the importance of staying informed and adaptable to meet the ever-changing demands of the baking industry. The foodservice industry segment is the second largest segment of the end-user and was valued at USD 2.16 billion in 2023.
Consumers' preference for convenient and long-lasting baked goods has led to a surge in production, necessitating advanced processing equipment. Moreover, innovation in the sector continues apace, with new product launches adding to the market's dynamism. However, this market landscape is not without challenges. High energy costs pose a significant obstacle for bakery processors, necessitating energy-efficient solutions to maintain profitability.
To capitalize on market opportunities and navigate challenges effectively, companies must stay informed of consumer trends and invest in energy-efficient technologies. By doing so, they can optimize their operations, enhance product quality, and remain competitive in the evolving the market.
How is this Industrial Bakery Processing Equipment Industry segmented?
The industrial bakery processing equipment industry research report provides comprehensive data (region-wise segment analysis), with forecasts and estimates in "USD million" for the period 2025-2029, as well as historical data from 2019-2023 for the following segments.
- End-user
- Bakery processing industry
- Foodservice industry
- Product
- Ovens and proofers
- Mixers and blenders
- Sheeters and molders
- Dividers and rounders
- Others
- Application
- Bread
- Cookies and biscuits
- Cakes and pastries
- Variant
- Automatic
- Semi-automatic
- Geography
- North America
- US
- Canada
- Europe
- France
- Germany
- Italy
- UK
- APAC
- China
- India
- Japan
- South Korea
- Rest of World (ROW)
- North America
By End-user Insights
The bakery processing industry segment is estimated to witness significant growth during the forecast period. The segment was valued at USD 6.84 billion in 2023. It continued to the largest segment at a CAGR of 5.14%.
In the bakery processing equipment market, recipe management and material selection play crucial roles in creating consistent and high-quality baked goods. Hygiene standards are paramount to maintain food safety and consumer trust. Technical support and baking technology advancements ensure seamless production and optimal baking conditions. Slicing machines, conveyor systems, and temperature control systems facilitate high-speed production and efficient material handling. Proofing technology and waste reduction techniques enhance product quality and reduce costs. Operator training and packaging equipment ensure a skilled workforce and fresh, attractive products. Automated systems, product traceability, and spare parts availability are essential for maintaining production capacity and minimizing downtime.
Decorating systems and customizable systems cater to evolving consumer preferences for diverse and visually appealing bakery items. Process automation and production monitoring optimize baking time and energy consumption. Humidity control, energy efficiency, and safety standards are increasingly prioritized for sustainable and eco-friendly practices. The market is witnessing significant investments in dough dividers, weighing systems, dough formulation, batch baking, and ingredient handling to streamline processes and improve product consistency. Lifecycle cost considerations and food safety regulations drive the adoption of advanced baking technology, such as continuous baking and automation level systems. Ingredient dispensing, wrapping machines, and sheeting machines further enhance production efficiency.
In summary, the bakery processing equipment market is evolving to meet the demands of changing consumer preferences and sustainability concerns. Innovations in technology, automation, and eco-friendly practices are driving growth and shaping the future of the industry.
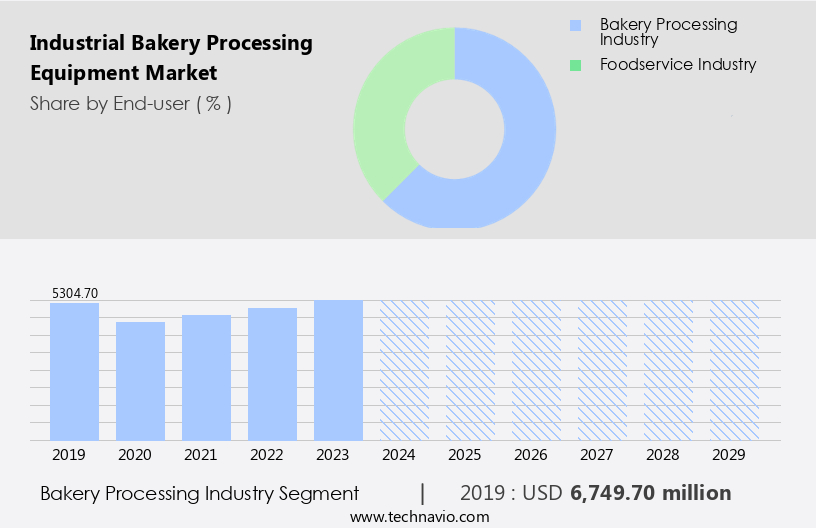
The Bakery processing industry segment was valued at USD 6.75 billion in 2019 and showed a gradual increase during the forecast period.
Regional Analysis
North America is estimated to contribute 31% to the growth of the global market during the forecast period.Technavio’s analysts have elaborately explained the regional trends and drivers that shape the market during the forecast period.
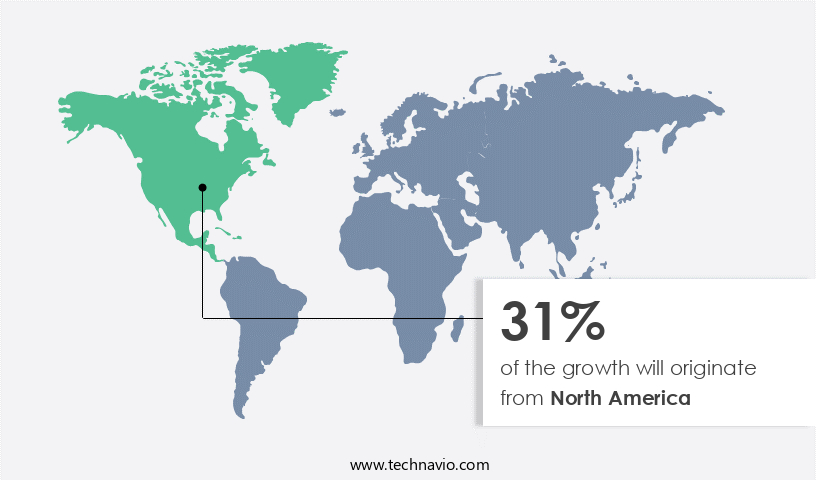
The European bakery industry experiences growth due to the rising preference for convenient food among consumers, particularly the younger generation. Data suggests that the future opportunities for growth in the North America region estimates to be around USD 4.45 billion. Major European countries, including Germany, Italy, and France, have a substantial presence in this sector. Key players in the market in Europe include GEA Group Aktiengesellschaft, Buhler AG, FRITSCH Bakery Technologies GmbH and Co. KG, and Colom Bakery Equipment SL. The market is witnessing mergers and acquisitions as companies strive to strengthen their positions. Innovation is a significant focus, with the development of advanced equipment to boost productivity and reduce carbon emissions. Hygiene standards, technical support, and after-sales service are essential considerations for equipment providers.
Baking technology, including temperature control, proofing technology, and convection ovens, is continually advancing. Customizable systems, process automation, and production capacity are other trends. Energy efficiency, mixing technology, and production monitoring are crucial factors, as is ensuring food safety and continuous baking. Automation level, ingredient handling, and dough formulation are also key elements. The lifecycle cost, including spare parts availability and remote monitoring, is a significant concern for bakeries. The market is also witnessing the integration of humidity control, energy consumption, safety standards, and modular systems. Dough dividers, weighing systems, and batch baking are essential processes, as is optimizing baking time and processes.
Industrial ovens and baking process control are critical components of the baking industry. Quality control is a priority, with an emphasis on waste reduction, operator training, and packaging equipment.
Market Dynamics
Our researchers analyzed the data with 2024 as the base year, along with the key drivers, trends, and challenges. A holistic analysis of drivers will help companies refine their marketing strategies to gain a competitive advantage.
The global bakery processing equipment market size and forecast projects growth, driven by bakery equipment market trends 2025-2029. B2B bakery equipment solutions leverage automated baking technologies for efficiency. Bakery equipment market growth opportunities 2025 include equipment for artisan bakeries and industrial baking ovens, meeting demand. Bakery equipment supply chain software optimizes operations, while bakery equipment market competitive analysis highlights key manufacturers. Sustainable baking practices align with eco-friendly bakery trends. Bakery equipment regulations 2025-2029 shapes equipment demand in Europe 2025. High-throughput bakery solutions and premium bakery equipment insights boost adoption. Equipment for bread production and customized bakery designs target niches. Bakery equipment market challenges and solutions address energy costs, with direct procurement strategies for bakery equipment and equipment pricing optimization enhancing profitability. Data-driven bakery equipment analytics and smart baking trends drive innovation.
What are the key market drivers leading to the rise in the adoption of Industrial Bakery Processing Equipment Industry?
- The surge in consumer preference for convenient and time-saving frozen bakery products is the primary factor fueling market growth in this sector.
- The market has experienced significant growth due to the increasing demand for convenience food products, particularly frozen bakery items. These products, including frozen bread, cakes, pastries, pizza crust, waffles, donuts, and cookies, are gaining popularity in various markets such as China, India, Brazil, Argentina, and Malaysia. Consumers' changing lifestyles and dietary habits have contributed to the acceptance of food products with long shelf lives, enhanced taste, and quality. To meet the rising demand, industrial bakery processing equipment manufacturers focus on energy efficiency, advanced mixing technology, production monitoring, remote monitoring, humidity control, and safety standards.
- Energy consumption is a critical factor in the bakery industry, and energy-efficient equipment is increasingly preferred to reduce operational costs and minimize environmental impact. Modular systems, dough dividers, and weighing systems are essential components of industrial bakery processing equipment, ensuring consistent dough formulation and batch baking. Ingredient handling is another crucial aspect of the market. Proper handling and accurate measurement of ingredients are necessary to maintain the desired product quality and consistency. Lifecycle cost is a significant consideration for bakery businesses, and equipment with lower maintenance requirements and longer lifespan are preferred. Overall, the market is driven by the increasing demand for frozen bakery products, energy efficiency, and advanced technology.
What are the market trends shaping the Industrial Bakery Processing Equipment Industry?
- The introduction of new products is a current market trend that reflects innovation and progress in various industries. Companies continually strive to meet consumer demands and stay competitive by launching new offerings.
- In the market, companies are investing in innovation to gain a competitive edge. Strategic partnerships and acquisitions are common strategies used to expand client base and gain access to new production techniques. These collaborations enable market players to enhance their product offerings and improve operational efficiency. Advanced food safety measures, continuous baking, and automation level are key trends shaping the market. Automated ingredient dispensing, wrapping machines, sheeting machines, and material handling systems are essential components of modern industrial bakery processing equipment.
- Baking time optimization and process optimization are crucial for maintaining quality and increasing productivity. Industrial ovens and baking process control systems ensure consistent results and adherence to food safety standards. Market participants prioritize quality control to meet consumer demands for safe and high-quality baked goods.
What challenges does the Industrial Bakery Processing Equipment Industry face during its growth?
- The escalating energy costs pose a significant challenge to the growth of the bakery processing industry.
- The industrial bakery processing market relies heavily on energy-intensive equipment for various operations, including mixing, proving, baking, and cooling. Electricity is a significant energy source, with motors and drives used extensively during mixing processes. Industrial ovens, which consume a large amount of energy in the form of both electricity and gas, are crucial for baking operations. For instance, indirect ovens have a weekly specific energy consumption (SEC) of approximately 590 kWh/ton for gas and over 30 kWh/ton for electricity. Hygiene standards are paramount in the bakery industry, necessitating frequent cleaning and sanitization of equipment. Recipe management systems enable bakeries to maintain consistency in their products while reducing waste through optimal material selection and high-speed production.
- Technical support and baking technology advancements, such as proofing technology and temperature control systems, contribute to increased efficiency and productivity. Conveyor systems and slicing machines facilitate the seamless transfer and processing of dough and baked goods. Waste reduction is a priority, with operator training and packaging equipment essential for minimizing waste and ensuring product quality. Overall, the industrial bakery processing market is driven by the need for energy efficiency, hygiene standards, and advanced technology to meet consumer demand for high-quality, consistent bakery products.
Exclusive Customer Landscape
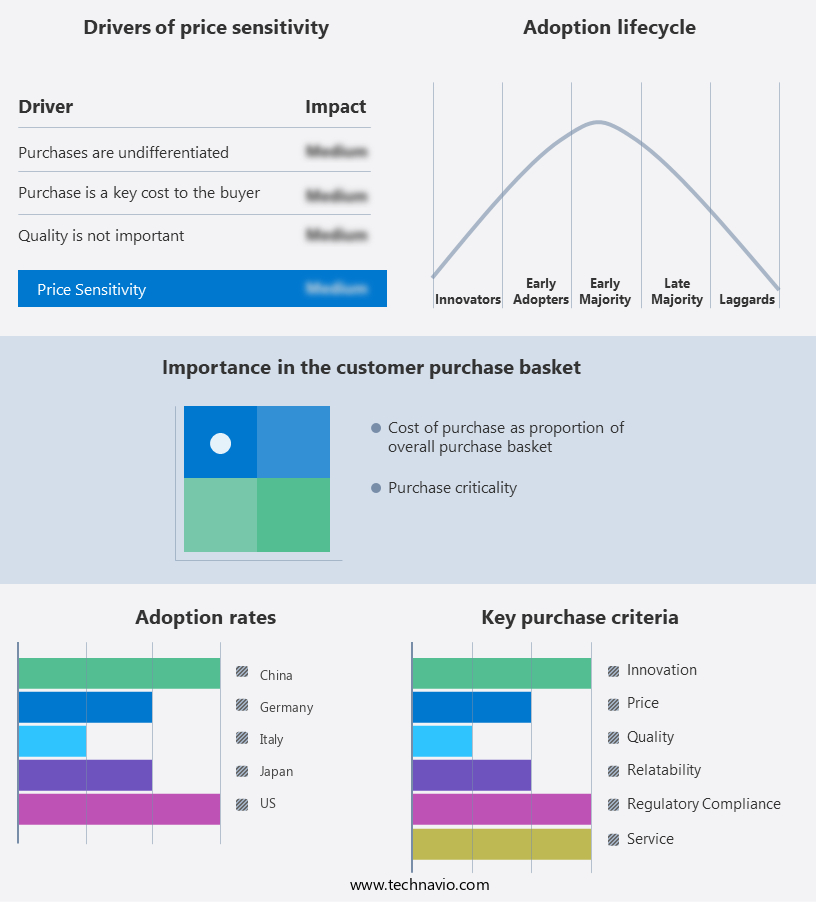
The industrial bakery processing equipment market forecasting report includes the adoption lifecycle of the market, covering from the innovator’s stage to the laggard’s stage. It focuses on adoption rates in different regions based on penetration. Furthermore, the industrial bakery processing equipment market report also includes key purchase criteria and drivers of price sensitivity to help companies evaluate and develop their market growth analysis strategies.
Customer Landscape
Key Companies & Market Insights
Companies are implementing various strategies, such as strategic alliances, industrial bakery processing equipment market forecast, partnerships, mergers and acquisitions, geographical expansion, and product/service launches, to enhance their presence in the industry.
Ali Group S.r.l. - This industrial bakery equipment provider showcases the versatile Revent Deck oven, available in various sizes. Its three-zone heat regulation enables customized baking profiles for optimal product results.
The industry research and growth report includes detailed analyses of the competitive landscape of the market and information about key companies, including:
- Ali Group S.r.l.
- Allied Bakery Equipment and Machine Co. Inc.
- ANKO Food Machine Co. Ltd.
- Buhler AG
- Colom Bakery Equipment SL
- Erika record LLC
- FRITSCH Bakery Technologies GmbH and Co. KG
- GEA Group AG
- Gemini Bakery Equipment Co.
- Global Bakery Solutions Ltd.
- Heat and Control Inc.
- Industrial Bakery Line Srl
- John Bean Technologies Corp.
- Koenig Maschinen GmbH
- Markel Corp.
- Peerless Food Equipment
- Rademaker BV
- Schenck Process Holding GmbH
- The Middleby Corp.
- Wilkinson Baking Co.
Qualitative and quantitative analysis of companies has been conducted to help clients understand the wider business environment as well as the strengths and weaknesses of key industry players. Data is qualitatively analyzed to categorize companies as pure play, category-focused, industry-focused, and diversified; it is quantitatively analyzed to categorize companies as dominant, leading, strong, tentative, and weak.
Recent Development and News in Industrial Bakery Processing Equipment Market
- In January 2024, Bakery Equipment Solutions (BES), a leading industrial bakery processing equipment provider, announced the launch of its innovative line of energy-efficient bread processing systems at the International Baking Industry Exposition (IBIE). These new systems, which include proofers, sheeters, and ovens, are designed to reduce energy consumption by up to 30% compared to traditional equipment (BES press release).
- In March 2024, GEA Group, a global technology leader in food processing and pharmaceutical technologies, acquired Provisur Technologies, a prominent supplier of automated food processing equipment. This acquisition strengthened GEA's position in the market and expanded its product portfolio (GEA Group press release).
- In May 2024, the European Union (EU) approved new regulations to reduce the use of trans fats in bakery products. This regulatory change created a significant demand for industrial bakery processing equipment capable of producing trans-fat-free baked goods (European Commission press release).
- In April 2025, JBT Corporation, a leading technology solutions provider to the food processing industry, announced a strategic partnership with Bühler AG, a global leader in process engineering solutions for the food industry. This collaboration aimed to develop advanced automation and digitalization solutions for industrial bakery processing equipment (JBT Corporation press release).
Research Analyst Overview
- The market is characterized by the integration of advanced technologies to optimize baking processes and enhance productivity. Cloud connectivity enables real-time data analytics, allowing bakeries to monitor and manage their operations more efficiently. Software integration facilitates parts management, error detection, and recipe scaling, reducing downtime and improving product consistency. Industrial refrigerators ensure ingredient quality and water usage efficiency, while automation software and baking controls streamline production. Planetary mixers and spiral mixers are essential for producing uniform dough, while digital twin technology enables predictive modeling and maintenance scheduling. Process sensors monitor water usage, temperature, and other critical parameters, ensuring consistent baking results.
- Bread slicers, cookie depositors, and cake decorators contribute to the final product presentation, enhancing customer appeal. Remote diagnostics and error detection enable timely identification and resolution of issues, minimizing downtime and reducing maintenance costs. Waste management solutions optimize resource utilization and minimize environmental impact. Recipe optimization and process simulation tools enable bakeries to experiment with new formulations and processes, driving innovation and differentiation.
Dive into Technavio’s robust research methodology, blending expert interviews, extensive data synthesis, and validated models for unparalleled Industrial Bakery Processing Equipment Market insights. See full methodology.
|
Market Scope |
|
|
Report Coverage |
Details |
|
Page number |
238 |
|
Base year |
2024 |
|
Historic period |
2019-2023 |
|
Forecast period |
2025-2029 |
|
Growth momentum & CAGR |
Accelerate at a CAGR of 7.9% |
|
Market growth 2025-2029 |
USD 4457.4 million |
|
Market structure |
Fragmented |
|
YoY growth 2024-2025(%) |
7.1 |
|
Key countries |
US, Italy, China, Germany, France, Canada, UK, South Korea, Japan, and India |
|
Competitive landscape |
Leading Companies, Market Positioning of Companies, Competitive Strategies, and Industry Risks |
What are the Key Data Covered in this Industrial Bakery Processing Equipment Market Research and Growth Report?
- CAGR of the Industrial Bakery Processing Equipment industry during the forecast period
- Detailed information on factors that will drive the growth and forecasting between 2025 and 2029
- Precise estimation of the size of the market and its contribution of the industry in focus to the parent market
- Accurate predictions about upcoming growth and trends and changes in consumer behaviour
- Growth of the market across Europe, North America, APAC, South America, and Middle East and Africa
- Thorough analysis of the market’s competitive landscape and detailed information about companies
- Comprehensive analysis of factors that will challenge the industrial bakery processing equipment market growth of industry companies
We can help! Our analysts can customize this industrial bakery processing equipment market research report to meet your requirements.
 RIA -
RIA - 
