Industrial Burner Market Analysis, Size, and Forecast 2026-2030: APAC (China, India, and Japan), Europe (Germany, UK, and France), North America (US, Canada, and Mexico), South America (Brazil, Argentina, and Colombia), Middle East and Africa (Saudi Arabia, UAE, and South Africa), and Rest of World (ROW)

Industrial Burner Market Analysis, Size, and Forecast 2026-2030:
APAC (China, India, and Japan), Europe (Germany, UK, and France), North America (US, Canada, and Mexico), South America (Brazil, Argentina, and Colombia), Middle East and Africa (Saudi Arabia, UAE, and South Africa), and Rest of World (ROW)

Published: Dec 2025 312 Pages SKU: IRTNTR40779

Market Overview at a Glance

$2.24 B
Market Opportunity
6%
CAGR 2025 - 2030
42.9%
APAC Growth
$2.79 B
Gas burner segment 2024

Industrial Burner Market Size 2026-2030

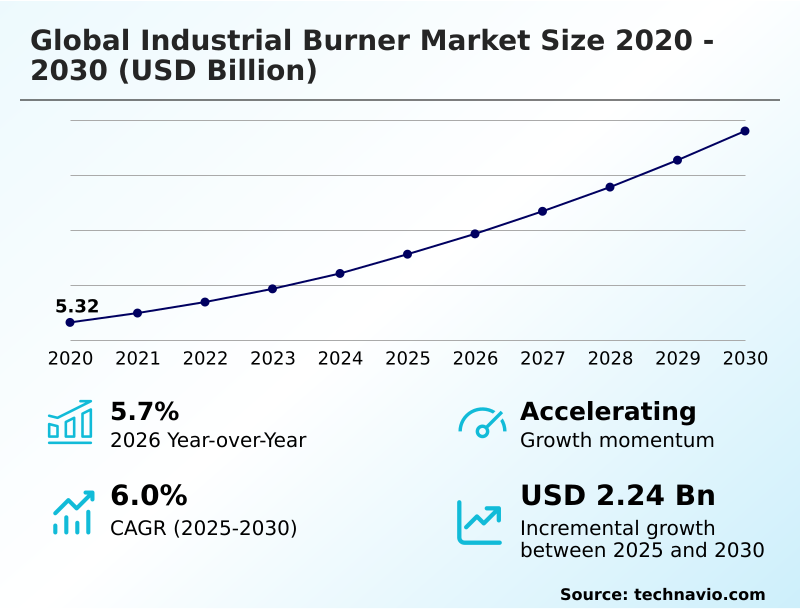
The industrial burner market size is valued to increase by USD 2.24 billion, at a CAGR of 6% from 2025 to 2030. Accelerating transition to hydrogen and low-carbon fuel capabilities will drive the industrial burner market.

Major Market Trends & Insights

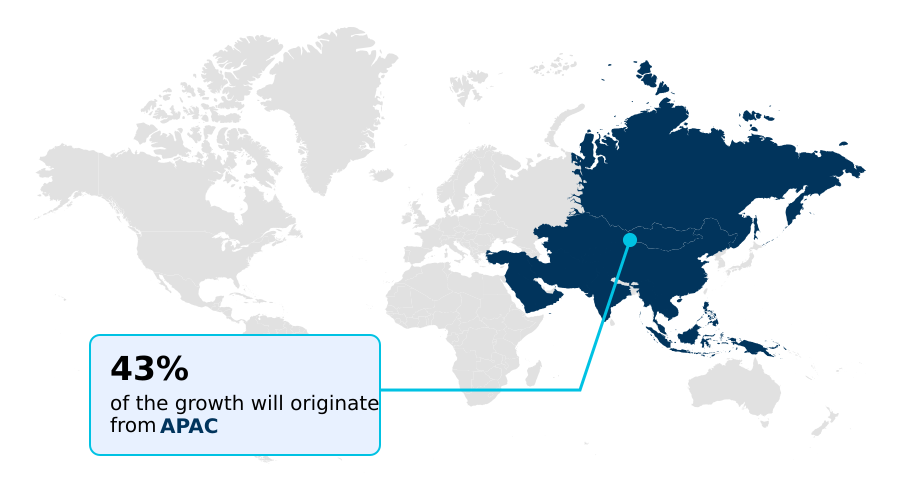
  • APAC dominated the market and accounted for a 42.9% growth during the forecast period.
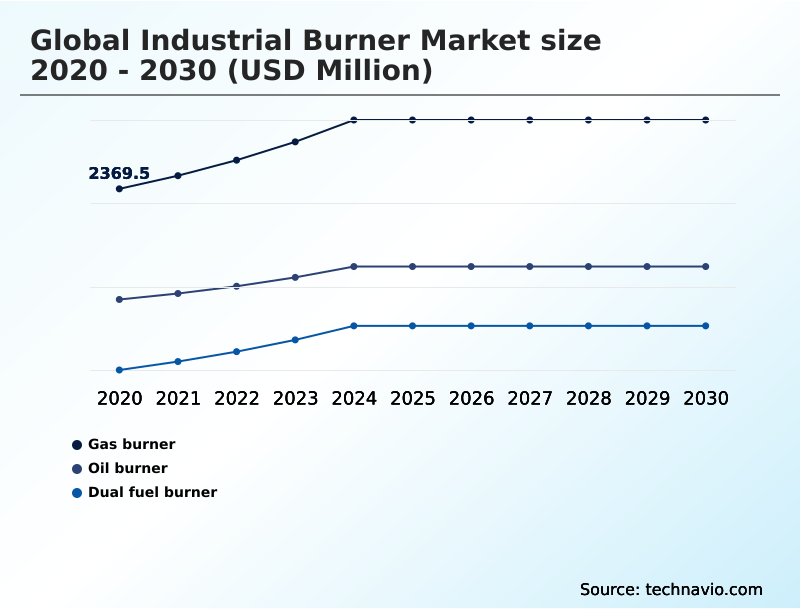
  • By Fuel Type - Gas burner segment was valued at USD 2.79 billion in 2024
  • By End-user - Food and beverages segment accounted for the largest market revenue share in 2024

Market Size & Forecast

  • Market Opportunities: USD 3.48 billion
  • Market Future Opportunities: USD 2.24 billion
  • CAGR from 2025 to 2030 : 6%

Market Summary

  • The industrial burner market is undergoing a significant transformation, driven by the dual imperatives of decarbonization and operational efficiency. The strategic shift away from traditional fossil fuels is creating robust demand for advanced industrial burner systems capable of handling hydrogen blends and other low-carbon alternatives.
  • This transition is underpinned by stringent global regulations mandating lower emissions of NOx and CO2, compelling operators in energy-intensive sectors to invest in retrofits or new combustion technologies. Concurrently, the integration of IIoT and smart burner management systems is revolutionizing process control, enabling predictive maintenance and real-time optimization of fuel-to-air ratios.
  • For instance, a chemical processing facility can leverage this digital oversight not only to ensure compliance with new emission limits, which can be 15% tighter than previous standards, but also to dynamically adjust for fuel composition variability, thereby maintaining thermal efficiency and minimizing unplanned downtime.
  • The convergence of these technological and regulatory forces defines the competitive landscape, rewarding innovation in fuel flexibility and digital intelligence for every industrial burner.

What will be the Size of the Industrial Burner Market during the forecast period?

Get Key Insights on Market Forecast (PDF) Request Free Sample

How is the Industrial Burner Market Segmented?

The industrial burner industry research report provides comprehensive data (region-wise segment analysis), with forecasts and estimates in "USD million" for the period 2026-2030, as well as historical data from 2020-2024 for the following segments.

  • Fuel type
    • Gas burner
    • Oil burner
    • Dual fuel burner
  • End-user
    • Food and beverages
    • Chemicals and petrochemicals
    • Power generation
    • Pulp and paper
    • Others
  • Type
    • Regenerative burners
    • Radiant tube burners
    • Self-recuperative burners
    • Air staged burners
    • Others
  • Geography
    • APAC
      • China
      • India
      • Japan
    • Europe
      • Germany
      • UK
      • France
    • North America
      • US
      • Canada
      • Mexico
    • South America
      • Brazil
      • Argentina
      • Colombia
    • Middle East and Africa
      • Saudi Arabia
      • UAE
      • South Africa
    • Rest of World (ROW)

By Fuel Type Insights

The gas burner segment is estimated to witness significant growth during the forecast period.

The gas burner segment represents the core of the industrial heating process, driven by the wide availability and cost-effectiveness of natural gas.

This segment is evolving rapidly, moving beyond conventional combustion efficiency to embrace advanced technologies like regenerative burners and radiant tube burners.

A key development is the engineering of systems compatible with hydrogen blends, a transition critical for decarbonizing thermal processing units.

For example, successful trials integrating a 30% hydrogen blend have been achieved without compromising the precise fuel-to-air ratio needed for sensitive applications. Innovations in flameless oxidation and oxy-fuel combustion are also gaining traction, enabling higher thermal efficiency and lower emissions.

These advancements, including high-velocity burners and thermal oxidizer systems, are crucial for maintaining performance while meeting stricter environmental standards.

Request Free Sample

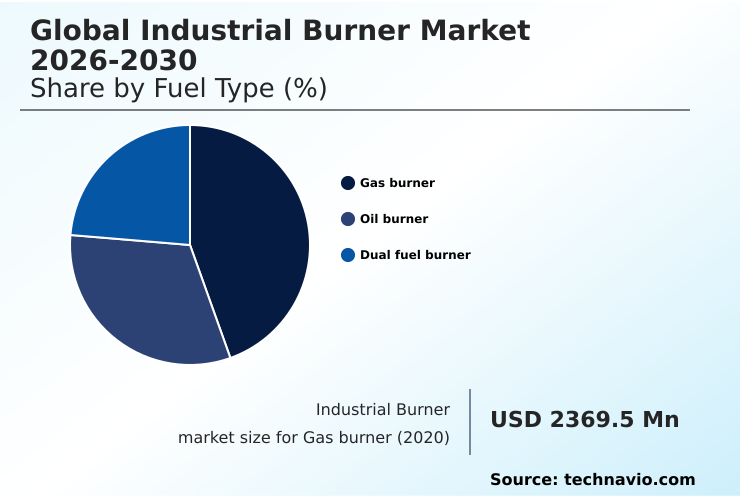
The Gas burner segment was valued at USD 2.79 billion in 2024 and showed a gradual increase during the forecast period.

Request Free Sample

Regional Analysis

APAC is estimated to contribute 42.9% to the growth of the global market during the forecast period.Technavio’s analysts have elaborately explained the regional trends and drivers that shape the market during the forecast period.

See How Industrial Burner Market Demand is Rising in APAC Request Free Sample

The geographic landscape is dominated by APAC, which accounts for over 42% of the market's incremental growth, fueled by industrial expansion and stringent environmental policies.

In China, government mandates are driving a large-scale transition from coal to gas, boosting demand for high-efficiency process heaters and systems featuring flue gas recirculation for particulate matter reduction.

Meanwhile, advanced economies like Japan and South Korea are pioneering the use of hydrogen for industrial steam generation and supporting grid stability.

This regional focus on decarbonization and waste heat recovery is accelerating the adoption of advanced technologies such as recuperative burners.

These systems are critical for enhancing furnace temperature uniformity in applications ranging from metal processing to lime kilns and duct burner installations, positioning the region as a key hub for combustion technology innovation.

Market Dynamics

Our researchers analyzed the data with 2025 as the base year, along with the key drivers, trends, and challenges. A holistic analysis of drivers will help companies refine their marketing strategies to gain a competitive advantage.

  • Achieving higher operational performance in the global industrial burner market 2026-2030 requires a multi-faceted approach. Improving thermal efficiency in industrial furnaces is a primary objective, addressed by technologies like regenerative burners in the steel industry. For the refining sector, adopting low nox burner technology for refineries is no longer optional but a regulatory necessity.
  • A significant long-term trend involves hydrogen co-firing in gas turbine burners, a key step toward decarbonization. This transition is supported by the use of a digital twin for industrial combustion optimization, which allows operators to model performance and prevent issues before they occur. However, technical hurdles remain, particularly the challenges of hydrogen combustion flashback.
  • For legacy systems, ultra-low nox retrofitting for industrial boilers offers a viable compliance pathway, with some facilities achieving emission reductions of over 50% compared to older equipment. Integrating iiot in burner management systems provides the data-driven control needed to manage these advanced systems.
  • As the industry moves forward, advanced burner designs for alternative fuels and the strategic use of a dual fuel burner for energy security will define market leadership, alongside specialized equipment like self-recuperative burners for forge furnaces, air staged burners for pollution control, and both radiant tube burners for heat treating and high-velocity burners for temperature uniformity.
  • This is complemented by the niche use of flat flame burners for glass melting.

What are the key market drivers leading to the rise in the adoption of Industrial Burner Industry?

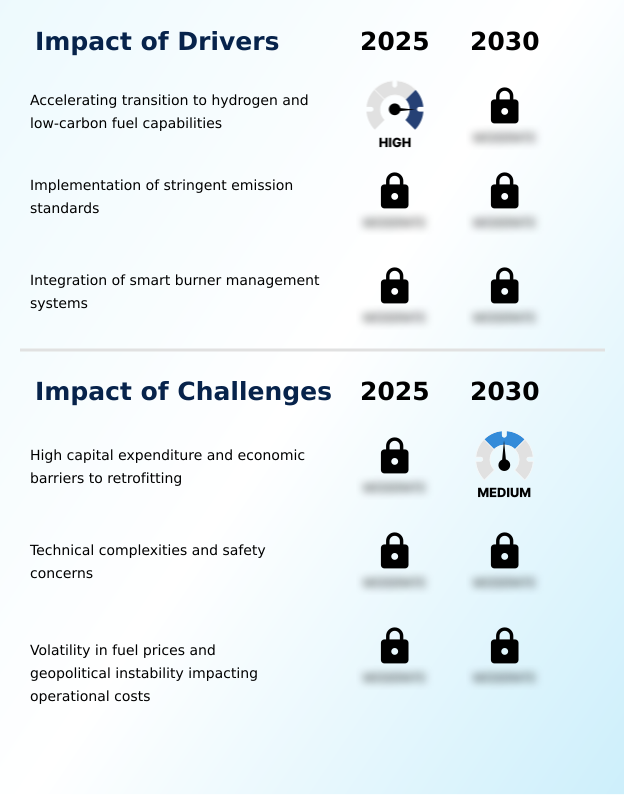
  • The accelerating transition to hydrogen and other low-carbon fuel capabilities serves as a primary driver for the industrial burner market.

  • Market growth is primarily driven by stringent emission compliance mandates and the economic benefits of enhanced efficiency.
  • The global push for cleaner air has made low-nox burners and advanced combustion control essential, with new regulations forcing facilities to upgrade to technologies that meet tighter burner safety standards.
  • This regulatory pressure is a key factor behind investments in systems offering superior air-fuel ratio control. Furthermore, the integration of iiot in burner management systems provides a significant driver for operational expenditure reduction.
  • By leveraging a digital twin for industrial combustion optimization, operators can fine-tune processes to achieve fuel savings of 5-10%.
  • The strategic importance of fuel flexibility also propels demand, as industries seek to mitigate risks associated with volatile energy prices through versatile combustion solutions and process heat optimization.

What are the market trends shaping the Industrial Burner Industry?

  • A defining market trend is the accelerated adoption of alternative fuels in industrial combustion. This shift is driven by the industry-wide push toward decarbonization and energy diversification.

  • Key market trends are centered on sustainability and digitalization, pushing the industry toward cleaner and more intelligent operations. The adoption of alternative fuel combustion is accelerating, driven by the development of hydrogen-ready burners and systems capable of utilizing biofuels, which necessitates advanced staged combustion techniques.
  • For instance, facilities are achieving an 85% carbon capture readiness by pairing these systems with specialized carbon capture integration technologies. Simultaneously, the rise of smart combustion is transforming maintenance and efficiency, with predictive maintenance algorithms reducing unplanned downtime by up to 25%. This digital layer enables precise control over the turn-down ratio, a crucial factor in the decarbonization of heat.
  • The market is also seeing a surge in ultra-low nox retrofitting, a direct response to stricter environmental mandates, all managed through advanced burner management systems.

What challenges does the Industrial Burner Industry face during its growth?

  • High initial capital expenditure and significant economic barriers associated with retrofitting existing systems present a key challenge to market growth.

  • Significant challenges constrain market adoption, led by the high costs of combustion system retrofits and technical complexities. The capital required for upgrading to high-efficiency systems can be a major barrier for energy-intensive industries, with project costs often exceeding initial estimates by 15-20% due to integration requirements.
  • Moreover, the transition to hydrogen presents formidable engineering hurdles, particularly related to the challenges of hydrogen combustion flashback and the need for new premix technology to ensure stable operation. Ensuring consistent atomization efficiency with alternative fuels remains a concern for high-temperature applications.
  • These technical issues, combined with the need for specialized hardware like advanced flame scanners and durable dual fuel burner components, can slow the pace of decarbonization. The market must also address the complexities of handling varied fuel sources, including syngas burners, to improve overall thermal efficiency.

Exclusive Technavio Analysis on Customer Landscape

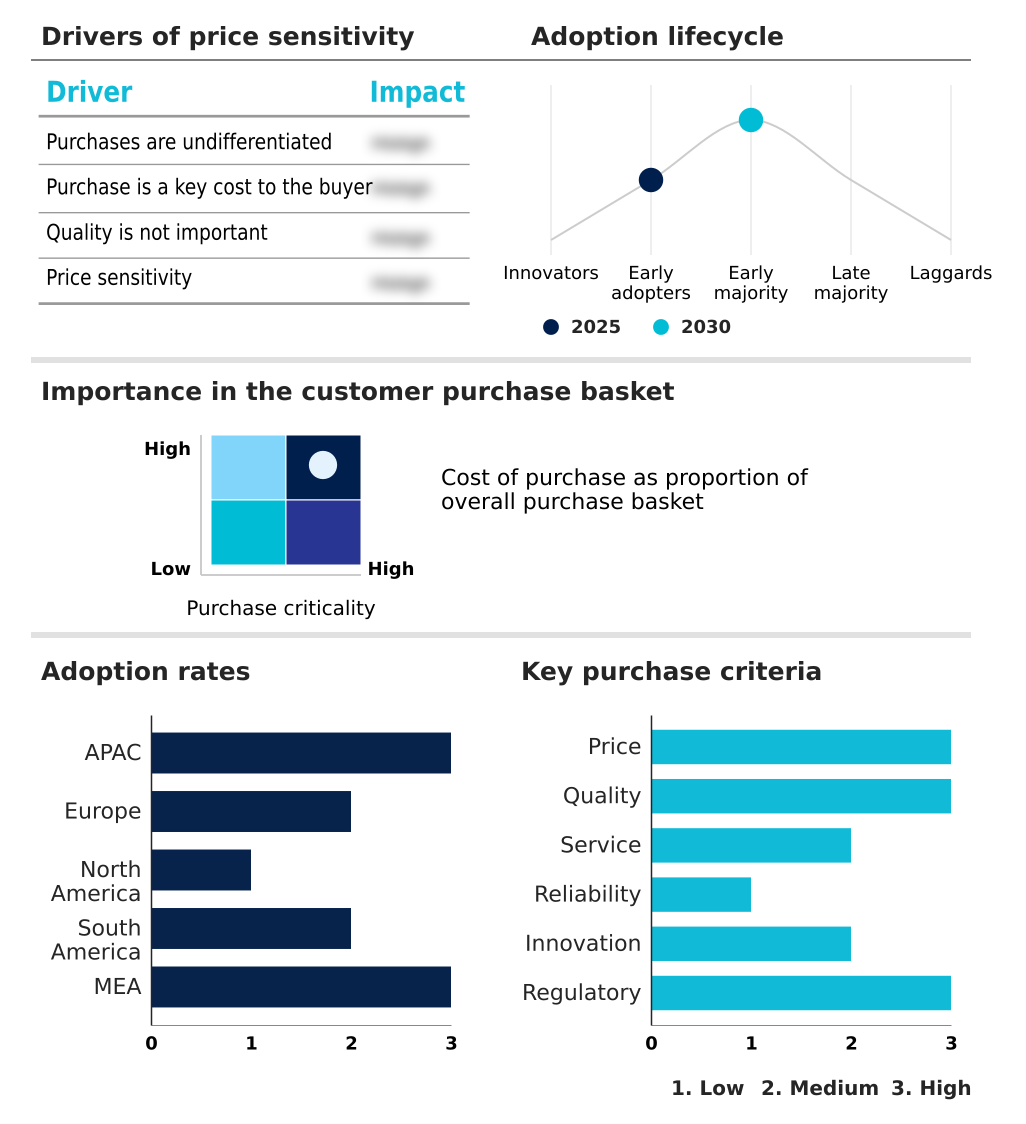
The industrial burner market forecasting report includes the adoption lifecycle of the market, covering from the innovator’s stage to the laggard’s stage. It focuses on adoption rates in different regions based on penetration. Furthermore, the industrial burner market report also includes key purchase criteria and drivers of price sensitivity to help companies evaluate and develop their market growth analysis strategies.

Customer Landscape of Industrial Burner Industry

Competitive Landscape

Companies are implementing various strategies, such as strategic alliances, industrial burner market forecast, partnerships, mergers and acquisitions, geographical expansion, and product/service launches, to enhance their presence in the industry.

AGF Burner Inc. - Provides advanced fluidized bed combustion systems and burners, specializing in solutions for the pulp, paper, and waste-to-energy industries.

The industry research and growth report includes detailed analyses of the competitive landscape of the market and information about key companies, including:

  • AGF Burner Inc.
  • Andritz AG
  • Babcock Wanson
  • Baltur Spa
  • Bentone
  • Bloom Engineering Inc.
  • Forbes Marshall Pvt. Ltd.
  • Honeywell International Inc.
  • IBS GmbH
  • John Wood Group PLC
  • Koch Industries Inc.
  • Limpsfield CE Co. Ltd.
  • Mitsubishi Heavy Ltd.
  • Oilon Group Oy
  • OXILON Pvt. Ltd.
  • Power Flame Inc.
  • Rapidflame Ltd.
  • Selas Heat Technology Co.
  • Weishaupt Corp.
  • Wesman Group

Qualitative and quantitative analysis of companies has been conducted to help clients understand the wider business environment as well as the strengths and weaknesses of key industry players. Data is qualitatively analyzed to categorize companies as pure play, category-focused, industry-focused, and diversified; it is quantitatively analyzed to categorize companies as dominant, leading, strong, tentative, and weak.

Recent Development and News in Industrial burner market

  • In August 2024, Siemens Energy launched a new digital twin platform for industrial combustion systems, allowing operators to simulate and optimize burner performance.
  • In January 2025, Oilon Group Oy introduced a new series of industrial heat pumps integrated with hybrid burner systems for comprehensive district heating solutions.
  • In February 2025, Fives Group secured a major contract to retrofit a glass manufacturing facility with burners capable of switching between natural gas and hydrogen.
  • In May 2025, Koch Engineered Solutions released a new line of process burners engineered to meet sub-5 ppm NOx requirements without external catalytic reduction systems.

Dive into Technavio’s robust research methodology, blending expert interviews, extensive data synthesis, and validated models for unparalleled Industrial Burner Market insights. See full methodology.

Market Scope
Page number 312
Base year 2025
Historic period 2020-2024
Forecast period 2026-2030
Growth momentum & CAGR Accelerate at a CAGR of 6%
Market growth 2026-2030 USD 2239.0 million
Market structure Fragmented
YoY growth 2025-2026(%) 5.7%
Key countries China, India, Japan, South Korea, Australia, Indonesia, Germany, UK, France, Italy, Spain, The Netherlands, US, Canada, Mexico, Brazil, Argentina, Colombia, Saudi Arabia, UAE, South Africa, Israel and Turkey
Competitive landscape Leading Companies, Market Positioning of Companies, Competitive Strategies, and Industry Risks

Request Free Sample

Research Analyst Overview

  • The industrial burner market is advancing beyond simple combustion, now defined by a sophisticated interplay of thermal efficiency and environmental stewardship. The development of low-nox burners, regenerative burners, and specialized radiant tube burners is central to this evolution, enabling industries to meet tightening emission standards.
  • The integration of a dedicated burner management systems, complete with advanced combustion control and a reliable flame scanner, has become standard for ensuring safety and optimizing performance. Boardroom decisions are increasingly influenced by the need to invest in hydrogen-ready burners and oxy-fuel combustion technologies as part of long-term decarbonization strategies.
  • Innovations such as flameless oxidation and advanced premix technology are critical for handling alternative fuels. This technological pivot is evident in the adoption of staged combustion techniques, which can reduce NOx emissions by up to 60%.
  • The market also sees continued demand for high-velocity burners, recuperative burners, and application-specific hardware like duct burners and syngas burners, all designed to improve atomization efficiency and accommodate a precise air-fuel ratio control, from process heaters and lime kilns to complex thermal oxidizer units.

What are the Key Data Covered in this Industrial Burner Market Research and Growth Report?

  • What is the expected growth of the Industrial Burner Market between 2026 and 2030?

    • USD 2.24 billion, at a CAGR of 6%

  • What segmentation does the market report cover?

    • The report is segmented by Fuel Type (Gas burner, Oil burner, and Dual fuel burner), End-user (Food and beverages, Chemicals and petrochemicals, Power generation, Pulp and paper, and Others), Type (Regenerative burners, Radiant tube burners, Self-recuperative burners, Air staged burners, and Others) and Geography (APAC, Europe, North America, South America, Middle East and Africa)

  • Which regions are analyzed in the report?

    • APAC, Europe, North America, South America and Middle East and Africa

  • What are the key growth drivers and market challenges?

    • Accelerating transition to hydrogen and low-carbon fuel capabilities, High capital expenditure and economic barriers to retrofitting

  • Who are the major players in the Industrial Burner Market?

    • AGF Burner Inc., Andritz AG, Babcock Wanson, Baltur Spa, Bentone, Bloom Engineering Inc., Forbes Marshall Pvt. Ltd., Honeywell International Inc., IBS GmbH, John Wood Group PLC, Koch Industries Inc., Limpsfield CE Co. Ltd., Mitsubishi Heavy Ltd., Oilon Group Oy, OXILON Pvt. Ltd., Power Flame Inc., Rapidflame Ltd., Selas Heat Technology Co., Weishaupt Corp. and Wesman Group

Market Research Insights

  • Market dynamics are increasingly shaped by the pursuit of operational expenditure reduction and enhanced thermal efficiency. The integration of smart combustion systems, for instance, has enabled select refineries to achieve a 4% reduction in fuel consumption through automated air-fuel ratio trimming.
  • Similarly, a focus on fuel flexibility is critical for energy-intensive industries, with advanced dual fuel burner systems allowing for dynamic switching based on real-time energy prices. This strategic approach to process heat optimization and emission compliance underscores the shift from standalone hardware to intelligent, integrated thermal processing units, where predictive maintenance algorithms can cut unplanned downtime by over 20%.

We can help! Our analysts can customize this industrial burner market research report to meet your requirements.

Get in touch

1. Executive Summary

1.1 Market overview

Executive Summary - Chart on Market Overview
Executive Summary - Data Table on Market Overview
Executive Summary - Chart on Global Market Characteristics
Executive Summary - Chart on Market by Geography
Executive Summary - Chart on Market Segmentation by Fuel Type
Executive Summary - Chart on Market Segmentation by End-user
Executive Summary - Chart on Market Segmentation by Type
Executive Summary - Chart on Incremental Growth
Executive Summary - Data Table on Incremental Growth
Executive Summary - Chart on Company Market Positioning

2. Technavio Analysis

2.1 Analysis of price sensitivity, lifecycle, customer purchase basket, adoption rates, and purchase criteria

2.2 Criticality of inputs and Factors of differentiation

Chart on Overview on criticality of inputs and factors of differentiation

2.3 Factors of disruption

Chart on Overview on factors of disruption

2.4 Impact of drivers and challenges

Chart on Impact of drivers and challenges in 2025 and 2030

3. Market Landscape

3.1 Market ecosystem

Chart on Parent Market
Data Table on - Parent Market

3.2 Market characteristics

Chart on Market characteristics analysis

3.3 Value chain analysis

Chart on Value chain analysis

4. Market Sizing

4.1 Market definition

Data Table on Offerings of companies included in the market definition

4.2 Market segment analysis

Market segments

4.3 Market size 2025

4.4 Market outlook: Forecast for 2025-2030

Chart on Global - Market size and forecast 2025-2030 ($ million)
Data Table on Global - Market size and forecast 2025-2030 ($ million)
Chart on Global Market: Year-over-year growth 2025-2030 (%)
Data Table on Global Market: Year-over-year growth 2025-2030 (%)

5. Historic Market Size

5.1 Global Industrial Burner Market 2020 - 2024

Historic Market Size - Data Table on Global Industrial Burner Market 2020 - 2024 ($ million)

5.2 Fuel Type segment analysis 2020 - 2024

Historic Market Size - Fuel Type Segment 2020 - 2024 ($ million)

5.3 End-user segment analysis 2020 - 2024

Historic Market Size - End-user Segment 2020 - 2024 ($ million)

5.4 Type segment analysis 2020 - 2024

Historic Market Size - Type Segment 2020 - 2024 ($ million)

5.5 Geography segment analysis 2020 - 2024

Historic Market Size - Geography Segment 2020 - 2024 ($ million)

5.6 Country segment analysis 2020 - 2024

Historic Market Size - Country Segment 2020 - 2024 ($ million)

6. Qualitative Analysis

6.1 Impact of AI on the Global Industrial Burner Market

7. Five Forces Analysis

7.1 Five forces summary

Five forces analysis - Comparison between 2025 and 2030

7.2 Bargaining power of buyers

Bargaining power of buyers - Impact of key factors 2025 and 2030

7.3 Bargaining power of suppliers

Bargaining power of suppliers - Impact of key factors in 2025 and 2030

7.4 Threat of new entrants

Threat of new entrants - Impact of key factors in 2025 and 2030

7.5 Threat of substitutes

Threat of substitutes - Impact of key factors in 2025 and 2030

7.6 Threat of rivalry

Threat of rivalry - Impact of key factors in 2025 and 2030

7.7 Market condition

Chart on Market condition - Five forces 2025 and 2030

8. Market Segmentation by Fuel Type

8.1 Market segments

Chart on Fuel Type - Market share 2025-2030 (%)
Data Table on Fuel Type - Market share 2025-2030 (%)

8.2 Comparison by Fuel Type

Chart on Comparison by Fuel Type
Data Table on Comparison by Fuel Type

8.3 Gas burner - Market size and forecast 2025-2030

Chart on Gas burner - Market size and forecast 2025-2030 ($ million)
Data Table on Gas burner - Market size and forecast 2025-2030 ($ million)
Chart on Gas burner - Year-over-year growth 2025-2030 (%)
Data Table on Gas burner - Year-over-year growth 2025-2030 (%)

8.4 Oil burner - Market size and forecast 2025-2030

Chart on Oil burner - Market size and forecast 2025-2030 ($ million)
Data Table on Oil burner - Market size and forecast 2025-2030 ($ million)
Chart on Oil burner - Year-over-year growth 2025-2030 (%)
Data Table on Oil burner - Year-over-year growth 2025-2030 (%)

8.5 Dual fuel burner - Market size and forecast 2025-2030

Chart on Dual fuel burner - Market size and forecast 2025-2030 ($ million)
Data Table on Dual fuel burner - Market size and forecast 2025-2030 ($ million)
Chart on Dual fuel burner - Year-over-year growth 2025-2030 (%)
Data Table on Dual fuel burner - Year-over-year growth 2025-2030 (%)

8.6 Market opportunity by Fuel Type

Market opportunity by Fuel Type ($ million)
Data Table on Market opportunity by Fuel Type ($ million)

9. Market Segmentation by End-user

9.1 Market segments

Chart on End-user - Market share 2025-2030 (%)
Data Table on End-user - Market share 2025-2030 (%)

9.2 Comparison by End-user

Chart on Comparison by End-user
Data Table on Comparison by End-user

9.3 Food and beverages - Market size and forecast 2025-2030

Chart on Food and beverages - Market size and forecast 2025-2030 ($ million)
Data Table on Food and beverages - Market size and forecast 2025-2030 ($ million)
Chart on Food and beverages - Year-over-year growth 2025-2030 (%)
Data Table on Food and beverages - Year-over-year growth 2025-2030 (%)

9.4 Chemicals and petrochemicals - Market size and forecast 2025-2030

Chart on Chemicals and petrochemicals - Market size and forecast 2025-2030 ($ million)
Data Table on Chemicals and petrochemicals - Market size and forecast 2025-2030 ($ million)
Chart on Chemicals and petrochemicals - Year-over-year growth 2025-2030 (%)
Data Table on Chemicals and petrochemicals - Year-over-year growth 2025-2030 (%)

9.5 Power generation - Market size and forecast 2025-2030

Chart on Power generation - Market size and forecast 2025-2030 ($ million)
Data Table on Power generation - Market size and forecast 2025-2030 ($ million)
Chart on Power generation - Year-over-year growth 2025-2030 (%)
Data Table on Power generation - Year-over-year growth 2025-2030 (%)

9.6 Pulp and paper - Market size and forecast 2025-2030

Chart on Pulp and paper - Market size and forecast 2025-2030 ($ million)
Data Table on Pulp and paper - Market size and forecast 2025-2030 ($ million)
Chart on Pulp and paper - Year-over-year growth 2025-2030 (%)
Data Table on Pulp and paper - Year-over-year growth 2025-2030 (%)

9.7 Others - Market size and forecast 2025-2030

Chart on Others - Market size and forecast 2025-2030 ($ million)
Data Table on Others - Market size and forecast 2025-2030 ($ million)
Chart on Others - Year-over-year growth 2025-2030 (%)
Data Table on Others - Year-over-year growth 2025-2030 (%)

9.8 Market opportunity by End-user

Market opportunity by End-user ($ million)
Data Table on Market opportunity by End-user ($ million)

10. Market Segmentation by Type

10.1 Market segments

Chart on Type - Market share 2025-2030 (%)
Data Table on Type - Market share 2025-2030 (%)

10.2 Comparison by Type

Chart on Comparison by Type
Data Table on Comparison by Type

10.3 Regenerative burners - Market size and forecast 2025-2030

Chart on Regenerative burners - Market size and forecast 2025-2030 ($ million)
Data Table on Regenerative burners - Market size and forecast 2025-2030 ($ million)
Chart on Regenerative burners - Year-over-year growth 2025-2030 (%)
Data Table on Regenerative burners - Year-over-year growth 2025-2030 (%)

10.4 Radiant tube burners - Market size and forecast 2025-2030

Chart on Radiant tube burners - Market size and forecast 2025-2030 ($ million)
Data Table on Radiant tube burners - Market size and forecast 2025-2030 ($ million)
Chart on Radiant tube burners - Year-over-year growth 2025-2030 (%)
Data Table on Radiant tube burners - Year-over-year growth 2025-2030 (%)

10.5 Self-recuperative burners - Market size and forecast 2025-2030

Chart on Self-recuperative burners - Market size and forecast 2025-2030 ($ million)
Data Table on Self-recuperative burners - Market size and forecast 2025-2030 ($ million)
Chart on Self-recuperative burners - Year-over-year growth 2025-2030 (%)
Data Table on Self-recuperative burners - Year-over-year growth 2025-2030 (%)

10.6 Air staged burners - Market size and forecast 2025-2030

Chart on Air staged burners - Market size and forecast 2025-2030 ($ million)
Data Table on Air staged burners - Market size and forecast 2025-2030 ($ million)
Chart on Air staged burners - Year-over-year growth 2025-2030 (%)
Data Table on Air staged burners - Year-over-year growth 2025-2030 (%)

10.7 Others - Market size and forecast 2025-2030

Chart on Others - Market size and forecast 2025-2030 ($ million)
Data Table on Others - Market size and forecast 2025-2030 ($ million)
Chart on Others - Year-over-year growth 2025-2030 (%)
Data Table on Others - Year-over-year growth 2025-2030 (%)

10.8 Market opportunity by Type

Market opportunity by Type ($ million)
Data Table on Market opportunity by Type ($ million)

11. Customer Landscape

11.1 Customer landscape overview

Analysis of price sensitivity, lifecycle, customer purchase basket, adoption rates, and purchase criteria

12. Geographic Landscape

12.1 Geographic segmentation

Chart on Market share by geography 2025-2030 (%)
Data Table on Market share by geography 2025-2030 (%)

12.2 Geographic comparison

Chart on Geographic comparison
Data Table on Geographic comparison

12.3 APAC - Market size and forecast 2025-2030

Chart on APAC - Market size and forecast 2025-2030 ($ million)
Data Table on APAC - Market size and forecast 2025-2030 ($ million)
Chart on APAC - Year-over-year growth 2025-2030 (%)
Data Table on APAC - Year-over-year growth 2025-2030 (%)
Chart on Regional Comparison - APAC
Data Table on Regional Comparison - APAC

12.3.1 China - Market size and forecast 2025-2030

Chart on China - Market size and forecast 2025-2030 ($ million)
Data Table on China - Market size and forecast 2025-2030 ($ million)
Chart on China - Year-over-year growth 2025-2030 (%)
Data Table on China - Year-over-year growth 2025-2030 (%)

12.3.2 India - Market size and forecast 2025-2030

Chart on India - Market size and forecast 2025-2030 ($ million)
Data Table on India - Market size and forecast 2025-2030 ($ million)
Chart on India - Year-over-year growth 2025-2030 (%)
Data Table on India - Year-over-year growth 2025-2030 (%)

12.3.3 Japan - Market size and forecast 2025-2030

Chart on Japan - Market size and forecast 2025-2030 ($ million)
Data Table on Japan - Market size and forecast 2025-2030 ($ million)
Chart on Japan - Year-over-year growth 2025-2030 (%)
Data Table on Japan - Year-over-year growth 2025-2030 (%)

12.3.4 South Korea - Market size and forecast 2025-2030

Chart on South Korea - Market size and forecast 2025-2030 ($ million)
Data Table on South Korea - Market size and forecast 2025-2030 ($ million)
Chart on South Korea - Year-over-year growth 2025-2030 (%)
Data Table on South Korea - Year-over-year growth 2025-2030 (%)

12.3.5 Australia - Market size and forecast 2025-2030

Chart on Australia - Market size and forecast 2025-2030 ($ million)
Data Table on Australia - Market size and forecast 2025-2030 ($ million)
Chart on Australia - Year-over-year growth 2025-2030 (%)
Data Table on Australia - Year-over-year growth 2025-2030 (%)

12.3.6 Indonesia - Market size and forecast 2025-2030

Chart on Indonesia - Market size and forecast 2025-2030 ($ million)
Data Table on Indonesia - Market size and forecast 2025-2030 ($ million)
Chart on Indonesia - Year-over-year growth 2025-2030 (%)
Data Table on Indonesia - Year-over-year growth 2025-2030 (%)

12.4 Europe - Market size and forecast 2025-2030

Chart on Europe - Market size and forecast 2025-2030 ($ million)
Data Table on Europe - Market size and forecast 2025-2030 ($ million)
Chart on Europe - Year-over-year growth 2025-2030 (%)
Data Table on Europe - Year-over-year growth 2025-2030 (%)
Chart on Regional Comparison - Europe
Data Table on Regional Comparison - Europe

12.4.1 Germany - Market size and forecast 2025-2030

Chart on Germany - Market size and forecast 2025-2030 ($ million)
Data Table on Germany - Market size and forecast 2025-2030 ($ million)
Chart on Germany - Year-over-year growth 2025-2030 (%)
Data Table on Germany - Year-over-year growth 2025-2030 (%)

12.4.2 UK - Market size and forecast 2025-2030

Chart on UK - Market size and forecast 2025-2030 ($ million)
Data Table on UK - Market size and forecast 2025-2030 ($ million)
Chart on UK - Year-over-year growth 2025-2030 (%)
Data Table on UK - Year-over-year growth 2025-2030 (%)

12.4.3 France - Market size and forecast 2025-2030

Chart on France - Market size and forecast 2025-2030 ($ million)
Data Table on France - Market size and forecast 2025-2030 ($ million)
Chart on France - Year-over-year growth 2025-2030 (%)
Data Table on France - Year-over-year growth 2025-2030 (%)

12.4.4 Italy - Market size and forecast 2025-2030

Chart on Italy - Market size and forecast 2025-2030 ($ million)
Data Table on Italy - Market size and forecast 2025-2030 ($ million)
Chart on Italy - Year-over-year growth 2025-2030 (%)
Data Table on Italy - Year-over-year growth 2025-2030 (%)

12.4.5 Spain - Market size and forecast 2025-2030

Chart on Spain - Market size and forecast 2025-2030 ($ million)
Data Table on Spain - Market size and forecast 2025-2030 ($ million)
Chart on Spain - Year-over-year growth 2025-2030 (%)
Data Table on Spain - Year-over-year growth 2025-2030 (%)

12.4.6 The Netherlands - Market size and forecast 2025-2030

Chart on The Netherlands - Market size and forecast 2025-2030 ($ million)
Data Table on The Netherlands - Market size and forecast 2025-2030 ($ million)
Chart on The Netherlands - Year-over-year growth 2025-2030 (%)
Data Table on The Netherlands - Year-over-year growth 2025-2030 (%)

12.5 North America - Market size and forecast 2025-2030

Chart on North America - Market size and forecast 2025-2030 ($ million)
Data Table on North America - Market size and forecast 2025-2030 ($ million)
Chart on North America - Year-over-year growth 2025-2030 (%)
Data Table on North America - Year-over-year growth 2025-2030 (%)
Chart on Regional Comparison - North America
Data Table on Regional Comparison - North America

12.5.1 US - Market size and forecast 2025-2030

Chart on US - Market size and forecast 2025-2030 ($ million)
Data Table on US - Market size and forecast 2025-2030 ($ million)
Chart on US - Year-over-year growth 2025-2030 (%)
Data Table on US - Year-over-year growth 2025-2030 (%)

12.5.2 Canada - Market size and forecast 2025-2030

Chart on Canada - Market size and forecast 2025-2030 ($ million)
Data Table on Canada - Market size and forecast 2025-2030 ($ million)
Chart on Canada - Year-over-year growth 2025-2030 (%)
Data Table on Canada - Year-over-year growth 2025-2030 (%)

12.5.3 Mexico - Market size and forecast 2025-2030

Chart on Mexico - Market size and forecast 2025-2030 ($ million)
Data Table on Mexico - Market size and forecast 2025-2030 ($ million)
Chart on Mexico - Year-over-year growth 2025-2030 (%)
Data Table on Mexico - Year-over-year growth 2025-2030 (%)

12.6 South America - Market size and forecast 2025-2030

Chart on South America - Market size and forecast 2025-2030 ($ million)
Data Table on South America - Market size and forecast 2025-2030 ($ million)
Chart on South America - Year-over-year growth 2025-2030 (%)
Data Table on South America - Year-over-year growth 2025-2030 (%)
Chart on Regional Comparison - South America
Data Table on Regional Comparison - South America

12.6.1 Brazil - Market size and forecast 2025-2030

Chart on Brazil - Market size and forecast 2025-2030 ($ million)
Data Table on Brazil - Market size and forecast 2025-2030 ($ million)
Chart on Brazil - Year-over-year growth 2025-2030 (%)
Data Table on Brazil - Year-over-year growth 2025-2030 (%)

12.6.2 Argentina - Market size and forecast 2025-2030

Chart on Argentina - Market size and forecast 2025-2030 ($ million)
Data Table on Argentina - Market size and forecast 2025-2030 ($ million)
Chart on Argentina - Year-over-year growth 2025-2030 (%)
Data Table on Argentina - Year-over-year growth 2025-2030 (%)

12.6.3 Colombia - Market size and forecast 2025-2030

Chart on Colombia - Market size and forecast 2025-2030 ($ million)
Data Table on Colombia - Market size and forecast 2025-2030 ($ million)
Chart on Colombia - Year-over-year growth 2025-2030 (%)
Data Table on Colombia - Year-over-year growth 2025-2030 (%)

12.7 Middle East and Africa - Market size and forecast 2025-2030

Chart on Middle East and Africa - Market size and forecast 2025-2030 ($ million)
Data Table on Middle East and Africa - Market size and forecast 2025-2030 ($ million)
Chart on Middle East and Africa - Year-over-year growth 2025-2030 (%)
Data Table on Middle East and Africa - Year-over-year growth 2025-2030 (%)
Chart on Regional Comparison - Middle East and Africa
Data Table on Regional Comparison - Middle East and Africa

12.7.1 Saudi Arabia - Market size and forecast 2025-2030

Chart on Saudi Arabia - Market size and forecast 2025-2030 ($ million)
Data Table on Saudi Arabia - Market size and forecast 2025-2030 ($ million)
Chart on Saudi Arabia - Year-over-year growth 2025-2030 (%)
Data Table on Saudi Arabia - Year-over-year growth 2025-2030 (%)

12.7.2 UAE - Market size and forecast 2025-2030

Chart on UAE - Market size and forecast 2025-2030 ($ million)
Data Table on UAE - Market size and forecast 2025-2030 ($ million)
Chart on UAE - Year-over-year growth 2025-2030 (%)
Data Table on UAE - Year-over-year growth 2025-2030 (%)

12.7.3 South Africa - Market size and forecast 2025-2030

Chart on South Africa - Market size and forecast 2025-2030 ($ million)
Data Table on South Africa - Market size and forecast 2025-2030 ($ million)
Chart on South Africa - Year-over-year growth 2025-2030 (%)
Data Table on South Africa - Year-over-year growth 2025-2030 (%)

12.7.4 Israel - Market size and forecast 2025-2030

Chart on Israel - Market size and forecast 2025-2030 ($ million)
Data Table on Israel - Market size and forecast 2025-2030 ($ million)
Chart on Israel - Year-over-year growth 2025-2030 (%)
Data Table on Israel - Year-over-year growth 2025-2030 (%)

12.7.5 Turkey - Market size and forecast 2025-2030

Chart on Turkey - Market size and forecast 2025-2030 ($ million)
Data Table on Turkey - Market size and forecast 2025-2030 ($ million)
Chart on Turkey - Year-over-year growth 2025-2030 (%)
Data Table on Turkey - Year-over-year growth 2025-2030 (%)

12.8 Market opportunity by geography

Market opportunity by geography ($ million)
Data Tables on Market opportunity by geography ($ million)

13. Drivers, Challenges, and Opportunity

13.1 Market drivers

Accelerating transition to hydrogen and low-carbon fuel capabilities
Implementation of stringent emission standards
Integration of smart burner management systems

13.2 Market challenges

High capital expenditure and economic barriers to retrofitting
Technical complexities and safety concerns
Volatility in fuel prices and geopolitical instability impacting operational costs

13.3 Impact of drivers and challenges

Impact of drivers and challenges in 2025 and 2030

13.4 Market opportunities

Acceleration of alternative fuel adoption in industrial combustion
Integration of Industrial Internet of Things (IIoT)
Strict regulatory compliance and ultra-low NOx retrofitting

14. Competitive Landscape

14.1 Overview

14.2

Overview on criticality of inputs and factors of differentiation

14.3 Landscape disruption

Overview on factors of disruption

14.4 Industry risks

Impact of key risks on business

15. Competitive Analysis

15.1 Companies profiled

Companies covered

15.2 Company ranking index

15.3 Market positioning of companies

Matrix on companies position and classification

15.4 AGF Burner Inc.

AGF Burner Inc. - Overview
AGF Burner Inc. - Product / Service
AGF Burner Inc. - Key offerings
SWOT

15.5 Andritz AG

Andritz AG - Overview
Andritz AG - Business segments
Andritz AG - Key news
Andritz AG - Key offerings
Andritz AG - Segment focus
SWOT

15.6 Babcock Wanson

Babcock Wanson - Overview
Babcock Wanson - Product / Service
Babcock Wanson - Key offerings
SWOT

15.7 Baltur Spa

Baltur Spa - Overview
Baltur Spa - Product / Service
Baltur Spa - Key offerings
SWOT

15.8 Bloom Engineering Inc.

Bloom Engineering Inc. - Overview
Bloom Engineering Inc. - Product / Service
Bloom Engineering Inc. - Key offerings
SWOT

15.9 Honeywell International Inc.

Honeywell International Inc. - Overview
Honeywell International Inc. - Business segments
Honeywell International Inc. - Key news
Honeywell International Inc. - Key offerings
Honeywell International Inc. - Segment focus
SWOT

15.10 IBS GmbH

IBS GmbH - Overview
IBS GmbH - Product / Service
IBS GmbH - Key offerings
SWOT

15.11 John Wood Group PLC

John Wood Group PLC - Overview
John Wood Group PLC - Business segments
John Wood Group PLC - Key offerings
John Wood Group PLC - Segment focus
SWOT

15.12 Koch Industries Inc.

Koch Industries Inc. - Overview
Koch Industries Inc. - Product / Service
Koch Industries Inc. - Key offerings
SWOT

15.13 Limpsfield CE Co. Ltd.

Limpsfield CE Co. Ltd. - Overview
Limpsfield CE Co. Ltd. - Product / Service
Limpsfield CE Co. Ltd. - Key offerings
SWOT

15.14 Mitsubishi Heavy Ltd.

Mitsubishi Heavy Ltd. - Overview
Mitsubishi Heavy Ltd. - Business segments
Mitsubishi Heavy Ltd. - Key news
Mitsubishi Heavy Ltd. - Key offerings
Mitsubishi Heavy Ltd. - Segment focus
SWOT

15.15 Oilon Group Oy

Oilon Group Oy - Overview
Oilon Group Oy - Product / Service
Oilon Group Oy - Key offerings
SWOT

15.16 OXILON Pvt. Ltd.

OXILON Pvt. Ltd. - Overview
OXILON Pvt. Ltd. - Product / Service
OXILON Pvt. Ltd. - Key offerings
SWOT

15.17 Rapidflame Ltd.

Rapidflame Ltd. - Overview
Rapidflame Ltd. - Product / Service
Rapidflame Ltd. - Key offerings
SWOT

15.18 Weishaupt Corp.

Weishaupt Corp. - Overview
Weishaupt Corp. - Product / Service
Weishaupt Corp. - Key offerings
SWOT

16. Appendix

16.1 Scope of the report

Market definition
Objectives
Notes and caveats

16.2 Inclusions and exclusions checklist

Inclusions checklist
Exclusions checklist

16.3 Currency conversion rates for US$

16.4 Research methodology

16.5 Data procurement

Information sources

16.6 Data validation

16.7 Validation techniques employed for market sizing

16.8 Data synthesis

16.9 360 degree market analysis

16.10 List of abbreviations

Research Methodology

Technavio presents a detailed picture of the market by way of study, synthesis, and summation of data from multiple sources. The analysts have presented the various facets of the market with a particular focus on identifying the key industry influencers. The data thus presented is comprehensive, reliable, and the result of extensive research, both primary and secondary.

INFORMATION SOURCES

Primary sources

  • Manufacturers and suppliers
  • Channel partners
  • Industry experts
  • Strategic decision makers

Secondary sources

  • Industry journals and periodicals
  • Government data
  • Financial reports of key industry players
  • Historical data
  • Press releases

DATA ANALYSIS

Data Synthesis

  • Collation of data
  • Estimation of key figures
  • Analysis of derived insights

Data Validation

  • Triangulation with data models
  • Reference against proprietary databases
  • Corroboration with industry experts

REPORT WRITING

Qualitative

  • Market drivers
  • Market challenges
  • Market trends
  • Five forces analysis

Quantitative

  • Market size and forecast
  • Market segmentation
  • Geographical insights
  • Competitive landscape

Interested in this report?

Get your sample now to see our research methodology and insights!

Download Now

Frequently Asked Questions

Industrial Burner market growth will increase by USD 2239.0 million during 2026-2030.

The Industrial Burner market is expected to grow at a CAGR of 6% during 2026-2030.

Industrial Burner market is segmented by Fuel type (Gas burner, Oil burner, Dual fuel burner) End-user (Food and beverages, Chemicals and petrochemicals, Power generation, Pulp and paper, Others) Type (Regenerative burners, Radiant tube burners, Self-recuperative burners, Air staged burners, Others)

AGF Burner Inc., Andritz AG, Babcock Wanson, Baltur Spa, Bentone, Bloom Engineering Inc., Forbes Marshall Pvt. Ltd., Honeywell International Inc., IBS GmbH, John Wood Group PLC, Koch Industries Inc., Limpsfield CE Co. Ltd., Mitsubishi Heavy Ltd., Oilon Group Oy, OXILON Pvt. Ltd., Power Flame Inc., Rapidflame Ltd., Selas Heat Technology Co., Weishaupt Corp., Wesman Group are a few of the key vendors in the Industrial Burner market.

APAC will register the highest growth rate of 42.9% among the other regions. Therefore, the Industrial Burner market in APAC is expected to garner significant business opportunities for the vendors during the forecast period.

China, India, Japan, South Korea, Australia, Indonesia, Germany, UK, France, Italy, Spain, The Netherlands, US, Canada, Mexico, Brazil, Argentina, Colombia, Saudi Arabia, UAE, South Africa, Israel, Turkey

  • Accelerating transition to hydrogen and low-carbon fuel capabilities is the driving factor this market.

The Industrial Burner market vendors should focus on grabbing business opportunities from the Fuel type segment as it accounted for the largest market share in the base year.