Industrial Cleaning Services Market Analysis, Size, and Forecast 2026-2030: APAC (China, India, and Japan), North America (US, Canada, and Mexico), Europe (Germany, UK, and France), South America (Brazil, Argentina, and Colombia), Middle East and Africa (Saudi Arabia, UAE, and South Africa), and Rest of World (ROW)

Industrial Cleaning Services Market Analysis, Size, and Forecast 2026-2030:
APAC (China, India, and Japan), North America (US, Canada, and Mexico), Europe (Germany, UK, and France), South America (Brazil, Argentina, and Colombia), Middle East and Africa (Saudi Arabia, UAE, and South Africa), and Rest of World (ROW)

Published: Mar 2026 322 Pages SKU: IRTNTR70062

Market Overview at a Glance

$20.49 B
Market Opportunity
6.1%
CAGR 2025 - 2030
50.2%
APAC Growth
$26.76 B
Equipment cleaning segment 2024

Industrial Cleaning Services Market Size 2026-2030

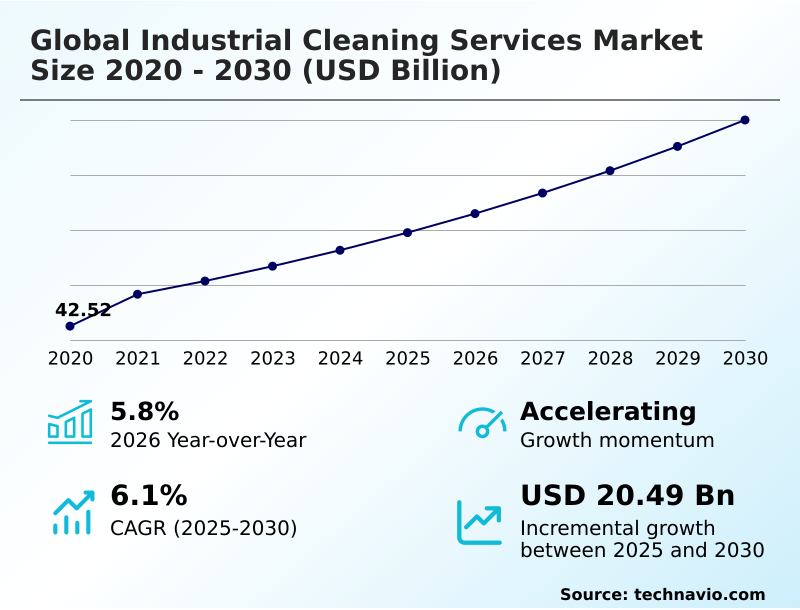
The industrial cleaning services market size is valued to increase by USD 20.49 billion, at a CAGR of 6.1% from 2025 to 2030. Stringent regulatory frameworks and heightened compliance mandates will drive the industrial cleaning services market.

Major Market Trends & Insights

  • APAC dominated the market and accounted for a 50.2% growth during the forecast period.
  • By Application - Equipment cleaning segment was valued at USD 26.76 billion in 2024
  • By End-user - Manufacturing and commercial offices segment accounted for the largest market revenue share in 2024

Market Size & Forecast

  • Market Opportunities: USD 37.49 billion
  • Market Future Opportunities: USD 20.49 billion
  • CAGR from 2025 to 2030 : 6.1%

Market Summary

  • The industrial cleaning services market is evolving from a basic operational cost into a strategic component of risk management and value creation. This shift is driven by stringent regulatory pressures and a corporate focus on operational uptime. Professional services now encompass sophisticated methodologies, including advanced chemical cleaning and decontamination solutions, which are vital for maintaining compliance and asset integrity.
  • A key trend is the adoption of technology, such as robotic automation and data analytics, to enhance efficiency and provide verifiable service quality. In a business scenario, a food processing facility leverages specialized contamination control protocols, including validated cleaning of production lines and comprehensive allergen management, to adhere to food safety standards.
  • This proactive approach prevents costly product recalls, ensures uninterrupted production, and protects brand reputation, illustrating how expert cleaning services directly contribute to bottom-line stability and market competitiveness in the industrial cleaning services market.

What will be the Size of the Industrial Cleaning Services Market during the forecast period?

Get Key Insights on Market Forecast (PDF) Request Free Sample

How is the Industrial Cleaning Services Market Segmented?

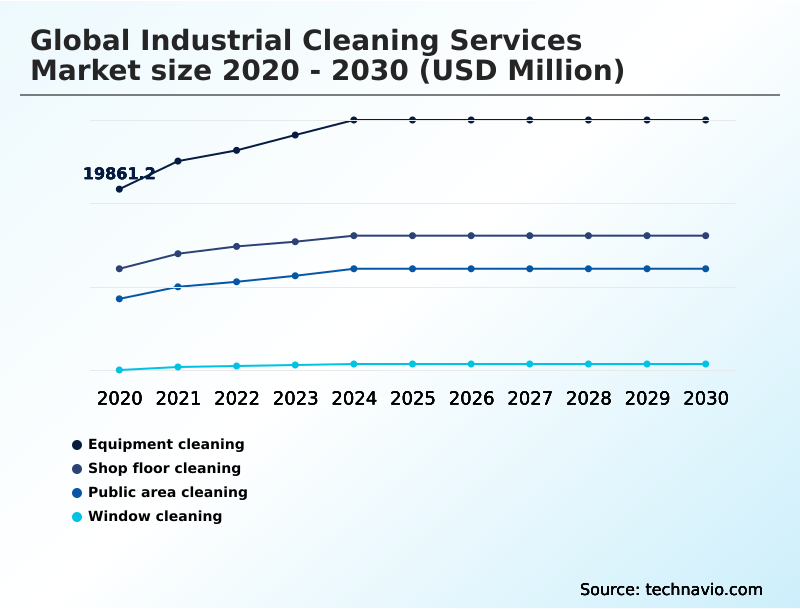
The industrial cleaning services industry research report provides comprehensive data (region-wise segment analysis), with forecasts and estimates in "USD million" for the period 2026-2030, as well as historical data from 2020-2024 for the following segments.

  • Application
    • Equipment cleaning
    • Shop floor cleaning
    • Public area cleaning
    • Window cleaning
  • End-user
    • Manufacturing and commercial offices
    • Pharmaceutical industry
    • Oil and gas and petrochemical industry
    • Food and beverage industry
    • Others
  • Type
    • Chelating agents
    • Solubilizers or hydrotropes
    • PH regulators
    • Others
  • Geography
    • APAC
      • China
      • India
      • Japan
    • North America
      • US
      • Canada
      • Mexico
    • Europe
      • Germany
      • UK
      • France
    • South America
      • Brazil
      • Argentina
      • Colombia
    • Middle East and Africa
      • Saudi Arabia
      • UAE
      • South Africa
    • Rest of World (ROW)

By Application Insights

The equipment cleaning segment is estimated to witness significant growth during the forecast period.

The equipment cleaning segment is critical for operational continuity, focusing on the maintenance of machinery and production apparatus to prevent unscheduled downtime. This strategic investment in preventative maintenance cleaning extends the lifecycle of high-value assets.

Industries governed by stringent health standards rely on professional services for validated cleaning process execution, utilizing techniques from manual scrubbing to advanced cryogenic cleaning.

Employing specialized non-toxic solvents and low voc cleaning agents is essential for material compatibility and environmental compliance.

The use of specialized cleaning methods, such as ultra-high-pressure waterjetting, has been shown to improve equipment efficiency by removing performance-inhibiting residues, directly impacting productivity and supporting lean manufacturing cleaning goals and broader industrial facility hygiene standards.

Request Free Sample

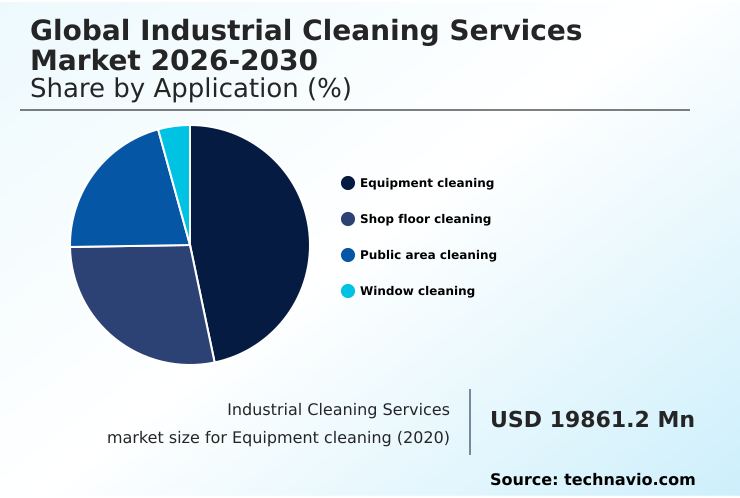
The Equipment cleaning segment was valued at USD 26.76 billion in 2024 and showed a gradual increase during the forecast period.

Request Free Sample

Regional Analysis

APAC is estimated to contribute 50.2% to the growth of the global market during the forecast period.Technavio’s analysts have elaborately explained the regional trends and drivers that shape the market during the forecast period.

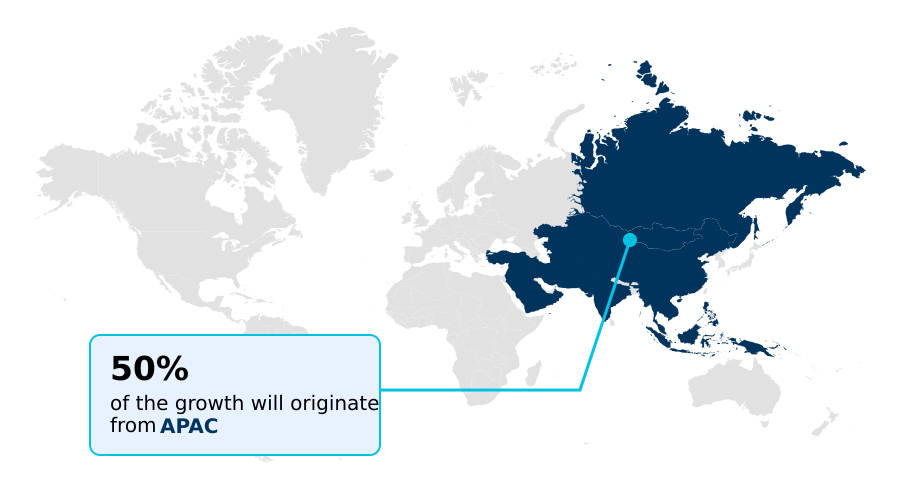
See How Industrial Cleaning Services Market Demand is Rising in APAC Request Free Sample

The geographic landscape of the industrial cleaning services market is marked by varied regional dynamics. The APAC region is experiencing the most rapid expansion, contributing over 50% of the market's incremental growth, fueled by swift industrialization.

In contrast, mature markets in North America and Europe are driven by technology adoption and stringent regulations focused on asset integrity preservation. The emphasis on occupational safety compliance is a universal driver, but its implementation differs.

For instance, European firms lead in adopting advanced hydro blasting systems with integrated water recycling, achieving water consumption reductions of nearly 30% in certain applications.

This focus on resource conservation techniques, alongside the need for specialized industry cleaning, defines the competitive environment and shapes investment priorities across continents.

Market Dynamics

Our researchers analyzed the data with 2025 as the base year, along with the key drivers, trends, and challenges. A holistic analysis of drivers will help companies refine their marketing strategies to gain a competitive advantage.

  • Strategic decision-making in the global industrial cleaning services market 2026-2030 is increasingly nuanced, moving beyond simple cost analysis of in-house vs outsourced cleaning to a focus on specialized value. For instance, the benefits of outsourcing industrial cleaning services are most evident in regulated sectors.
  • Industrial cleaning services for pharmaceutical cleanrooms require providers to offer comprehensive cleanroom validation and certification services, ensuring compliance with strict GMP standards. This contrasts with the needs of heavy industry, where heavy machinery degreasing service benefits and hydro blasting for heat exchanger efficiency are paramount for maintaining production uptime.
  • Across all sectors, compliance with osha cleaning standards and the management of combustible dust removal for manufacturing safety are non-negotiable for reducing workplace accidents through floor care. The trend toward automation is clear, with robotic floor scrubbers for warehouse logistics becoming standard.
  • In specialized areas, such as specialized cleaning for automotive paint shops and contamination control in electronics manufacturing, the focus is on precision. Sustainability is also a key differentiator, with a growing demand for sustainable green cleaning for food processing. This specialization extends to managing hazardous waste in chemical plants and tank and vessel cleaning for oil and gas.
  • Facilities using specialized protocols report significantly higher audit pass rates, with some achieving a double-digit percentage point improvement over generalist approaches, highlighting the ROI of expertise in areas like preventing cross-contamination in food production and improving operational efficiency with clean-in-place systems.
  • The overall focus remains on hvac and duct cleaning for industrial air quality, asset preservation through corrosion inhibitor use, and high-pressure water jetting for surface preparation.

What are the key market drivers leading to the rise in the adoption of Industrial Cleaning Services Industry?

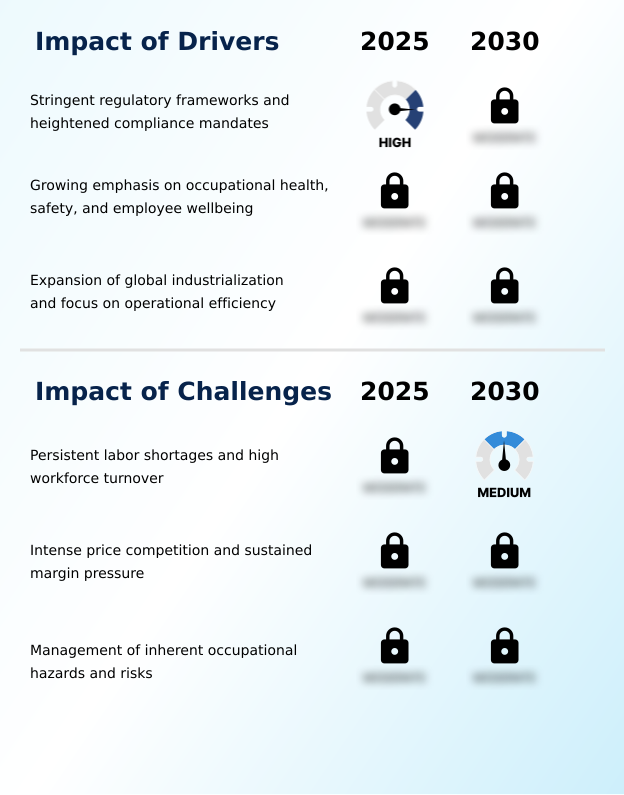
  • Stringent regulatory frameworks and heightened compliance mandates serve as a key driver for the industrial cleaning services market.

  • Market growth is fundamentally driven by regulatory mandates and a corporate focus on operational excellence. Stringent frameworks governing occupational safety compliance and environmental protection compel industries to seek professional services.
  • Companies that implement documented, professional cleaning programs often report a 15% reduction in workplace injury claims. Beyond compliance, the expansion of global industrialization and a focus on efficiency create sustained demand.
  • Proactive industrial degreasing and maintenance schedules, including the use of effective chemical cleaning methods, can extend the operational life of machinery by up to 20%.
  • This focus on environmental cleaning services and asset preservation positions cleaning as a value-adding activity, essential for heavy industry maintenance and ensuring long-term profitability and sustainable cleaning solutions.

What are the market trends shaping the Industrial Cleaning Services Industry?

  • A defining market trend is the increasing adoption of environmentally sustainable practices and green cleaning solutions. This shift is reshaping operational priorities and client expectations across all major geographic regions.

  • Key market trends are reshaping service delivery, driven by technology and specialization. The integration of advanced technologies and data-driven solutions is prominent, with the adoption of autonomous floor scrubbers increasing operational efficiency by over 60% in large logistics centers. This move toward robotic cleaning automation enhances safety in hazardous environments.
  • Concurrently, there is a growing demand for highly specialized, industry-specific solutions. For example, specialized allergen management cleaning protocols within the food and beverage sector have been demonstrated to reduce cross-contamination incidents by more than 95%.
  • This focus on pharmaceutical gmp cleaning and other high-stakes environments highlights a shift from generalized services to expert-led contamination control protocols, where techniques like aseptic technique are standard.

What challenges does the Industrial Cleaning Services Industry face during its growth?

  • Persistent labor shortages and high workforce turnover represent a key challenge affecting industry growth.

  • The industry grapples with significant operational and financial challenges. Persistent labor shortages are a primary concern, with workforce turnover rates in some regions exceeding 40% annually, which dramatically inflates recruitment and training costs. This issue is a major catalyst for investment in robotic cleaning automation.
  • Simultaneously, intense price competition creates sustained margin pressure, making it difficult to invest in advanced training for hazardous material handling and other specialized skills.
  • The management of inherent occupational hazards remains a critical challenge; while a comprehensive safety program increases overhead, it can lower liability insurance premiums by an average of 10%, demonstrating a clear ROI for prioritizing workplace hygiene standards and data-driven cleaning schedules.

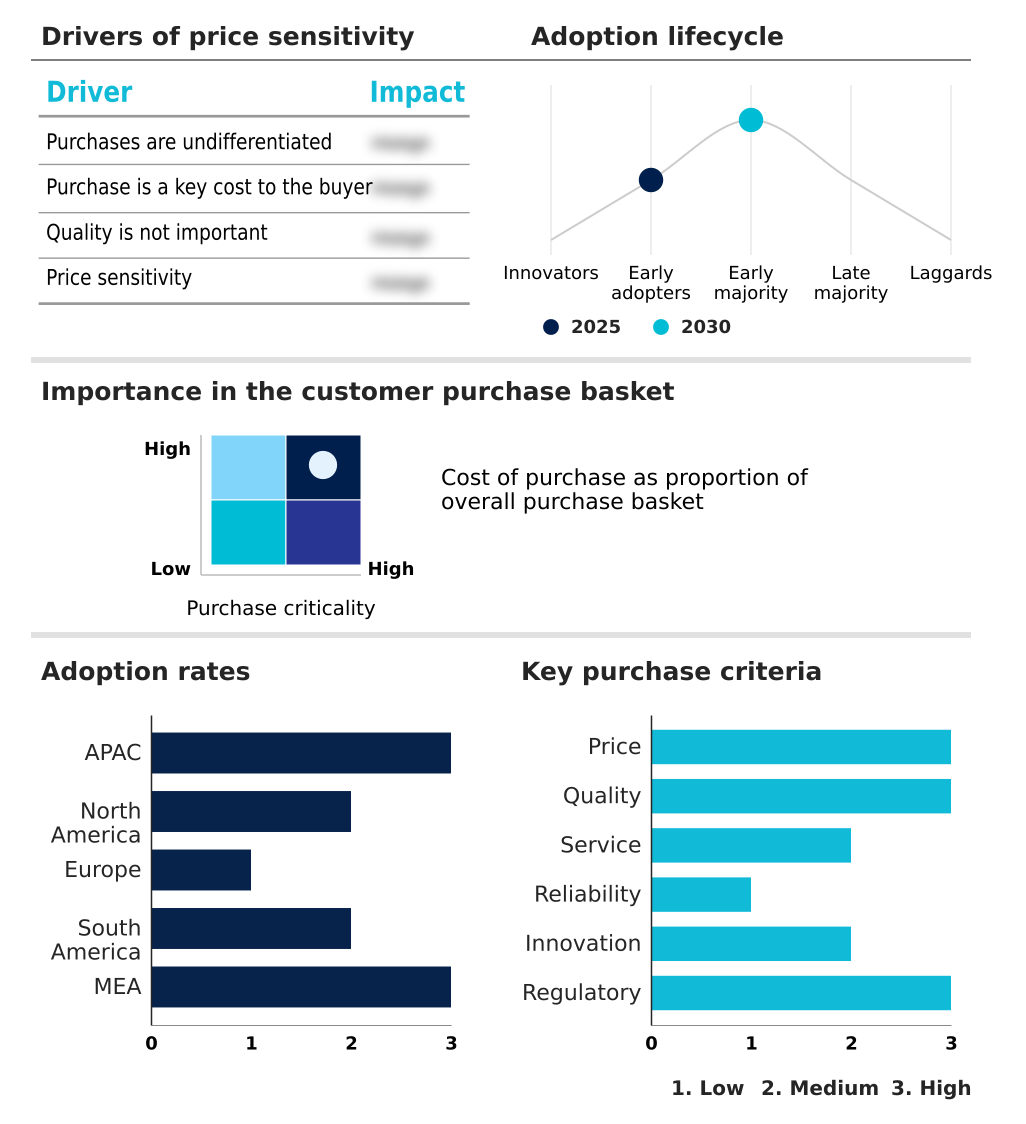
Exclusive Technavio Analysis on Customer Landscape

The industrial cleaning services market forecasting report includes the adoption lifecycle of the market, covering from the innovator’s stage to the laggard’s stage. It focuses on adoption rates in different regions based on penetration. Furthermore, the industrial cleaning services market report also includes key purchase criteria and drivers of price sensitivity to help companies evaluate and develop their market growth analysis strategies.

Customer Landscape of Industrial Cleaning Services Industry

Competitive Landscape

Companies are implementing various strategies, such as strategic alliances, industrial cleaning services market forecast, partnerships, mergers and acquisitions, geographical expansion, and product/service launches, to enhance their presence in the industry.

ABM Industries Inc. - Offerings include integrated facility solutions, delivering janitorial, disinfection, and specialized cleaning for a diverse range of commercial and industrial clients.

The industry research and growth report includes detailed analyses of the competitive landscape of the market and information about key companies, including:

  • ABM Industries Inc.
  • Anago Cleaning Systems Inc.
  • Aramark
  • Bilfinger SE
  • Cintas Corp.
  • Clean Harbors Inc.
  • CleanNet USA Inc.
  • Coverall North America Inc.
  • Ecolab Inc.
  • EMCOR Group Inc.
  • GDI Integrated Facility Services
  • GFL Environmental Inc.
  • ISS AS
  • Jan Pro Franchising Inc
  • Jani King International Inc.
  • Mitie Group plc
  • Rentokil Initial Plc
  • Sodexo SA
  • Stratus Building Solutions
  • Vanguard Cleaning Systems Inc.

Qualitative and quantitative analysis of companies has been conducted to help clients understand the wider business environment as well as the strengths and weaknesses of key industry players. Data is qualitatively analyzed to categorize companies as pure play, category-focused, industry-focused, and diversified; it is quantitatively analyzed to categorize companies as dominant, leading, strong, tentative, and weak.

Recent Development and News in Industrial cleaning services market

  • In August 2024, Brazil's National Health Surveillance Agency (ANVISA) published new regulations, RDC 989/2025 and IN 394/2025, to harmonize sanitizing product requirements with Mercosur standards, impacting product safety and regional market competitiveness.
  • In January 2025, Henkel presented its Smartwash system, an AI-driven technology for optimized detergent dosing, signaling a move toward smart, resource-efficient solutions with applications in industrial settings.
  • In April 2025, Karcher launched its T 11/1 Re-Plast dry vacuum cleaner, made with 60% recycled plastic, underscoring the trend of integrating sustainable manufacturing practices into cleaning equipment.
  • In May 2025, ISS announced a five-year expansion of its partnership with a major natural resources client in APAC, extending integrated services including site cleaning to two additional locations.

Dive into Technavio’s robust research methodology, blending expert interviews, extensive data synthesis, and validated models for unparalleled Industrial Cleaning Services Market insights. See full methodology.

Market Scope
Page number 322
Base year 2025
Historic period 2020-2024
Forecast period 2026-2030
Growth momentum & CAGR Accelerate at a CAGR of 6.1%
Market growth 2026-2030 USD 20485.2 million
Market structure Fragmented
YoY growth 2025-2026(%) 5.8%
Key countries China, India, Japan, South Korea, Australia, Indonesia, US, Canada, Mexico, Germany, UK, France, Italy, Spain, The Netherlands, Brazil, Argentina, Colombia, Saudi Arabia, UAE, South Africa, Qatar and Turkey
Competitive landscape Leading Companies, Market Positioning of Companies, Competitive Strategies, and Industry Risks

Request Free Sample

Research Analyst Overview

  • The industrial cleaning services market is transitioning from a labor-intensive function to a technology-driven, strategic necessity. This evolution is underpinned by a suite of advanced methods, including high pressure water jetting, hydro blasting, and cryogenic cleaning, which are essential for industrial degreasing and biofilm removal.
  • The formulation of effective cleaning agents, utilizing components like chelating agents, hydrotropes, and pH regulators, is critical. The boardroom-level decision to invest in robotic cleaning automation is increasingly being justified by documented service delivery consistency improvements of over 40% compared to manual methods.
  • This shift is not just about efficiency; it's about mitigating risk through validated cleaning process execution and sophisticated combustible dusts management. As facilities adopt complex clean-in-place systems, the demand for expert providers who understand the chemistry of surfactants, solvents, and enzymes, and the importance of corrosion inhibitors and biocides for asset protection will intensify.
  • Services such as pipeline pigging, cleanroom sanitation using vaporized hydrogen peroxide, and specialized allergen management cleaning are becoming standard, moving the industry toward precision and documented compliance.

What are the Key Data Covered in this Industrial Cleaning Services Market Research and Growth Report?

  • What is the expected growth of the Industrial Cleaning Services Market between 2026 and 2030?

    • USD 20.49 billion, at a CAGR of 6.1%

  • What segmentation does the market report cover?

    • The report is segmented by Application (Equipment cleaning, Shop floor cleaning, Public area cleaning, and Window cleaning), End-user (Manufacturing and commercial offices, Pharmaceutical industry, Oil and gas and petrochemical industry, Food and beverage industry, and Others), Type (Chelating agents, Solubilizers or hydrotropes, PH regulators, and Others) and Geography (APAC, North America, Europe, South America, Middle East and Africa)

  • Which regions are analyzed in the report?

    • APAC, North America, Europe, South America and Middle East and Africa

  • What are the key growth drivers and market challenges?

    • Stringent regulatory frameworks and heightened compliance mandates, Persistent labor shortages and high workforce turnover

  • Who are the major players in the Industrial Cleaning Services Market?

    • ABM Industries Inc., Anago Cleaning Systems Inc., Aramark, Bilfinger SE, Cintas Corp., Clean Harbors Inc., CleanNet USA Inc., Coverall North America Inc., Ecolab Inc., EMCOR Group Inc., GDI Integrated Facility Services, GFL Environmental Inc., ISS AS, Jan Pro Franchising Inc, Jani King International Inc., Mitie Group plc, Rentokil Initial Plc, Sodexo SA, Stratus Building Solutions and Vanguard Cleaning Systems Inc.

Market Research Insights

  • Market dynamics are shifting from cost-centric procurement to value-based partnerships, with a focus on integrated facility management. This approach emphasizes specialized expertise in areas such as food safety sanitation and pharmaceutical gmp cleaning. The adoption of robotic cleaning automation is a key factor, with some operators reporting floor coverage efficiency gains of up to 50% in large-scale logistics warehouse cleaning.
  • Furthermore, implementing preventative maintenance cleaning schedules has demonstrated a reduction in critical equipment downtime by over 20%. These measurable outcomes underscore the ROI of professional services, positioning them as essential for maintaining high workplace hygiene standards and achieving operational excellence.

We can help! Our analysts can customize this industrial cleaning services market research report to meet your requirements.

Get in touch

1. Executive Summary

1.1 Market overview

Executive Summary - Chart on Market Overview
Executive Summary - Data Table on Market Overview
Executive Summary - Chart on Global Market Characteristics
Executive Summary - Chart on Market by Geography
Executive Summary - Chart on Market Segmentation by Application
Executive Summary - Chart on Market Segmentation by End-user
Executive Summary - Chart on Market Segmentation by Type
Executive Summary - Chart on Incremental Growth
Executive Summary - Data Table on Incremental Growth
Executive Summary - Chart on Company Market Positioning

2. Technavio Analysis

2.1 Analysis of price sensitivity, lifecycle, customer purchase basket, adoption rates, and purchase criteria

2.2 Criticality of inputs and Factors of differentiation

Chart on Overview on criticality of inputs and factors of differentiation

2.3 Factors of disruption

Chart on Overview on factors of disruption

2.4 Impact of drivers and challenges

Chart on Impact of drivers and challenges in 2025 and 2030

3. Market Landscape

3.1 Market ecosystem

Chart on Parent Market
Data Table on - Parent Market

3.2 Market characteristics

Chart on Market characteristics analysis

3.3 Value chain analysis

Chart on Value chain analysis

4. Market Sizing

4.1 Market definition

Data Table on Offerings of companies included in the market definition

4.2 Market segment analysis

Market segments

4.3 Market size 2025

4.4 Market outlook: Forecast for 2025-2030

Chart on Global - Market size and forecast 2025-2030 ($ million)
Data Table on Global - Market size and forecast 2025-2030 ($ million)
Chart on Global Market: Year-over-year growth 2025-2030 (%)
Data Table on Global Market: Year-over-year growth 2025-2030 (%)

5. Historic Market Size

5.1 Global Industrial Cleaning Services Market 2020 - 2024

Historic Market Size - Data Table on Global Industrial Cleaning Services Market 2020 - 2024 ($ million)

5.2 Application segment analysis 2020 - 2024

Historic Market Size - Application Segment 2020 - 2024 ($ million)

5.3 End-user segment analysis 2020 - 2024

Historic Market Size - End-user Segment 2020 - 2024 ($ million)

5.4 Type segment analysis 2020 - 2024

Historic Market Size - Type Segment 2020 - 2024 ($ million)

5.5 Geography segment analysis 2020 - 2024

Historic Market Size - Geography Segment 2020 - 2024 ($ million)

5.6 Country segment analysis 2020 - 2024

Historic Market Size - Country Segment 2020 - 2024 ($ million)

6. Qualitative Analysis

6.1 Impact of AI on global industrial cleaning services market

7. Five Forces Analysis

7.1 Five forces summary

Five forces analysis - Comparison between 2025 and 2030

7.2 Bargaining power of buyers

Bargaining power of buyers - Impact of key factors 2025 and 2030

7.3 Bargaining power of suppliers

Bargaining power of suppliers - Impact of key factors in 2025 and 2030

7.4 Threat of new entrants

Threat of new entrants - Impact of key factors in 2025 and 2030

7.5 Threat of substitutes

Threat of substitutes - Impact of key factors in 2025 and 2030

7.6 Threat of rivalry

Threat of rivalry - Impact of key factors in 2025 and 2030

7.7 Market condition

Chart on Market condition - Five forces 2025 and 2030

8. Market Segmentation by Application

8.1 Market segments

Chart on Application - Market share 2025-2030 (%)
Data Table on Application - Market share 2025-2030 (%)

8.2 Comparison by Application

Chart on Comparison by Application
Data Table on Comparison by Application

8.3 Equipment cleaning - Market size and forecast 2025-2030

Chart on Equipment cleaning - Market size and forecast 2025-2030 ($ million)
Data Table on Equipment cleaning - Market size and forecast 2025-2030 ($ million)
Chart on Equipment cleaning - Year-over-year growth 2025-2030 (%)
Data Table on Equipment cleaning - Year-over-year growth 2025-2030 (%)

8.4 Shop floor cleaning - Market size and forecast 2025-2030

Chart on Shop floor cleaning - Market size and forecast 2025-2030 ($ million)
Data Table on Shop floor cleaning - Market size and forecast 2025-2030 ($ million)
Chart on Shop floor cleaning - Year-over-year growth 2025-2030 (%)
Data Table on Shop floor cleaning - Year-over-year growth 2025-2030 (%)

8.5 Public area cleaning - Market size and forecast 2025-2030

Chart on Public area cleaning - Market size and forecast 2025-2030 ($ million)
Data Table on Public area cleaning - Market size and forecast 2025-2030 ($ million)
Chart on Public area cleaning - Year-over-year growth 2025-2030 (%)
Data Table on Public area cleaning - Year-over-year growth 2025-2030 (%)

8.6 Window cleaning - Market size and forecast 2025-2030

Chart on Window cleaning - Market size and forecast 2025-2030 ($ million)
Data Table on Window cleaning - Market size and forecast 2025-2030 ($ million)
Chart on Window cleaning - Year-over-year growth 2025-2030 (%)
Data Table on Window cleaning - Year-over-year growth 2025-2030 (%)

8.7 Market opportunity by Application

Market opportunity by Application ($ million)
Data Table on Market opportunity by Application ($ million)

9. Market Segmentation by End-user

9.1 Market segments

Chart on End-user - Market share 2025-2030 (%)
Data Table on End-user - Market share 2025-2030 (%)

9.2 Comparison by End-user

Chart on Comparison by End-user
Data Table on Comparison by End-user

9.3 Manufacturing and commercial offices - Market size and forecast 2025-2030

Chart on Manufacturing and commercial offices - Market size and forecast 2025-2030 ($ million)
Data Table on Manufacturing and commercial offices - Market size and forecast 2025-2030 ($ million)
Chart on Manufacturing and commercial offices - Year-over-year growth 2025-2030 (%)
Data Table on Manufacturing and commercial offices - Year-over-year growth 2025-2030 (%)

9.4 Pharmaceutical industry - Market size and forecast 2025-2030

Chart on Pharmaceutical industry - Market size and forecast 2025-2030 ($ million)
Data Table on Pharmaceutical industry - Market size and forecast 2025-2030 ($ million)
Chart on Pharmaceutical industry - Year-over-year growth 2025-2030 (%)
Data Table on Pharmaceutical industry - Year-over-year growth 2025-2030 (%)

9.5 Oil and gas and petrochemical industry - Market size and forecast 2025-2030

Chart on Oil and gas and petrochemical industry - Market size and forecast 2025-2030 ($ million)
Data Table on Oil and gas and petrochemical industry - Market size and forecast 2025-2030 ($ million)
Chart on Oil and gas and petrochemical industry - Year-over-year growth 2025-2030 (%)
Data Table on Oil and gas and petrochemical industry - Year-over-year growth 2025-2030 (%)

9.6 Food and beverage industry - Market size and forecast 2025-2030

Chart on Food and beverage industry - Market size and forecast 2025-2030 ($ million)
Data Table on Food and beverage industry - Market size and forecast 2025-2030 ($ million)
Chart on Food and beverage industry - Year-over-year growth 2025-2030 (%)
Data Table on Food and beverage industry - Year-over-year growth 2025-2030 (%)

9.7 Others - Market size and forecast 2025-2030

Chart on Others - Market size and forecast 2025-2030 ($ million)
Data Table on Others - Market size and forecast 2025-2030 ($ million)
Chart on Others - Year-over-year growth 2025-2030 (%)
Data Table on Others - Year-over-year growth 2025-2030 (%)

9.8 Market opportunity by End-user

Market opportunity by End-user ($ million)
Data Table on Market opportunity by End-user ($ million)

10. Market Segmentation by Type

10.1 Market segments

Chart on Type - Market share 2025-2030 (%)
Data Table on Type - Market share 2025-2030 (%)

10.2 Comparison by Type

Chart on Comparison by Type
Data Table on Comparison by Type

10.3 Chelating agents - Market size and forecast 2025-2030

Chart on Chelating agents - Market size and forecast 2025-2030 ($ million)
Data Table on Chelating agents - Market size and forecast 2025-2030 ($ million)
Chart on Chelating agents - Year-over-year growth 2025-2030 (%)
Data Table on Chelating agents - Year-over-year growth 2025-2030 (%)

10.4 Solubilizers or hydrotropes - Market size and forecast 2025-2030

Chart on Solubilizers or hydrotropes - Market size and forecast 2025-2030 ($ million)
Data Table on Solubilizers or hydrotropes - Market size and forecast 2025-2030 ($ million)
Chart on Solubilizers or hydrotropes - Year-over-year growth 2025-2030 (%)
Data Table on Solubilizers or hydrotropes - Year-over-year growth 2025-2030 (%)

10.5 PH regulators - Market size and forecast 2025-2030

Chart on PH regulators - Market size and forecast 2025-2030 ($ million)
Data Table on PH regulators - Market size and forecast 2025-2030 ($ million)
Chart on PH regulators - Year-over-year growth 2025-2030 (%)
Data Table on PH regulators - Year-over-year growth 2025-2030 (%)

10.6 Others - Market size and forecast 2025-2030

Chart on Others - Market size and forecast 2025-2030 ($ million)
Data Table on Others - Market size and forecast 2025-2030 ($ million)
Chart on Others - Year-over-year growth 2025-2030 (%)
Data Table on Others - Year-over-year growth 2025-2030 (%)

10.7 Market opportunity by Type

Market opportunity by Type ($ million)
Data Table on Market opportunity by Type ($ million)

11. Customer Landscape

11.1 Customer landscape overview

Analysis of price sensitivity, lifecycle, customer purchase basket, adoption rates, and purchase criteria

12. Geographic Landscape

12.1 Geographic segmentation

Chart on Market share by geography 2025-2030 (%)
Data Table on Market share by geography 2025-2030 (%)

12.2 Geographic comparison

Chart on Geographic comparison
Data Table on Geographic comparison

12.3 APAC - Market size and forecast 2025-2030

Chart on APAC - Market size and forecast 2025-2030 ($ million)
Data Table on APAC - Market size and forecast 2025-2030 ($ million)
Chart on APAC - Year-over-year growth 2025-2030 (%)
Data Table on APAC - Year-over-year growth 2025-2030 (%)
Chart on Regional Comparison - APAC
Data Table on Regional Comparison - APAC

12.3.1 China - Market size and forecast 2025-2030

Chart on China - Market size and forecast 2025-2030 ($ million)
Data Table on China - Market size and forecast 2025-2030 ($ million)
Chart on China - Year-over-year growth 2025-2030 (%)
Data Table on China - Year-over-year growth 2025-2030 (%)

12.3.2 India - Market size and forecast 2025-2030

Chart on India - Market size and forecast 2025-2030 ($ million)
Data Table on India - Market size and forecast 2025-2030 ($ million)
Chart on India - Year-over-year growth 2025-2030 (%)
Data Table on India - Year-over-year growth 2025-2030 (%)

12.3.3 Japan - Market size and forecast 2025-2030

Chart on Japan - Market size and forecast 2025-2030 ($ million)
Data Table on Japan - Market size and forecast 2025-2030 ($ million)
Chart on Japan - Year-over-year growth 2025-2030 (%)
Data Table on Japan - Year-over-year growth 2025-2030 (%)

12.3.4 South Korea - Market size and forecast 2025-2030

Chart on South Korea - Market size and forecast 2025-2030 ($ million)
Data Table on South Korea - Market size and forecast 2025-2030 ($ million)
Chart on South Korea - Year-over-year growth 2025-2030 (%)
Data Table on South Korea - Year-over-year growth 2025-2030 (%)

12.3.5 Australia - Market size and forecast 2025-2030

Chart on Australia - Market size and forecast 2025-2030 ($ million)
Data Table on Australia - Market size and forecast 2025-2030 ($ million)
Chart on Australia - Year-over-year growth 2025-2030 (%)
Data Table on Australia - Year-over-year growth 2025-2030 (%)

12.3.6 Indonesia - Market size and forecast 2025-2030

Chart on Indonesia - Market size and forecast 2025-2030 ($ million)
Data Table on Indonesia - Market size and forecast 2025-2030 ($ million)
Chart on Indonesia - Year-over-year growth 2025-2030 (%)
Data Table on Indonesia - Year-over-year growth 2025-2030 (%)

12.4 North America - Market size and forecast 2025-2030

Chart on North America - Market size and forecast 2025-2030 ($ million)
Data Table on North America - Market size and forecast 2025-2030 ($ million)
Chart on North America - Year-over-year growth 2025-2030 (%)
Data Table on North America - Year-over-year growth 2025-2030 (%)
Chart on Regional Comparison - North America
Data Table on Regional Comparison - North America

12.4.1 US - Market size and forecast 2025-2030

Chart on US - Market size and forecast 2025-2030 ($ million)
Data Table on US - Market size and forecast 2025-2030 ($ million)
Chart on US - Year-over-year growth 2025-2030 (%)
Data Table on US - Year-over-year growth 2025-2030 (%)

12.4.2 Canada - Market size and forecast 2025-2030

Chart on Canada - Market size and forecast 2025-2030 ($ million)
Data Table on Canada - Market size and forecast 2025-2030 ($ million)
Chart on Canada - Year-over-year growth 2025-2030 (%)
Data Table on Canada - Year-over-year growth 2025-2030 (%)

12.4.3 Mexico - Market size and forecast 2025-2030

Chart on Mexico - Market size and forecast 2025-2030 ($ million)
Data Table on Mexico - Market size and forecast 2025-2030 ($ million)
Chart on Mexico - Year-over-year growth 2025-2030 (%)
Data Table on Mexico - Year-over-year growth 2025-2030 (%)

12.5 Europe - Market size and forecast 2025-2030

Chart on Europe - Market size and forecast 2025-2030 ($ million)
Data Table on Europe - Market size and forecast 2025-2030 ($ million)
Chart on Europe - Year-over-year growth 2025-2030 (%)
Data Table on Europe - Year-over-year growth 2025-2030 (%)
Chart on Regional Comparison - Europe
Data Table on Regional Comparison - Europe

12.5.1 Germany - Market size and forecast 2025-2030

Chart on Germany - Market size and forecast 2025-2030 ($ million)
Data Table on Germany - Market size and forecast 2025-2030 ($ million)
Chart on Germany - Year-over-year growth 2025-2030 (%)
Data Table on Germany - Year-over-year growth 2025-2030 (%)

12.5.2 UK - Market size and forecast 2025-2030

Chart on UK - Market size and forecast 2025-2030 ($ million)
Data Table on UK - Market size and forecast 2025-2030 ($ million)
Chart on UK - Year-over-year growth 2025-2030 (%)
Data Table on UK - Year-over-year growth 2025-2030 (%)

12.5.3 France - Market size and forecast 2025-2030

Chart on France - Market size and forecast 2025-2030 ($ million)
Data Table on France - Market size and forecast 2025-2030 ($ million)
Chart on France - Year-over-year growth 2025-2030 (%)
Data Table on France - Year-over-year growth 2025-2030 (%)

12.5.4 Italy - Market size and forecast 2025-2030

Chart on Italy - Market size and forecast 2025-2030 ($ million)
Data Table on Italy - Market size and forecast 2025-2030 ($ million)
Chart on Italy - Year-over-year growth 2025-2030 (%)
Data Table on Italy - Year-over-year growth 2025-2030 (%)

12.5.5 Spain - Market size and forecast 2025-2030

Chart on Spain - Market size and forecast 2025-2030 ($ million)
Data Table on Spain - Market size and forecast 2025-2030 ($ million)
Chart on Spain - Year-over-year growth 2025-2030 (%)
Data Table on Spain - Year-over-year growth 2025-2030 (%)

12.5.6 The Netherlands - Market size and forecast 2025-2030

Chart on The Netherlands - Market size and forecast 2025-2030 ($ million)
Data Table on The Netherlands - Market size and forecast 2025-2030 ($ million)
Chart on The Netherlands - Year-over-year growth 2025-2030 (%)
Data Table on The Netherlands - Year-over-year growth 2025-2030 (%)

12.6 South America - Market size and forecast 2025-2030

Chart on South America - Market size and forecast 2025-2030 ($ million)
Data Table on South America - Market size and forecast 2025-2030 ($ million)
Chart on South America - Year-over-year growth 2025-2030 (%)
Data Table on South America - Year-over-year growth 2025-2030 (%)
Chart on Regional Comparison - South America
Data Table on Regional Comparison - South America

12.6.1 Brazil - Market size and forecast 2025-2030

Chart on Brazil - Market size and forecast 2025-2030 ($ million)
Data Table on Brazil - Market size and forecast 2025-2030 ($ million)
Chart on Brazil - Year-over-year growth 2025-2030 (%)
Data Table on Brazil - Year-over-year growth 2025-2030 (%)

12.6.2 Argentina - Market size and forecast 2025-2030

Chart on Argentina - Market size and forecast 2025-2030 ($ million)
Data Table on Argentina - Market size and forecast 2025-2030 ($ million)
Chart on Argentina - Year-over-year growth 2025-2030 (%)
Data Table on Argentina - Year-over-year growth 2025-2030 (%)

12.6.3 Colombia - Market size and forecast 2025-2030

Chart on Colombia - Market size and forecast 2025-2030 ($ million)
Data Table on Colombia - Market size and forecast 2025-2030 ($ million)
Chart on Colombia - Year-over-year growth 2025-2030 (%)
Data Table on Colombia - Year-over-year growth 2025-2030 (%)

12.7 Middle East and Africa - Market size and forecast 2025-2030

Chart on Middle East and Africa - Market size and forecast 2025-2030 ($ million)
Data Table on Middle East and Africa - Market size and forecast 2025-2030 ($ million)
Chart on Middle East and Africa - Year-over-year growth 2025-2030 (%)
Data Table on Middle East and Africa - Year-over-year growth 2025-2030 (%)
Chart on Regional Comparison - Middle East and Africa
Data Table on Regional Comparison - Middle East and Africa

12.7.1 Saudi Arabia - Market size and forecast 2025-2030

Chart on Saudi Arabia - Market size and forecast 2025-2030 ($ million)
Data Table on Saudi Arabia - Market size and forecast 2025-2030 ($ million)
Chart on Saudi Arabia - Year-over-year growth 2025-2030 (%)
Data Table on Saudi Arabia - Year-over-year growth 2025-2030 (%)

12.7.2 UAE - Market size and forecast 2025-2030

Chart on UAE - Market size and forecast 2025-2030 ($ million)
Data Table on UAE - Market size and forecast 2025-2030 ($ million)
Chart on UAE - Year-over-year growth 2025-2030 (%)
Data Table on UAE - Year-over-year growth 2025-2030 (%)

12.7.3 South Africa - Market size and forecast 2025-2030

Chart on South Africa - Market size and forecast 2025-2030 ($ million)
Data Table on South Africa - Market size and forecast 2025-2030 ($ million)
Chart on South Africa - Year-over-year growth 2025-2030 (%)
Data Table on South Africa - Year-over-year growth 2025-2030 (%)

12.7.4 Qatar - Market size and forecast 2025-2030

Chart on Qatar - Market size and forecast 2025-2030 ($ million)
Data Table on Qatar - Market size and forecast 2025-2030 ($ million)
Chart on Qatar - Year-over-year growth 2025-2030 (%)
Data Table on Qatar - Year-over-year growth 2025-2030 (%)

12.7.5 Turkey - Market size and forecast 2025-2030

Chart on Turkey - Market size and forecast 2025-2030 ($ million)
Data Table on Turkey - Market size and forecast 2025-2030 ($ million)
Chart on Turkey - Year-over-year growth 2025-2030 (%)
Data Table on Turkey - Year-over-year growth 2025-2030 (%)

12.8 Market opportunity by geography

Market opportunity by geography ($ million)
Data Tables on Market opportunity by geography ($ million)

13. Drivers, Challenges, and Opportunity

13.1 Market drivers

Stringent regulatory frameworks and heightened compliance mandates
Growing emphasis on occupational health, safety, and employee wellbeing
Expansion of global industrialization and focus on operational efficiency

13.2 Market challenges

Persistent labor shortages and high workforce turnover
Intense price competition and sustained margin pressure
Management of inherent occupational hazards and risks

13.3 Impact of drivers and challenges

Impact of drivers and challenges in 2025 and 2030

13.4 Market opportunities

Increasing adoption of environmentally sustainable and green cleaning solutions
Integration of advanced technologies, automation, and robotics
Growing demand for specialized and industry-specific cleaning solutions

14. Competitive Landscape

14.1 Overview

14.2

Overview on criticality of inputs and factors of differentiation

14.3 Landscape disruption

Overview on factors of disruption

14.4 Industry risks

Impact of key risks on business

15. Competitive Analysis

15.1 Companies profiled

Companies covered

15.2 Company ranking index

15.3 Market positioning of companies

Matrix on companies position and classification

15.4 ABM Industries Inc.

ABM Industries Inc. - Overview
ABM Industries Inc. - Business segments
ABM Industries Inc. - Key offerings
ABM Industries Inc. - Segment focus
SWOT

15.5 Aramark

Aramark - Overview
Aramark - Business segments
Aramark - Key news
Aramark - Key offerings
Aramark - Segment focus
SWOT

15.6 Bilfinger SE

Bilfinger SE - Overview
Bilfinger SE - Business segments
Bilfinger SE - Key offerings
Bilfinger SE - Segment focus
SWOT

15.7 Cintas Corp.

Cintas Corp. - Overview
Cintas Corp. - Business segments
Cintas Corp. - Key news
Cintas Corp. - Key offerings
Cintas Corp. - Segment focus
SWOT

15.8 Clean Harbors Inc.

Clean Harbors Inc. - Overview
Clean Harbors Inc. - Business segments
Clean Harbors Inc. - Key news
Clean Harbors Inc. - Key offerings
Clean Harbors Inc. - Segment focus
SWOT

15.9 CleanNet USA Inc.

CleanNet USA Inc. - Overview
CleanNet USA Inc. - Product / Service
CleanNet USA Inc. - Key offerings
SWOT

15.10 Ecolab Inc.

Ecolab Inc. - Overview
Ecolab Inc. - Business segments
Ecolab Inc. - Key news
Ecolab Inc. - Key offerings
Ecolab Inc. - Segment focus
SWOT

15.11 EMCOR Group Inc.

EMCOR Group Inc. - Overview
EMCOR Group Inc. - Business segments
EMCOR Group Inc. - Key offerings
EMCOR Group Inc. - Segment focus
SWOT

15.12 GDI Integrated Facility Services

GDI Integrated Facility Services - Overview
GDI Integrated Facility Services - Product / Service
GDI Integrated Facility Services - Key offerings
SWOT

15.13 GFL Environmental Inc.

GFL Environmental Inc. - Overview
GFL Environmental Inc. - Business segments
GFL Environmental Inc. - Key offerings
GFL Environmental Inc. - Segment focus
SWOT

15.14 ISS AS

ISS AS - Overview
ISS AS - Business segments
ISS AS - Key offerings
ISS AS - Segment focus
SWOT

15.15 Mitie Group plc

Mitie Group plc - Overview
Mitie Group plc - Business segments
Mitie Group plc - Key offerings
Mitie Group plc - Segment focus
SWOT

15.16 Rentokil Initial Plc

Rentokil Initial Plc - Overview
Rentokil Initial Plc - Business segments
Rentokil Initial Plc - Key offerings
Rentokil Initial Plc - Segment focus
SWOT

15.17 Stratus Building Solutions

Stratus Building Solutions - Overview
Stratus Building Solutions - Product / Service
Stratus Building Solutions - Key offerings
SWOT

15.18 Vanguard Cleaning Systems Inc.

Vanguard Cleaning Systems Inc. - Overview
Vanguard Cleaning Systems Inc. - Product / Service
Vanguard Cleaning Systems Inc. - Key offerings
SWOT

16. Appendix

16.1 Scope of the report

Market definition
Objectives
Notes and caveats

16.2 Inclusions and exclusions checklist

Inclusions checklist
Exclusions checklist

16.3 Currency conversion rates for US$

16.4 Research methodology

16.5 Data procurement

Information sources

16.6 Data validation

16.7 Validation techniques employed for market sizing

16.8 Data synthesis

16.9 360 degree market analysis

16.10 List of abbreviations

Research Methodology

Technavio presents a detailed picture of the market by way of study, synthesis, and summation of data from multiple sources. The analysts have presented the various facets of the market with a particular focus on identifying the key industry influencers. The data thus presented is comprehensive, reliable, and the result of extensive research, both primary and secondary.

INFORMATION SOURCES

Primary sources

  • Manufacturers and suppliers
  • Channel partners
  • Industry experts
  • Strategic decision makers

Secondary sources

  • Industry journals and periodicals
  • Government data
  • Financial reports of key industry players
  • Historical data
  • Press releases

DATA ANALYSIS

Data Synthesis

  • Collation of data
  • Estimation of key figures
  • Analysis of derived insights

Data Validation

  • Triangulation with data models
  • Reference against proprietary databases
  • Corroboration with industry experts

REPORT WRITING

Qualitative

  • Market drivers
  • Market challenges
  • Market trends
  • Five forces analysis

Quantitative

  • Market size and forecast
  • Market segmentation
  • Geographical insights
  • Competitive landscape

Interested in this report?

Get your sample now to see our research methodology and insights!

Download Now

Frequently Asked Questions

Industrial Cleaning Services market growth will increase by USD 20485.2 million during 2026-2030.

The Industrial Cleaning Services market is expected to grow at a CAGR of 6.1% during 2026-2030.

Industrial Cleaning Services market is segmented by Application (Equipment cleaning, Shop floor cleaning, Public area cleaning, Window cleaning) End-user (Manufacturing and commercial offices, Pharmaceutical industry, Oil and gas and petrochemical industry, Food and beverage industry, Others) Type (Chelating agents, Solubilizers or hydrotropes, PH regulators, Others)

ABM Industries Inc., Anago Cleaning Systems Inc., Aramark, Bilfinger SE, Cintas Corp., Clean Harbors Inc., CleanNet USA Inc., Coverall North America Inc., Ecolab Inc., EMCOR Group Inc., GDI Integrated Facility Services, GFL Environmental Inc., ISS AS, Jan Pro Franchising Inc, Jani King International Inc., Mitie Group plc, Rentokil Initial Plc, Sodexo SA, Stratus Building Solutions, Vanguard Cleaning Systems Inc. are a few of the key vendors in the Industrial Cleaning Services market.

APAC will register the highest growth rate of 50.2% among the other regions. Therefore, the Industrial Cleaning Services market in APAC is expected to garner significant business opportunities for the vendors during the forecast period.

China, India, Japan, South Korea, Australia, Indonesia, US, Canada, Mexico, Germany, UK, France, Italy, Spain, The Netherlands, Brazil, Argentina, Colombia, Saudi Arabia, UAE, South Africa, Qatar, Turkey

  • Stringent regulatory frameworks and heightened compliance mandates is the driving factor this market.

The Industrial Cleaning Services market vendors should focus on grabbing business opportunities from the Application segment as it accounted for the largest market share in the base year.