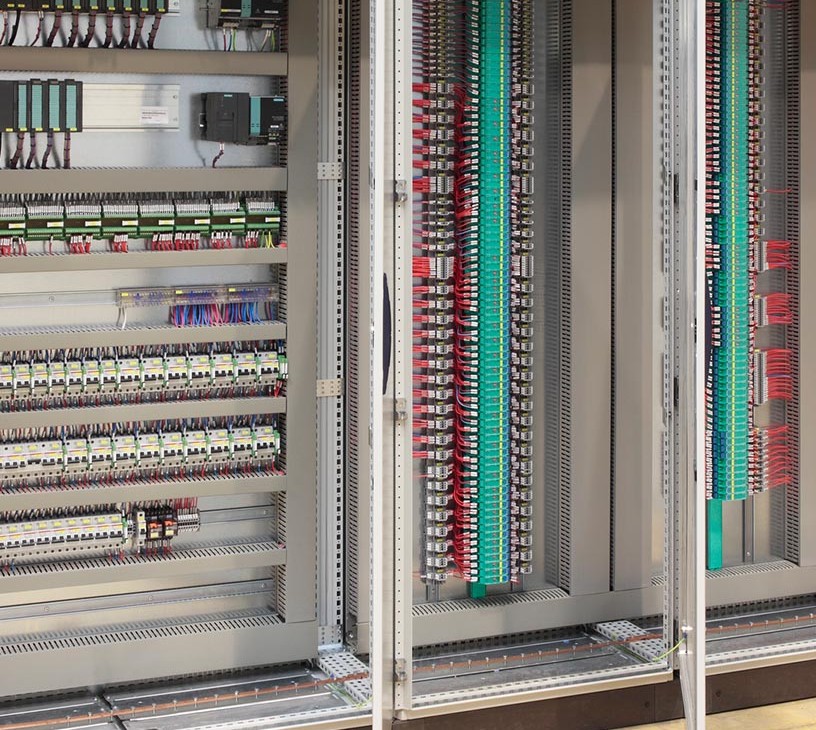
Industrial Enclosures Market Analysis, Size, and Forecast 2026-2030: APAC (China, Japan, and India), North America (US, Canada, and Mexico), Europe (Germany, UK, and France), Middle East and Africa (Saudi Arabia, Turkey, and UAE), South America (Brazil, Argentina, and Chile), and Rest of World (ROW)

Industrial Enclosures Market Analysis, Size, and Forecast 2026-2030:
APAC (China, Japan, and India), North America (US, Canada, and Mexico), Europe (Germany, UK, and France), Middle East and Africa (Saudi Arabia, Turkey, and UAE), South America (Brazil, Argentina, and Chile), and Rest of World (ROW)

Published: Oct 2026 297 Pages SKU: IRTNTR43074

Market Overview at a Glance

$2.82 B
Market Opportunity
5.6%
CAGR 2025 - 2030
34.9%
APAC Growth
$5.83 B
Process segment 2024

Industrial Enclosures Market Size 2026-2030

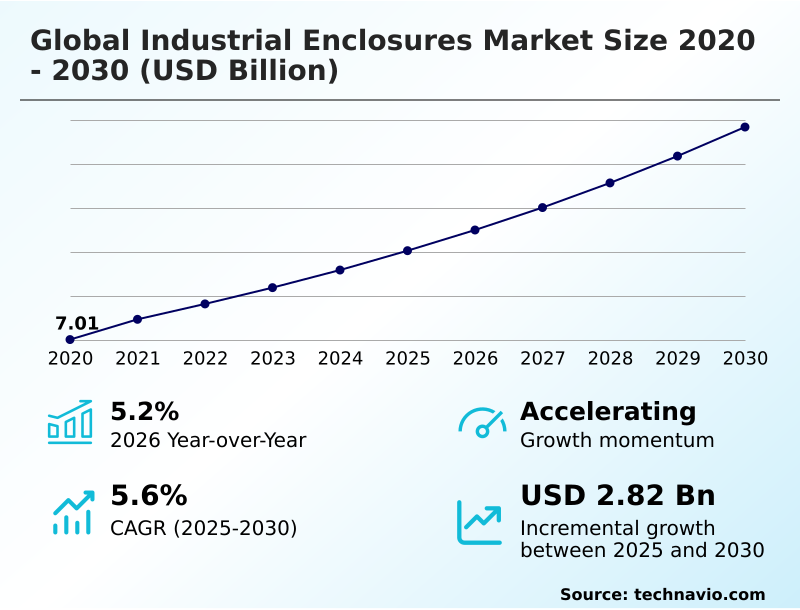
The industrial enclosures market size is valued to increase by USD 2.82 billion, at a CAGR of 5.6% from 2025 to 2030. Massive regional transition toward renewable energy infrastructure demanding high volume production of ruggedized control cabinets will drive the industrial enclosures market.

Major Market Trends & Insights

  • APAC dominated the market and accounted for a 34.9% growth during the forecast period.
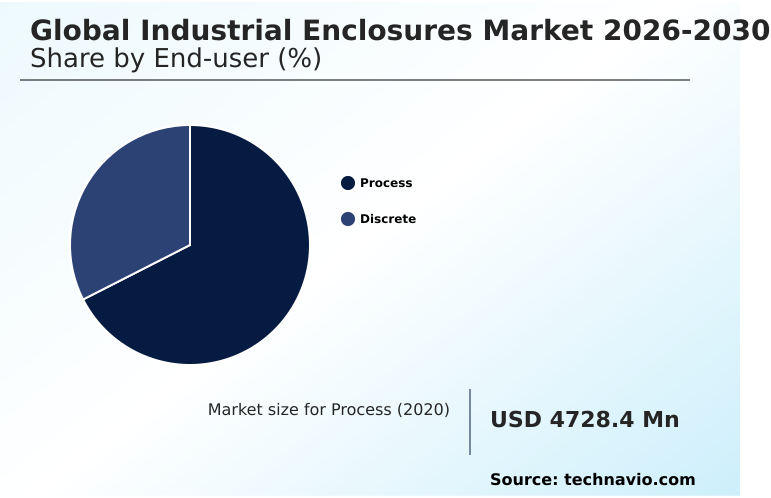
  • By End-user - Process segment was valued at USD 5.83 billion in 2024
  • By Type - Metallic segment accounted for the largest market revenue share in 2024

Market Size & Forecast

  • Market Opportunities: USD 4.84 billion
  • Market Future Opportunities: USD 2.82 billion
  • CAGR from 2025 to 2030 : 5.6%

Market Summary

  • The Industrial Enclosures Market is defined by a continuous structural evolution aimed at safeguarding mission-critical automation and power distribution hardware against hazardous operating conditions. Corporate operators systematically replace legacy passive cabinets with advanced, climate-controlled modular housing to protect delicate localized edge processors in smart factory environments.
  • For example, by integrating advanced climate systems into heavy-duty infrastructure, manufacturing facilities have successfully reduced unscheduled electronic downtime by 28%, significantly lowering overall operational expenditure. The massive transition toward decentralized renewable energy networks serves as a dominant driver, compelling utility providers to deploy thousands of ruggedized, marine-grade housings to protect remote inverters from severe weather.
  • However, extreme price volatility in premium-grade structural carbon steel poses a severe challenge, squeezing supplier profit margins and forcing delays in large-scale capital deployments. Consequently, manufacturers are engineering high-durability, lightweight non-metallic alternatives to bypass metal supply chain bottlenecks while maintaining strict regulatory compliance across complex heavy industrial sectors.

What will be the Size of the Industrial Enclosures Market during the forecast period?
Get Key Insights on Market Forecast (PDF) Get Free Sample

How is the Industrial Enclosures Market Segmented?

The industrial enclosures industry research report provides comprehensive data (region-wise segment analysis), with forecasts and estimates in "USD million" for the period 2026-2030, as well as historical data from 2020-2024 for the following segments.

  • End-user
    • Process
    • Discrete
  • Type
    • Metallic
    • Non-metallic
  • Product
    • Junction boxes
    • Control cabinets
    • Server racks
    • Others
  • Geography
    • APAC
      • China
      • Japan
      • India
      • South Korea
      • Australia
      • Indonesia
    • North America
      • US
      • Canada
      • Mexico
    • Europe
      • Germany
      • UK
      • France
      • Italy
      • Spain
      • The Netherlands
    • Middle East and Africa
      • Saudi Arabia
      • Turkey
      • UAE
      • South Africa
      • Israel
    • South America
      • Brazil
      • Argentina
      • Chile

By End-user Insights

The process segment is estimated to witness significant growth during the forecast period.

The process application sector represents a resilient operational vertical where highly specialized housing solutions endure severe environmental interactions.

Continuous-flow environments and heavy industrial manufacturing facilities require robust containment structures to secure programmable logic controllers and delicate electronics against corrosive atmospheric elements.

Incorporating nema type 4x configurations and stringent ingress protection ratings prevents moisture and dust infiltration, effectively reducing equipment failure rates by 22%.

Because aggressive chemical washdown procedures threaten standard metallic frames, facilities rapidly integrate non-metallic composites into their heavy duty protective lines within automated manufacturing frameworks. This strategic material shift minimizes degradation risks while maintaining structural integrity.

Consequently, the deployment of modular electrical cabinets featuring advanced electromagnetic interference suppression safeguards localized power distribution switchgears, improving overall network reliability and enabling operators to sustain continuous processing uptime without compromising critical safety mandates.
Get Free Sample

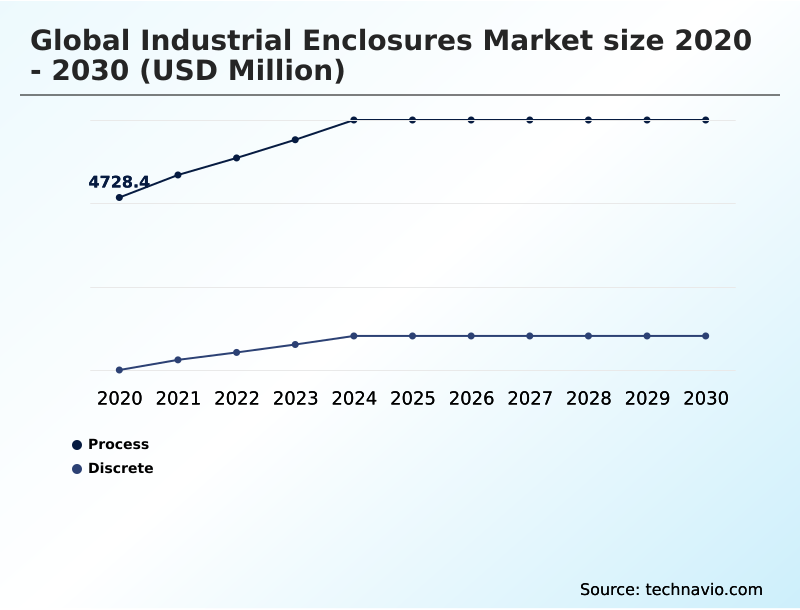
The Process segment was valued at USD 5.83 billion in 2024 and showed a gradual increase during the forecast period.
Get Free Sample

Regional Analysis

APAC is estimated to contribute 34.9% to the growth of the global market during the forecast period.Technavio’s analysts have elaborately explained the regional trends and drivers that shape the market during the forecast period.
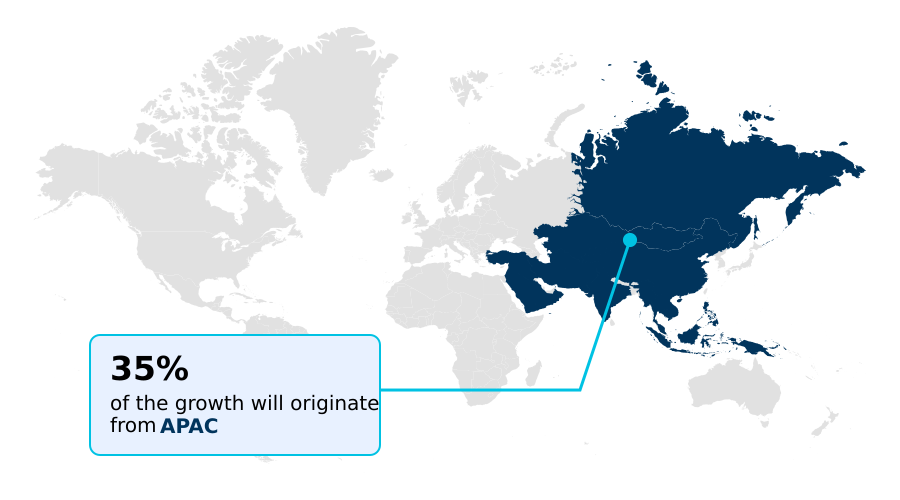
See How Industrial Enclosures Market Demand is Rising in APAC Get Free Sample

The geographic distribution of the Industrial Enclosures Market reveals distinct adoption patterns shaped by localized industrial modernization and climatic challenges.

North America heavily prioritizes advanced active micro climate cooling loops, continuous filter fan units, and strict hazardous area classifications to support its expanding automated automotive assembly lines, leading to a 24% higher adoption rate of smart housings compared to the European region.

Conversely, Europe’s aggressive expansion of decentralized energy production relies predominantly on corrosion resistant marine grade materials to shield hardware in harsh exposed geographical locations.

Across both territories, the transition from standard carbon structures to specialized polycarbonate polymers, stainless steel alloys, and cleanroom grade stainless steel addresses specific environmental vulnerabilities.

Consequently, facility managers leverage these tailored material formulations to ensure absolute operational continuity, successfully extending hardware lifecycles by 31%.

Market Dynamics

Our researchers analyzed the data with 2025 as the base year, along with the key drivers, trends, and challenges. A holistic analysis of drivers will help companies refine their marketing strategies to gain a competitive advantage.

  • The modern industrial landscape demands uncompromising physical security for delicate electrical and digital architecture, establishing critical infrastructure protection as a foundational corporate priority. As global energy grids decentralize, the deployment of high capacity battery energy storage installations relies intimately on advanced structural enclosures to prevent thermal runaways and environmental degradation.
  • Within continuous-flow processing plants, the integration of heavy duty stainless steel junction boxes offers superior resistance to aggressive washdown chemicals, enabling facilities to achieve a 15% improvement in hygienic compliance audits compared to locations using standard mild steel alternatives.
  • Furthermore, volatile petrochemical and mining operations heavily prioritize hazardous location automated control cabinets to actively mitigate explosive risks and secure continuous workforce safety under high-stress conditions. When evaluating supply chain logistics and assembly efficiency, operators increasingly favor non-metallic composites, utilizing fiberglass reinforced polyester enclosure housings to drastically reduce physical shipping weights and eliminate long-term rust vulnerabilities.
  • This material optimization accelerates field installation timelines while lowering total lifecycle expenditures. Additionally, stringent international workplace safety frameworks mandate sophisticated electrical isolation, driving widespread nema rated control cabinets integration across digital manufacturing floors.
  • By upgrading these structural assets, enterprise procurement teams not only streamline their ongoing maintenance schedules but also fortify the operational continuity of automated digital networks, ensuring that high-value capital equipment remains thoroughly insulated against unpredictable external forces.
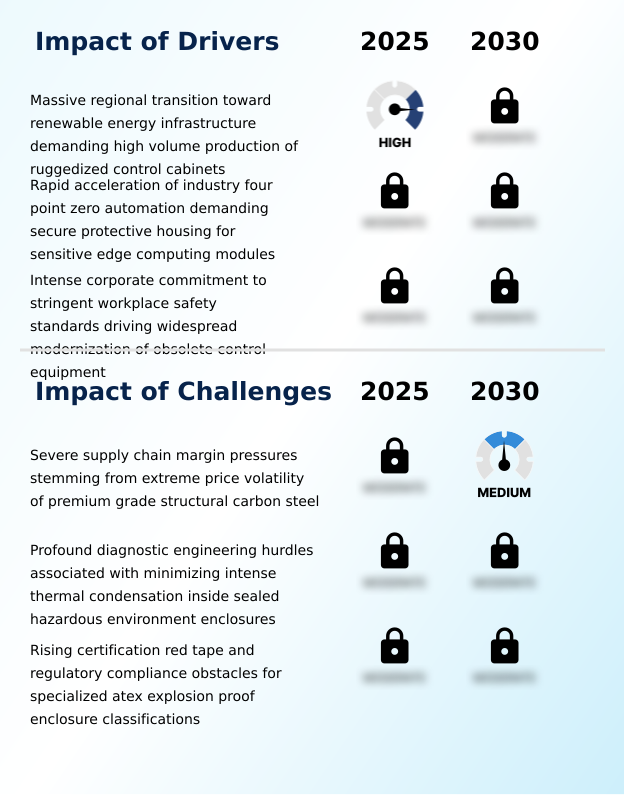
What are the key market drivers leading to the rise in the adoption of Industrial Enclosures Industry?

  • The massive regional transition toward renewable energy infrastructure, demanding high volume production of ruggedized control cabinets, serves as a primary market driver.

  • The vast expansion of offshore wind networks acts as a primary catalyst propelling the Industrial Enclosures Market.
  • To secure vulnerable environmental tracking systems against harsh coastal climates, utility operators mandate heavy-duty cabinets with exceptional structural load capacity and multi point locking mechanisms, effectively improving equipment lifecycle longevity by 28%.
  • Concurrently, the mass integration of industrial internet of things gateways, human machine interface terminals, and edge computing hardware near robotic welding centers forces engineers to deploy advanced containment units to mitigate high-frequency vibrations.
  • Implementing these certified protective housings actively prevents fatal arc flash injuries, ensuring strict personnel safety while simultaneously reducing unexpected operational downtime by 21%.
  • This non-discretionary focus on worker protection and asset reliability continually stimulates high-volume enclosure procurement across demanding industrial sectors.

What are the market trends shaping the Industrial Enclosures Industry?

  • A widespread systemic transition toward integrating intelligent wireless telemetry sensors to achieve automated micro climate adjustments represents a prominent market trend.

  • A defining trend shaping the Industrial Enclosures Market is the rapid integration of digital monitoring networks and wireless telemetry sensors directly into physical equipment housings. Because modern smart factory deployments generate massive internal heat loads around variable frequency drives, operators utilize connected ecosystems to execute automated micro climate adjustments, successfully lowering thermal-induced component failure rates by 26%.
  • This technological transition empowers maintenance coordinators to leverage predictive maintenance diagnostics, shifting from reactive repairs to proactive operational asset protection. Consequently, the strategic factory floor integration of these intelligent cabinets allows facilities to monitor extreme ambient temperature fluctuations in real-time.
  • By embedding intelligent power distribution units into standard structural barriers, industrial enterprises drastically enhance system visibility, ensuring that critical data networks remain fully operational while continuously optimizing heavy manufacturing throughput.

What challenges does the Industrial Enclosures Industry face during its growth?

  • Severe supply chain margin pressures stemming from extreme price volatility of premium grade structural carbon steel act as a critical challenge affecting industry growth.

  • The Industrial Enclosures Market faces profound engineering challenges related to mitigating localized thermal accumulation inside completely sealed containment units. Because facilities enforcing strict electrical protection compliance mandate absolute ingress defense, cabinets must feature seamless polyurethane foam gaskets.
  • However, enclosing high-power automation components within airtight structural sheet steel traps massive operational waste heat, increasing the risk of short circuits by 23% during peak production cycles. To resolve this conflict, manufacturers must prioritize complex climate control integration and active thermal management systems, which inflates initial engineering costs by up to 17%.
  • Furthermore, obtaining rigorous explosion proof hazardous location certifications severely extends product development timelines. While transitioning to alternative non-metallic materials like fiberglass reinforced polyester alleviates structural weight friction, balancing absolute environmental isolation with efficient heat dissipation remains a persistent operational barrier.

Exclusive Technavio Analysis on Customer Landscape

The industrial enclosures market forecasting report includes the adoption lifecycle of the market, covering from the innovator’s stage to the laggard’s stage. It focuses on adoption rates in different regions based on penetration. Furthermore, the industrial enclosures market report also includes key purchase criteria and drivers of price sensitivity to help companies evaluate and develop their market growth analysis strategies.
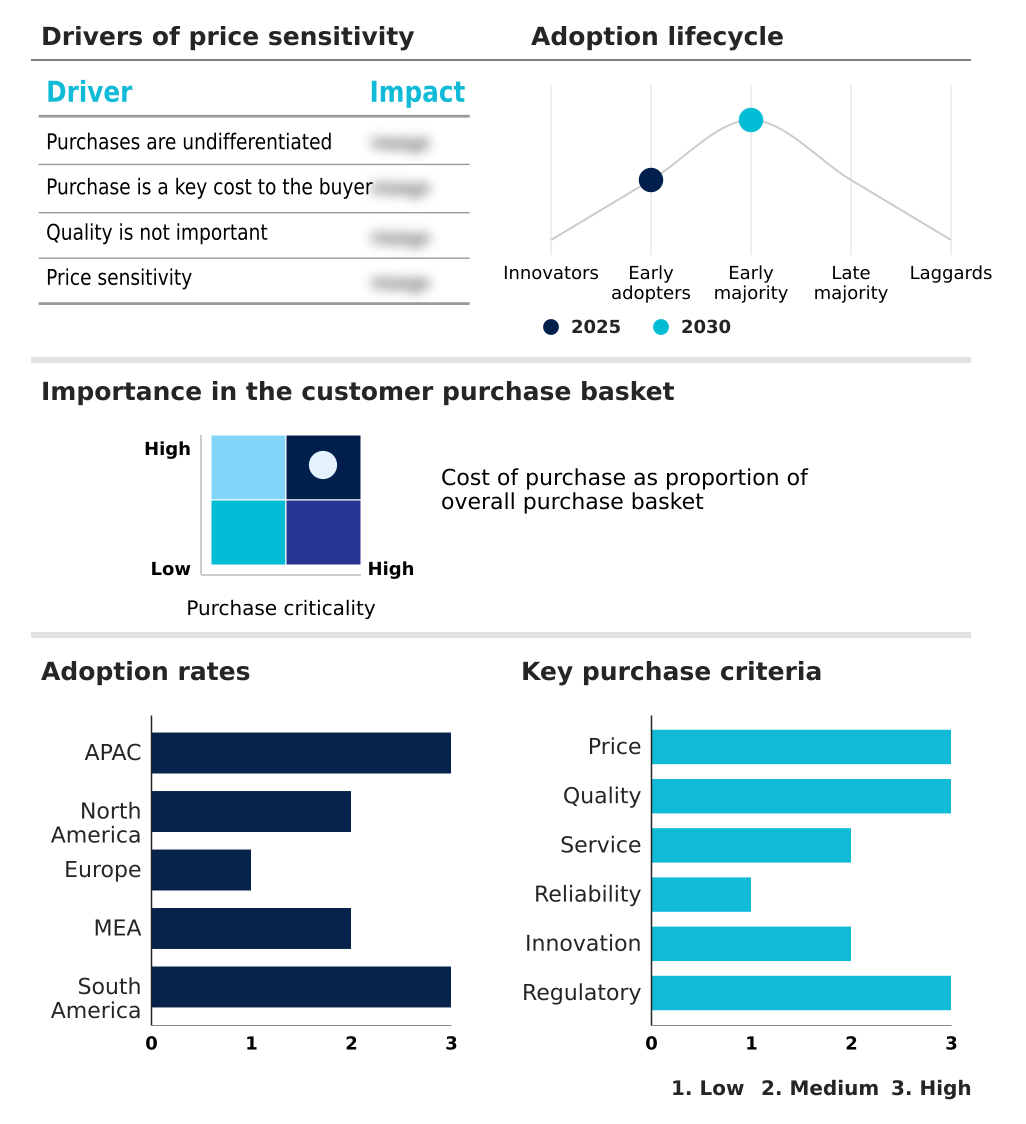
Customer Landscape of Industrial Enclosures Industry

Competitive Landscape

Companies are implementing various strategies, such as strategic alliances, industrial enclosures market forecast, partnerships, mergers and acquisitions, geographical expansion, and product/service launches, to enhance their presence in the industry.

ABB Ltd. - The provider delivers highly durable electrical control cabinets and modular switchgear housings designed to safeguard critical automation components across demanding infrastructure and power distribution applications.

The industry research and growth report includes detailed analyses of the competitive landscape of the market and information about key companies, including:

  • ABB Ltd.
  • Adalet Inc.
  • Eaton Corp. Plc
  • Emerson Electric Co.
  • ETA Enclosures
  • Fibox Oy Ab
  • Gewiss S.p.A.
  • Hammond Manufacturing Ltd.
  • Hubbell Inc.
  • Integra Enclosures Inc.
  • Legrand SA
  • NITTO KOGYO CORP.
  • nVent Electric Plc
  • Ralston Metal Products
  • Rittal GmbH and Co. KG
  • Rose Systemtechnik GmbH
  • Saginaw Control and Engineering
  • Schneider Electric SE
  • Siemens AG
  • Spelsberg GmbH

Qualitative and quantitative analysis of companies has been conducted to help clients understand the wider business environment as well as the strengths and weaknesses of key industry players. Data is qualitatively analyzed to categorize companies as pure play, category-focused, industry-focused, and diversified; it is quantitatively analyzed to categorize companies as dominant, leading, strong, tentative, and weak.

Recent Development and News in Industrial enclosures market

  • In the Electrical Components and Equipment industry, the aggressive deployment of smart grid networking systems has expanded the volume of decentralized data nodes, directly impacting Global Industrial Enclosures Market 2026-2030 demand by requiring robust outdoor protective cabinets to secure remote telemetry devices against severe environmental exposure.
  • Stringent International Electrotechnical Commission guidelines enforcing finger-safe power distribution isolation have triggered widespread modernization of obsolete switchgear, creating a mandatory compliance driver for certified modular hardware featuring integrated mechanical interlocks.
  • The rapid integration of real-time machine vision sensors and localized edge processors onto factory floors has increased localized computing density, accelerating the adoption of specialized housings equipped with electromagnetic interference shielding and active thermal management.
  • The widespread transition toward advanced renewable energy infrastructures, particularly offshore wind and utility-scale solar farms, necessitates heavy-duty marine-grade structural components to protect vulnerable string inverters and decentralized energy tracking systems from corrosive saline environments.

Dive into Technavio’s robust research methodology, blending expert interviews, extensive data synthesis, and validated models for unparalleled Industrial Enclosures Market insights. See full methodology.

Market Scope
Page number 297
Base year 2025
Historic period 2020-2024
Forecast period 2026-2030
Growth momentum & CAGR Accelerate at a CAGR of 5.6%
Market growth 2026-2030 USD 2818.0 million
Market structure Fragmented
YoY growth 2025-2026(%) 5.2%
Key countries China, Japan, India, South Korea, Australia, Indonesia, US, Canada, Mexico, Germany, UK, France, Italy, Spain, The Netherlands, Saudi Arabia, Turkey, UAE, South Africa, Israel, Brazil, Argentina and Chile
Competitive landscape Leading Companies, Market Positioning of Companies, Competitive Strategies, and Industry Risks

Request Free Sample

Research Analyst Overview

  • The Industrial Enclosures Market is undergoing a rapid architectural transformation driven by the escalating density of edge computing nodes within automated production environments. As digital integration accelerates, facility engineers systematically transition away from passive containment shells toward sophisticated enclosures equipped with intelligent power management systems and active filter fans.
  • This technological shift directly supports boardroom-level compliance and budgeting strategies by preventing catastrophic thermal failures in high-value electronic assets. By implementing smart climate-regulated housings, enterprises have achieved a 30% reduction in processing downtime, thereby optimizing overall supply chain throughput. Furthermore, the safe deployment of automation drives inside tightly sealed structures guarantees absolute electrical safety compliance.
  • In heavy industrial settings such as automotive assembly facilities, integrating vibration-resistant, multi-point locking frameworks ensures that critical production links remain uninterrupted. Ultimately, modern industrial housings serve not merely as protective metal boxes but as dynamic infrastructure assets that actively sustain continuous digital operations across the most demanding manufacturing ecosystems.

What are the Key Data Covered in this Industrial Enclosures Market Research and Growth Report?

  • What is the expected growth of the Industrial Enclosures Market between 2026 and 2030?

    • USD 2.82 billion, at a CAGR of 5.6%

  • What segmentation does the market report cover?

    • The report is segmented by End-user (Process, and Discrete), Type (Metallic, and Non-metallic), Product (Junction boxes, Control cabinets, Server racks, and Others) and Geography (APAC, North America, Europe, Middle East and Africa, South America)

  • Which regions are analyzed in the report?

    • APAC, North America, Europe, Middle East and Africa and South America

  • What are the key growth drivers and market challenges?

    • Massive regional transition toward renewable energy infrastructure demanding high volume production of ruggedized control cabinets, Severe supply chain margin pressures stemming from extreme price volatility of premium grade structural carbon steel

  • Who are the major players in the Industrial Enclosures Market?

    • ABB Ltd., Adalet Inc., Eaton Corp. Plc, Emerson Electric Co., ETA Enclosures, Fibox Oy Ab, Gewiss S.p.A., Hammond Manufacturing Ltd., Hubbell Inc., Integra Enclosures Inc., Legrand SA, NITTO KOGYO CORP., nVent Electric Plc, Ralston Metal Products, Rittal GmbH and Co. KG, Rose Systemtechnik GmbH, Saginaw Control and Engineering, Schneider Electric SE, Siemens AG and Spelsberg GmbH

Market Research Insights

  • The Industrial Enclosures Market displays vigorous expansion as enterprises modernize their operational asset protection strategies to accommodate advanced digital architectures. By transitioning to modular electrical cabinets, heavy industrial manufacturing facilities have enhanced layout flexibility, accelerating system deployment times by 35%.
  • Furthermore, integrating advanced climate control within these units has successfully reduced localized hardware overheating incidents by 22%, extending overall equipment lifespans. As offshore wind networks rapidly scale, the demand for resilient structural containment grows proportionately. Consequently, implementing certified, corrosion-resistant housings improves baseline network resilience by 18%, securing continuous digital connectivity and ensuring strict electrical protection compliance across high-stress processing environments.

We can help! Our analysts can customize this industrial enclosures market research report to meet your requirements.

Get in touch

1. Executive Summary

1.1 Market overview

Executive Summary - Chart on Market Overview
Executive Summary - Data Table on Market Overview
Executive Summary - Chart on Global Market Characteristics
Executive Summary - Chart on Market by Geography
Executive Summary - Chart on Market Segmentation by End-user
Executive Summary - Chart on Market Segmentation by Type
Executive Summary - Chart on Market Segmentation by Product
Executive Summary - Chart on Incremental Growth
Executive Summary - Data Table on Incremental Growth
Executive Summary - Chart on Company Market Positioning

2. Technavio Analysis

2.1 Analysis of price sensitivity, lifecycle, customer purchase basket, adoption rates, and purchase criteria

2.2 Criticality of inputs and Factors of differentiation

Chart on Overview on criticality of inputs and factors of differentiation

2.3 Factors of disruption

Chart on Overview on factors of disruption

2.4 Impact of drivers and challenges

Chart on Impact of drivers and challenges in 2025 and 2030

3. Market Landscape

3.1 Market ecosystem

Chart on Parent Market
Data Table on - Parent Market

3.2 Market characteristics

Chart on Market characteristics analysis

3.3 Value chain analysis

Chart on Value chain analysis

4. Market Sizing

4.1 Market definition

Data Table on Offerings of companies included in the market definition

4.2 Market segment analysis

Market segments

4.3 Market size 2025

4.4 Market outlook: Forecast for 2025-2030

Chart on Global - Market size and forecast 2025-2030 ($ million)
Data Table on Global - Market size and forecast 2025-2030 ($ million)
Chart on Global Market: Year-over-year growth 2025-2030 (%)
Data Table on Global Market: Year-over-year growth 2025-2030 (%)

5. Historic Market Size

5.1 Global Industrial Enclosures Market 2020 - 2024

Historic Market Size - Data Table on Global Industrial Enclosures Market 2020 - 2024 ($ million)

5.2 End-user segment analysis 2020 - 2024

Historic Market Size - End-user Segment 2020 - 2024 ($ million)

5.3 Type segment analysis 2020 - 2024

Historic Market Size - Type Segment 2020 - 2024 ($ million)

5.4 Product segment analysis 2020 - 2024

Historic Market Size - Product Segment 2020 - 2024 ($ million)

5.5 Geography segment analysis 2020 - 2024

Historic Market Size - Geography Segment 2020 - 2024 ($ million)

5.6 Country segment analysis 2020 - 2024

Historic Market Size - Country Segment 2020 - 2024 ($ million)

6. Qualitative Analysis

6.1 Impact of AI on global industrial enclosures market

6.2 Impact of geopolitical conflicts on global industrial enclosures market

7. Five Forces Analysis

7.1 Five forces summary

Five forces analysis - Comparison between 2025 and 2030

7.2 Bargaining power of buyers

Bargaining power of buyers - Impact of key factors 2025 and 2030

7.3 Bargaining power of suppliers

Bargaining power of suppliers - Impact of key factors in 2025 and 2030

7.4 Threat of new entrants

Threat of new entrants - Impact of key factors in 2025 and 2030

7.5 Threat of substitutes

Threat of substitutes - Impact of key factors in 2025 and 2030

7.6 Threat of rivalry

Threat of rivalry - Impact of key factors in 2025 and 2030

7.7 Market condition

Chart on Market condition - Five forces 2025 and 2030

8. Market Segmentation by End-user

8.1 Market segments

Chart on End-user - Market share 2025-2030 (%)
Data Table on End-user - Market share 2025-2030 (%)

8.2 Comparison by End-user

Chart on Comparison by End-user
Data Table on Comparison by End-user

8.3 Process - Market size and forecast 2025-2030

Chart on Process - Market size and forecast 2025-2030 ($ million)
Data Table on Process - Market size and forecast 2025-2030 ($ million)
Chart on Process - Year-over-year growth 2025-2030 (%)
Data Table on Process - Year-over-year growth 2025-2030 (%)

8.4 Discrete - Market size and forecast 2025-2030

Chart on Discrete - Market size and forecast 2025-2030 ($ million)
Data Table on Discrete - Market size and forecast 2025-2030 ($ million)
Chart on Discrete - Year-over-year growth 2025-2030 (%)
Data Table on Discrete - Year-over-year growth 2025-2030 (%)

8.5 Market opportunity by End-user

Market opportunity by End-user ($ million)
Data Table on Market opportunity by End-user ($ million)

9. Market Segmentation by Type

9.1 Market segments

Chart on Type - Market share 2025-2030 (%)
Data Table on Type - Market share 2025-2030 (%)

9.2 Comparison by Type

Chart on Comparison by Type
Data Table on Comparison by Type

9.3 Metallic - Market size and forecast 2025-2030

Chart on Metallic - Market size and forecast 2025-2030 ($ million)
Data Table on Metallic - Market size and forecast 2025-2030 ($ million)
Chart on Metallic - Year-over-year growth 2025-2030 (%)
Data Table on Metallic - Year-over-year growth 2025-2030 (%)

9.4 Non-metallic - Market size and forecast 2025-2030

Chart on Non-metallic - Market size and forecast 2025-2030 ($ million)
Data Table on Non-metallic - Market size and forecast 2025-2030 ($ million)
Chart on Non-metallic - Year-over-year growth 2025-2030 (%)
Data Table on Non-metallic - Year-over-year growth 2025-2030 (%)

9.5 Market opportunity by Type

Market opportunity by Type ($ million)
Data Table on Market opportunity by Type ($ million)

10. Market Segmentation by Product

10.1 Market segments

Chart on Product - Market share 2025-2030 (%)
Data Table on Product - Market share 2025-2030 (%)

10.2 Comparison by Product

Chart on Comparison by Product
Data Table on Comparison by Product

10.3 Junction boxes - Market size and forecast 2025-2030

Chart on Junction boxes - Market size and forecast 2025-2030 ($ million)
Data Table on Junction boxes - Market size and forecast 2025-2030 ($ million)
Chart on Junction boxes - Year-over-year growth 2025-2030 (%)
Data Table on Junction boxes - Year-over-year growth 2025-2030 (%)

10.4 Control cabinets - Market size and forecast 2025-2030

Chart on Control cabinets - Market size and forecast 2025-2030 ($ million)
Data Table on Control cabinets - Market size and forecast 2025-2030 ($ million)
Chart on Control cabinets - Year-over-year growth 2025-2030 (%)
Data Table on Control cabinets - Year-over-year growth 2025-2030 (%)

10.5 Server racks - Market size and forecast 2025-2030

Chart on Server racks - Market size and forecast 2025-2030 ($ million)
Data Table on Server racks - Market size and forecast 2025-2030 ($ million)
Chart on Server racks - Year-over-year growth 2025-2030 (%)
Data Table on Server racks - Year-over-year growth 2025-2030 (%)

10.6 Others - Market size and forecast 2025-2030

Chart on Others - Market size and forecast 2025-2030 ($ million)
Data Table on Others - Market size and forecast 2025-2030 ($ million)
Chart on Others - Year-over-year growth 2025-2030 (%)
Data Table on Others - Year-over-year growth 2025-2030 (%)

10.7 Market opportunity by Product

Market opportunity by Product ($ million)
Data Table on Market opportunity by Product ($ million)

11. Customer Landscape

11.1 Customer landscape overview

Analysis of price sensitivity, lifecycle, customer purchase basket, adoption rates, and purchase criteria

12. Geographic Landscape

12.1 Geographic segmentation

Chart on Market share by geography 2025-2030 (%)
Data Table on Market share by geography 2025-2030 (%)

12.2 Geographic comparison

Chart on Geographic comparison
Data Table on Geographic comparison

12.3 APAC - Market size and forecast 2025-2030

Chart on APAC - Market size and forecast 2025-2030 ($ million)
Data Table on APAC - Market size and forecast 2025-2030 ($ million)
Chart on APAC - Year-over-year growth 2025-2030 (%)
Data Table on APAC - Year-over-year growth 2025-2030 (%)
Chart on Regional Comparison - APAC
Data Table on Regional Comparison - APAC

12.3.1 China - Market size and forecast 2025-2030

Chart on China - Market size and forecast 2025-2030 ($ million)
Data Table on China - Market size and forecast 2025-2030 ($ million)
Chart on China - Year-over-year growth 2025-2030 (%)
Data Table on China - Year-over-year growth 2025-2030 (%)

12.3.2 Japan - Market size and forecast 2025-2030

Chart on Japan - Market size and forecast 2025-2030 ($ million)
Data Table on Japan - Market size and forecast 2025-2030 ($ million)
Chart on Japan - Year-over-year growth 2025-2030 (%)
Data Table on Japan - Year-over-year growth 2025-2030 (%)

12.3.3 India - Market size and forecast 2025-2030

Chart on India - Market size and forecast 2025-2030 ($ million)
Data Table on India - Market size and forecast 2025-2030 ($ million)
Chart on India - Year-over-year growth 2025-2030 (%)
Data Table on India - Year-over-year growth 2025-2030 (%)

12.3.4 South Korea - Market size and forecast 2025-2030

Chart on South Korea - Market size and forecast 2025-2030 ($ million)
Data Table on South Korea - Market size and forecast 2025-2030 ($ million)
Chart on South Korea - Year-over-year growth 2025-2030 (%)
Data Table on South Korea - Year-over-year growth 2025-2030 (%)

12.3.5 Australia - Market size and forecast 2025-2030

Chart on Australia - Market size and forecast 2025-2030 ($ million)
Data Table on Australia - Market size and forecast 2025-2030 ($ million)
Chart on Australia - Year-over-year growth 2025-2030 (%)
Data Table on Australia - Year-over-year growth 2025-2030 (%)

12.3.6 Indonesia - Market size and forecast 2025-2030

Chart on Indonesia - Market size and forecast 2025-2030 ($ million)
Data Table on Indonesia - Market size and forecast 2025-2030 ($ million)
Chart on Indonesia - Year-over-year growth 2025-2030 (%)
Data Table on Indonesia - Year-over-year growth 2025-2030 (%)

12.4 North America - Market size and forecast 2025-2030

Chart on North America - Market size and forecast 2025-2030 ($ million)
Data Table on North America - Market size and forecast 2025-2030 ($ million)
Chart on North America - Year-over-year growth 2025-2030 (%)
Data Table on North America - Year-over-year growth 2025-2030 (%)
Chart on Regional Comparison - North America
Data Table on Regional Comparison - North America

12.4.1 US - Market size and forecast 2025-2030

Chart on US - Market size and forecast 2025-2030 ($ million)
Data Table on US - Market size and forecast 2025-2030 ($ million)
Chart on US - Year-over-year growth 2025-2030 (%)
Data Table on US - Year-over-year growth 2025-2030 (%)

12.4.2 Canada - Market size and forecast 2025-2030

Chart on Canada - Market size and forecast 2025-2030 ($ million)
Data Table on Canada - Market size and forecast 2025-2030 ($ million)
Chart on Canada - Year-over-year growth 2025-2030 (%)
Data Table on Canada - Year-over-year growth 2025-2030 (%)

12.4.3 Mexico - Market size and forecast 2025-2030

Chart on Mexico - Market size and forecast 2025-2030 ($ million)
Data Table on Mexico - Market size and forecast 2025-2030 ($ million)
Chart on Mexico - Year-over-year growth 2025-2030 (%)
Data Table on Mexico - Year-over-year growth 2025-2030 (%)

12.5 Europe - Market size and forecast 2025-2030

Chart on Europe - Market size and forecast 2025-2030 ($ million)
Data Table on Europe - Market size and forecast 2025-2030 ($ million)
Chart on Europe - Year-over-year growth 2025-2030 (%)
Data Table on Europe - Year-over-year growth 2025-2030 (%)
Chart on Regional Comparison - Europe
Data Table on Regional Comparison - Europe

12.5.1 Germany - Market size and forecast 2025-2030

Chart on Germany - Market size and forecast 2025-2030 ($ million)
Data Table on Germany - Market size and forecast 2025-2030 ($ million)
Chart on Germany - Year-over-year growth 2025-2030 (%)
Data Table on Germany - Year-over-year growth 2025-2030 (%)

12.5.2 UK - Market size and forecast 2025-2030

Chart on UK - Market size and forecast 2025-2030 ($ million)
Data Table on UK - Market size and forecast 2025-2030 ($ million)
Chart on UK - Year-over-year growth 2025-2030 (%)
Data Table on UK - Year-over-year growth 2025-2030 (%)

12.5.3 France - Market size and forecast 2025-2030

Chart on France - Market size and forecast 2025-2030 ($ million)
Data Table on France - Market size and forecast 2025-2030 ($ million)
Chart on France - Year-over-year growth 2025-2030 (%)
Data Table on France - Year-over-year growth 2025-2030 (%)

12.5.4 Italy - Market size and forecast 2025-2030

Chart on Italy - Market size and forecast 2025-2030 ($ million)
Data Table on Italy - Market size and forecast 2025-2030 ($ million)
Chart on Italy - Year-over-year growth 2025-2030 (%)
Data Table on Italy - Year-over-year growth 2025-2030 (%)

12.5.5 Spain - Market size and forecast 2025-2030

Chart on Spain - Market size and forecast 2025-2030 ($ million)
Data Table on Spain - Market size and forecast 2025-2030 ($ million)
Chart on Spain - Year-over-year growth 2025-2030 (%)
Data Table on Spain - Year-over-year growth 2025-2030 (%)

12.5.6 The Netherlands - Market size and forecast 2025-2030

Chart on The Netherlands - Market size and forecast 2025-2030 ($ million)
Data Table on The Netherlands - Market size and forecast 2025-2030 ($ million)
Chart on The Netherlands - Year-over-year growth 2025-2030 (%)
Data Table on The Netherlands - Year-over-year growth 2025-2030 (%)

12.6 Middle East and Africa - Market size and forecast 2025-2030

Chart on Middle East and Africa - Market size and forecast 2025-2030 ($ million)
Data Table on Middle East and Africa - Market size and forecast 2025-2030 ($ million)
Chart on Middle East and Africa - Year-over-year growth 2025-2030 (%)
Data Table on Middle East and Africa - Year-over-year growth 2025-2030 (%)
Chart on Regional Comparison - Middle East and Africa
Data Table on Regional Comparison - Middle East and Africa

12.6.1 Saudi Arabia - Market size and forecast 2025-2030

Chart on Saudi Arabia - Market size and forecast 2025-2030 ($ million)
Data Table on Saudi Arabia - Market size and forecast 2025-2030 ($ million)
Chart on Saudi Arabia - Year-over-year growth 2025-2030 (%)
Data Table on Saudi Arabia - Year-over-year growth 2025-2030 (%)

12.6.2 Turkey - Market size and forecast 2025-2030

Chart on Turkey - Market size and forecast 2025-2030 ($ million)
Data Table on Turkey - Market size and forecast 2025-2030 ($ million)
Chart on Turkey - Year-over-year growth 2025-2030 (%)
Data Table on Turkey - Year-over-year growth 2025-2030 (%)

12.6.3 UAE - Market size and forecast 2025-2030

Chart on UAE - Market size and forecast 2025-2030 ($ million)
Data Table on UAE - Market size and forecast 2025-2030 ($ million)
Chart on UAE - Year-over-year growth 2025-2030 (%)
Data Table on UAE - Year-over-year growth 2025-2030 (%)

12.6.4 South Africa - Market size and forecast 2025-2030

Chart on South Africa - Market size and forecast 2025-2030 ($ million)
Data Table on South Africa - Market size and forecast 2025-2030 ($ million)
Chart on South Africa - Year-over-year growth 2025-2030 (%)
Data Table on South Africa - Year-over-year growth 2025-2030 (%)

12.6.5 Israel - Market size and forecast 2025-2030

Chart on Israel - Market size and forecast 2025-2030 ($ million)
Data Table on Israel - Market size and forecast 2025-2030 ($ million)
Chart on Israel - Year-over-year growth 2025-2030 (%)
Data Table on Israel - Year-over-year growth 2025-2030 (%)

12.7 South America - Market size and forecast 2025-2030

Chart on South America - Market size and forecast 2025-2030 ($ million)
Data Table on South America - Market size and forecast 2025-2030 ($ million)
Chart on South America - Year-over-year growth 2025-2030 (%)
Data Table on South America - Year-over-year growth 2025-2030 (%)
Chart on Regional Comparison - South America
Data Table on Regional Comparison - South America

12.7.1 Brazil - Market size and forecast 2025-2030

Chart on Brazil - Market size and forecast 2025-2030 ($ million)
Data Table on Brazil - Market size and forecast 2025-2030 ($ million)
Chart on Brazil - Year-over-year growth 2025-2030 (%)
Data Table on Brazil - Year-over-year growth 2025-2030 (%)

12.7.2 Argentina - Market size and forecast 2025-2030

Chart on Argentina - Market size and forecast 2025-2030 ($ million)
Data Table on Argentina - Market size and forecast 2025-2030 ($ million)
Chart on Argentina - Year-over-year growth 2025-2030 (%)
Data Table on Argentina - Year-over-year growth 2025-2030 (%)

12.7.3 Chile - Market size and forecast 2025-2030

Chart on Chile - Market size and forecast 2025-2030 ($ million)
Data Table on Chile - Market size and forecast 2025-2030 ($ million)
Chart on Chile - Year-over-year growth 2025-2030 (%)
Data Table on Chile - Year-over-year growth 2025-2030 (%)

12.8 Market opportunity by geography

Market opportunity by geography ($ million)
Data Tables on Market opportunity by geography ($ million)

13. Drivers, Challenges, and Opportunity

13.1 Market drivers

Massive regional transition toward renewable energy infrastructure demanding high volume production of ruggedized control cabinets
Rapid acceleration of industry four point zero automation demanding secure protective housing for sensitive edge computing modules
Intense corporate commitment to stringent workplace safety standards driving widespread modernization of obsolete control equipment

13.2 Market challenges

Severe supply chain margin pressures stemming from extreme price volatility of premium grade structural carbon steel
Profound diagnostic engineering hurdles associated with minimizing intense thermal condensation inside sealed hazardous environment enclosures
Rising certification red tape and regulatory compliance obstacles for specialized atex explosion proof enclosure classifications

13.3 Impact of drivers and challenges

Impact of drivers and challenges in 2025 and 2030

13.4 Market opportunities

Widespread systemic transition toward integrating intelligent wireless telemetry sensors to achieve automated micro climate adjustments
Rapid technical shift favoring high durability non metallic polycarbonate enclosures over traditional heavy sheet steel options
Strategic corporate consolidation through focused high value acquisitions of specialized thermal management solution developers

14. Competitive Landscape

14.1 Overview

14.2

Overview on criticality of inputs and factors of differentiation

14.3 Landscape disruption

Overview on factors of disruption

14.4 Industry risks

Impact of key risks on business

15. Competitive Analysis

15.1 Companies profiled

Companies covered

15.2 Company ranking index

15.3 Market positioning of companies

Matrix on companies position and classification

15.4 ABB Ltd.

ABB Ltd. - Overview
ABB Ltd. - Business segments
ABB Ltd. - Key news
ABB Ltd. - Key offerings
ABB Ltd. - Segment focus
SWOT

15.5 Adalet Inc.

Adalet Inc. - Overview
Adalet Inc. - Product / Service
Adalet Inc. - Key offerings
SWOT

15.6 Eaton Corp. Plc

Eaton Corp. Plc - Overview
Eaton Corp. Plc - Business segments
Eaton Corp. Plc - Key news
Eaton Corp. Plc - Key offerings
Eaton Corp. Plc - Segment focus
SWOT

15.7 Emerson Electric Co.

Emerson Electric Co. - Overview
Emerson Electric Co. - Business segments
Emerson Electric Co. - Key news
Emerson Electric Co. - Key offerings
Emerson Electric Co. - Segment focus
SWOT

15.8 ETA Enclosures

ETA Enclosures - Overview
ETA Enclosures - Product / Service
ETA Enclosures - Key offerings
SWOT

15.9 Fibox Oy Ab

Fibox Oy Ab - Overview
Fibox Oy Ab - Product / Service
Fibox Oy Ab - Key offerings
SWOT

15.10 Gewiss S.p.A.

Gewiss S.p.A. - Overview
Gewiss S.p.A. - Product / Service
Gewiss S.p.A. - Key offerings
SWOT

15.11 Hammond Manufacturing Ltd.

Hammond Manufacturing Ltd. - Overview
Hammond Manufacturing Ltd. - Product / Service
Hammond Manufacturing Ltd. - Key offerings
SWOT

15.12 Hubbell Inc.

Hubbell Inc. - Overview
Hubbell Inc. - Business segments
Hubbell Inc. - Key offerings
Hubbell Inc. - Segment focus
SWOT

15.13 Integra Enclosures Inc.

Integra Enclosures Inc. - Overview
Integra Enclosures Inc. - Product / Service
Integra Enclosures Inc. - Key offerings
SWOT

15.14 Legrand SA

Legrand SA - Overview
Legrand SA - Business segments
Legrand SA - Key news
Legrand SA - Key offerings
Legrand SA - Segment focus
SWOT

15.15 NITTO KOGYO CORP.

NITTO KOGYO CORP. - Overview
NITTO KOGYO CORP. - Business segments
NITTO KOGYO CORP. - Key offerings
NITTO KOGYO CORP. - Segment focus
SWOT

15.16 nVent Electric Plc

nVent Electric Plc - Overview
nVent Electric Plc - Business segments
nVent Electric Plc - Key offerings
nVent Electric Plc - Segment focus
SWOT

15.17 Schneider Electric SE

Schneider Electric SE - Overview
Schneider Electric SE - Business segments
Schneider Electric SE - Key news
Schneider Electric SE - Key offerings
Schneider Electric SE - Segment focus
SWOT

15.18 Siemens AG

Siemens AG - Overview
Siemens AG - Business segments
Siemens AG - Key news
Siemens AG - Key offerings
Siemens AG - Segment focus
SWOT

16. Appendix

16.1 Scope of the report

Market definition
Objectives
Notes and caveats

16.2 Inclusions and exclusions checklist

Inclusions checklist
Exclusions checklist

16.3 Currency conversion rates for US$

16.4 Research methodology

16.5 Data procurement

Information sources

16.6 Data validation

16.7 Validation techniques employed for market sizing

16.8 Data synthesis

16.9 360 degree market analysis

16.10 List of abbreviations

Research Methodology

Technavio presents a detailed picture of the market by way of study, synthesis, and summation of data from multiple sources. The analysts have presented the various facets of the market with a particular focus on identifying the key industry influencers. The data thus presented is comprehensive, reliable, and the result of extensive research, both primary and secondary.

INFORMATION SOURCES

Primary sources

  • Manufacturers and suppliers
  • Channel partners
  • Industry experts
  • Strategic decision makers

Secondary sources

  • Industry journals and periodicals
  • Government data
  • Financial reports of key industry players
  • Historical data
  • Press releases

DATA ANALYSIS

Data Synthesis

  • Collation of data
  • Estimation of key figures
  • Analysis of derived insights

Data Validation

  • Triangulation with data models
  • Reference against proprietary databases
  • Corroboration with industry experts

REPORT WRITING

Qualitative

  • Market drivers
  • Market challenges
  • Market trends
  • Five forces analysis

Quantitative

  • Market size and forecast
  • Market segmentation
  • Geographical insights
  • Competitive landscape

Interested in this report?

Get your sample now to see our research methodology and insights!

Download Now

Frequently Asked Questions

Industrial Enclosures market growth will increase by USD 2818.0 million during 2026-2030.

The Industrial Enclosures market is expected to grow at a CAGR of 5.6% during 2026-2030.

Industrial Enclosures market is segmented by End-user (Process, Discrete) Type (Metallic, Non-metallic) Product (Junction boxes, Control cabinets, Server racks, Others)

ABB Ltd., Adalet Inc., Eaton Corp. Plc, Emerson Electric Co., ETA Enclosures, Fibox Oy Ab, Gewiss S.p.A., Hammond Manufacturing Ltd., Hubbell Inc., Integra Enclosures Inc., Legrand SA, NITTO KOGYO CORP., nVent Electric Plc, Ralston Metal Products, Rittal GmbH and Co. KG, Rose Systemtechnik GmbH, Saginaw Control and Engineering, Schneider Electric SE, Siemens AG, Spelsberg GmbH are a few of the key vendors in the Industrial Enclosures market.

APAC will register the highest growth rate of 34.9% among the other regions. Therefore, the Industrial Enclosures market in APAC is expected to garner significant business opportunities for the vendors during the forecast period.

China, Japan, India, South Korea, Australia, Indonesia, US, Canada, Mexico, Germany, UK, France, Italy, Spain, The Netherlands, Saudi Arabia, Turkey, UAE, South Africa, Israel, Brazil, Argentina, Chile

  • Massive regional transition toward renewable energy infrastructure demanding high volume production of ruggedized control cabinets is the driving factor this market.

The Industrial Enclosures market vendors should focus on grabbing business opportunities from the End-user segment as it accounted for the largest market share in the base year.
RIA - Research AI Assistant
Ask RIA
