Industrial Hemp Market Size 2026-2030
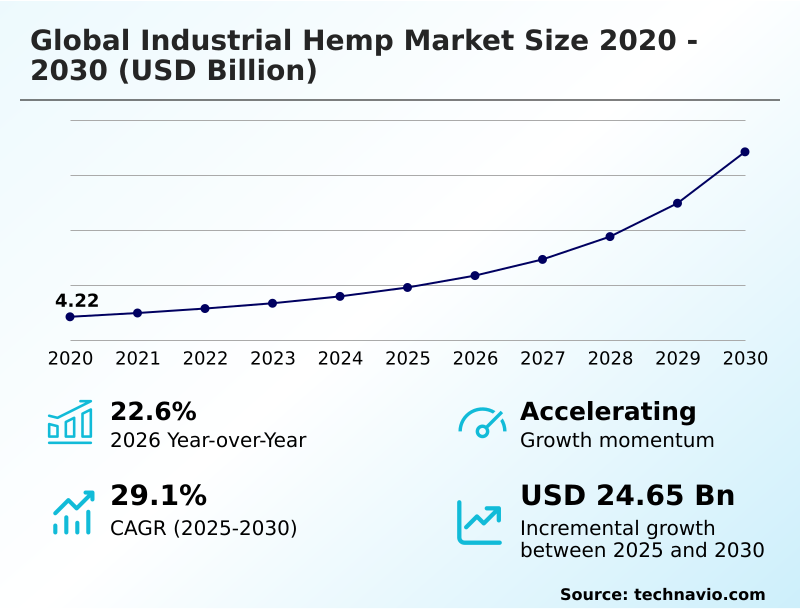
The industrial hemp market size is valued to increase by USD 24.65 billion, at a CAGR of 29.1% from 2025 to 2030. Growing demand for sustainable natural fibers will drive the industrial hemp market.
Major Market Trends & Insights
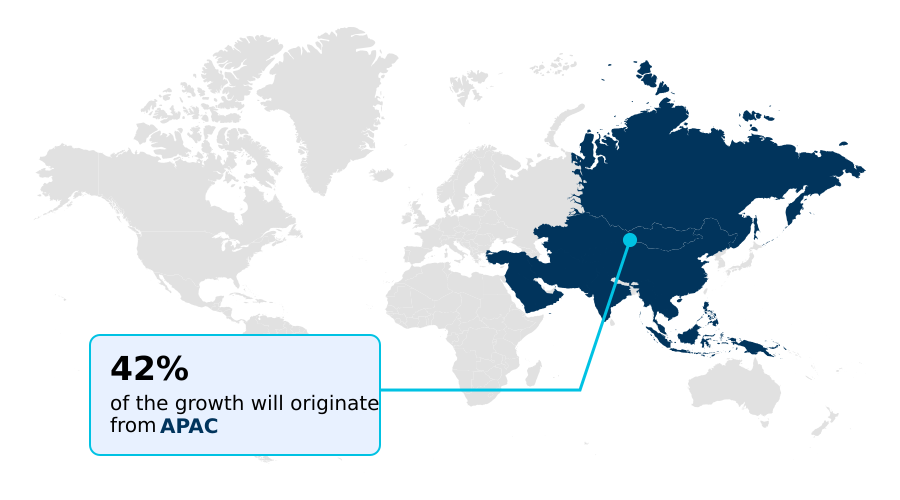
- APAC dominated the market and accounted for a 41.8% growth during the forecast period.
- By Product - Fiber segment was valued at USD 2.89 billion in 2024
- By Application - Textile segment accounted for the largest market revenue share in 2024
Market Size & Forecast
- Market Opportunities: USD 29.99 billion
- Market Future Opportunities: USD 24.65 billion
- CAGR from 2025 to 2030 : 29.1%
Market Summary
- The industrial hemp market is undergoing a significant transformation, moving from a niche agricultural product to a mainstream industrial commodity. This evolution is driven by a convergence of factors, including the increasing legalization of low-THC cannabis sativa cultivation, rising consumer demand for sustainable products, and technological advancements in processing.
- Key trends include the rapid diversification of applications into food and wellness, where hemp is valued as a plant-based protein source, and the expanding use of its fibers as sustainable fiber alternatives in textiles and biocomposites.
- For instance, an automotive supplier aiming to reduce its carbon footprint may replace fiberglass components with hemp-based biocomposites, a decision influenced by both regulatory pressures and market demand for eco-friendly vehicles. However, the industry grapples with significant challenges, notably inconsistent regulatory frameworks across jurisdictions and a deficit in large-scale industrial processing infrastructure for hemp fiber decortication.
- Overcoming these hurdles is essential for stabilizing the supply chain and unlocking the market's full potential as a cornerstone of the circular economy.
What will be the Size of the Industrial Hemp Market during the forecast period?
Get Key Insights on Market Forecast (PDF) Get Free Sample
How is the Industrial Hemp Market Segmented?
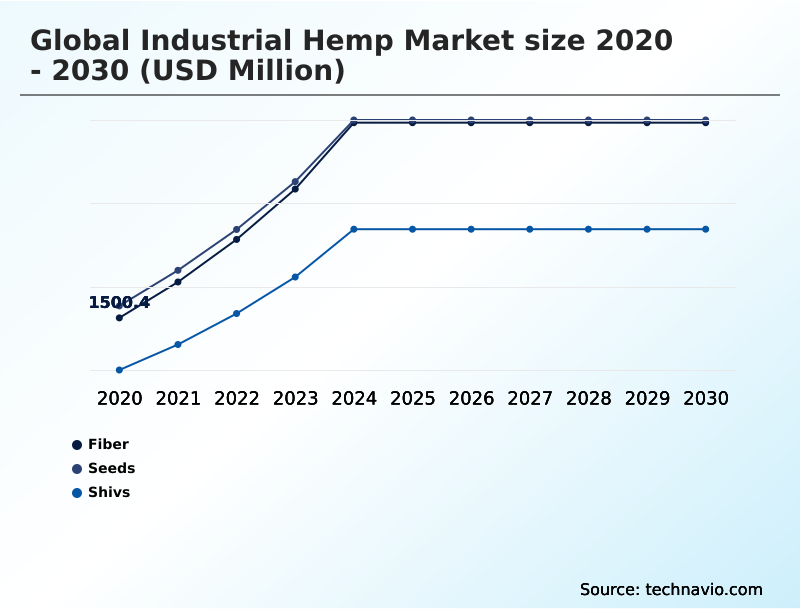
The industrial hemp industry research report provides comprehensive data (region-wise segment analysis), with forecasts and estimates in "USD million" for the period 2026-2030, as well as historical data from 2020-2024 for the following segments.
- Product
- Fiber
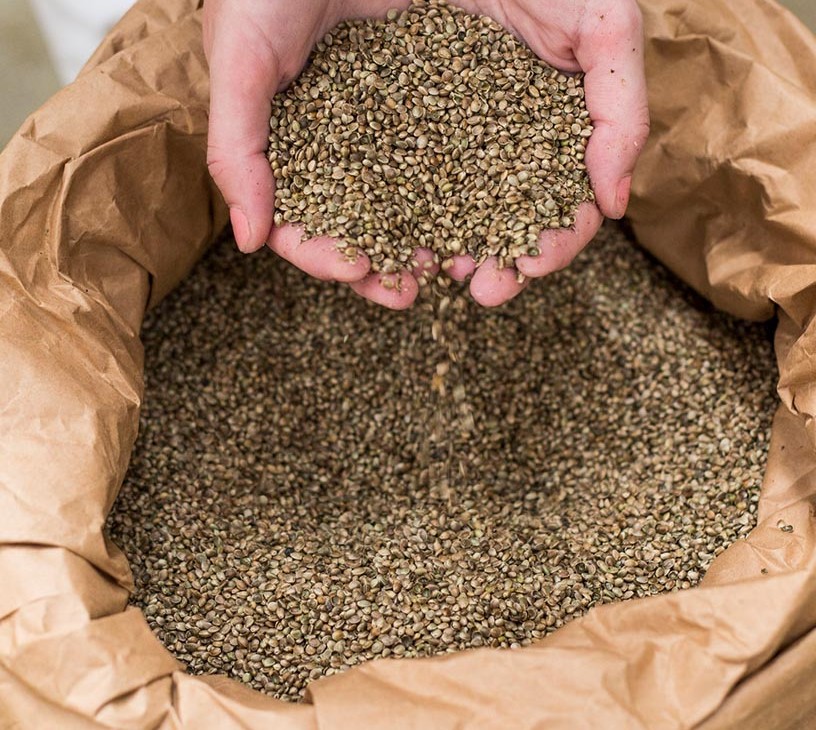
- Seeds
- Shivs
- Application
- Textile
- Food and beverages
- Personal care
- Animal care
- Others
- Source
- Conventional
- Organic
- Geography
- APAC
- China
- India
- Japan
- North America
- US
- Canada
- Mexico
- Europe
- France
- Germany
- UK
- South America
- Brazil
- Argentina
- Middle East and Africa
- South Africa
- Turkey
- UAE
- Rest of World (ROW)
- APAC
By Product Insights
The fiber segment is estimated to witness significant growth during the forecast period.
The fiber segment is a cornerstone of the industrial hemp market, driven by its exceptional strength and versatility in industrial applications. This segment, which accounted for over 36% of market activity in 2024, is expanding beyond traditional textiles.
Advanced hemp fiber decortication techniques are crucial for separating materials for diverse bast fiber applications, from automotive interiors to construction materials.
The use of natural fiber reinforcement in hemp hurd biocomposites is gaining traction for carbon-negative construction and other biodegradable material solutions.
In parallel, applications for cannabidiol (CBD) extraction, hempseed oil cold-pressing, and clean-label food ingredients demonstrate the crop’s multifaceted value, supported by a growing infrastructure for sustainable raw material sourcing.
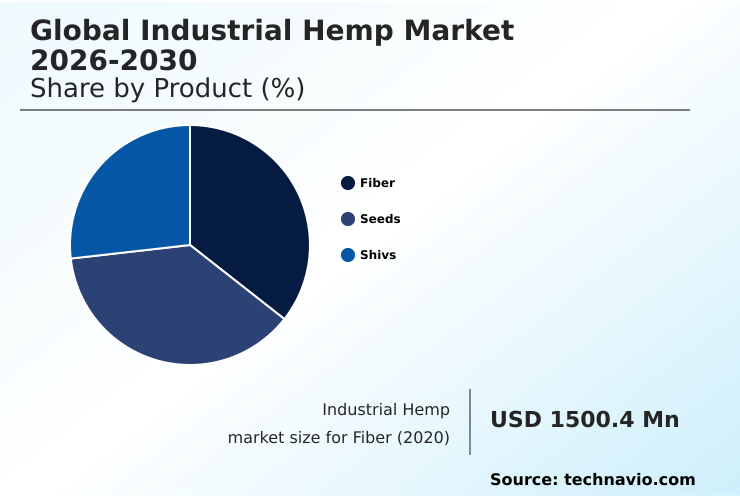
The Fiber segment was valued at USD 2.89 billion in 2024 and showed a gradual increase during the forecast period.
Regional Analysis
APAC is estimated to contribute 41.8% to the growth of the global market during the forecast period.Technavio’s analysts have elaborately explained the regional trends and drivers that shape the market during the forecast period.
See How Industrial Hemp Market Demand is Rising in APAC Get Free Sample
The geographic landscape of the industrial hemp market is characterized by regional specialization and evolving regulatory frameworks that shape production and trade.
APAC is poised to contribute nearly 42% of the market's incremental growth, driven by large-scale cultivation and a focus on textile applications. North America leads in high-value product innovation, particularly in wellness and food segments.
Meanwhile, Europe’s mature market emphasizes a circular economy model, where advanced biomass valorization and precision agriculture techniques are standard. Across these regions, the adoption of high-yield cultivars is critical for economic viability.
The crop’s role in regenerative agriculture is also gaining prominence, with its phytoremediation properties and crop rotation benefits contributing to improved soil health and supporting a more sustainable agricultural commodity framework.
Market Dynamics
Our researchers analyzed the data with 2025 as the base year, along with the key drivers, trends, and challenges. A holistic analysis of drivers will help companies refine their marketing strategies to gain a competitive advantage.
- The global industrial hemp market 2026-2030 is advancing through strategic applications where its unique properties offer distinct advantages over conventional materials. The debate over hemp fiber vs cotton sustainability is increasingly settled in favor of hemp, which requires significantly less water and fewer pesticides. This is driving its adoption in industrial hemp for textile manufacturing.
- In construction, the focus is on using hempcrete in residential construction, valued for its carbon-negative properties and excellent insulation. The wellness sector continues to expand, centered on the CBD extraction process from hemp and the use of hemp seed oil for skincare, which leverages the plant's beneficial compounds.
- In manufacturing, the use of hemp biocomposites in automotive interiors is becoming standard for lightweighting vehicles. The nutritional benefits of hemp protein are also a key driver in the food industry. However, challenges in hemp processing infrastructure persist, impacting the entire supply chain from cultivation to final product.
- The legal status of industrial hemp remains a complex, jurisdiction-dependent issue, influencing investment in industrial hemp cultivation. Strategic analyses show that establishing localized processing facilities can reduce logistical costs by over 20%, directly improving the economic feasibility of using materials like hemp hurd for animal bedding and supporting the broader role of hemp in bioplastics.
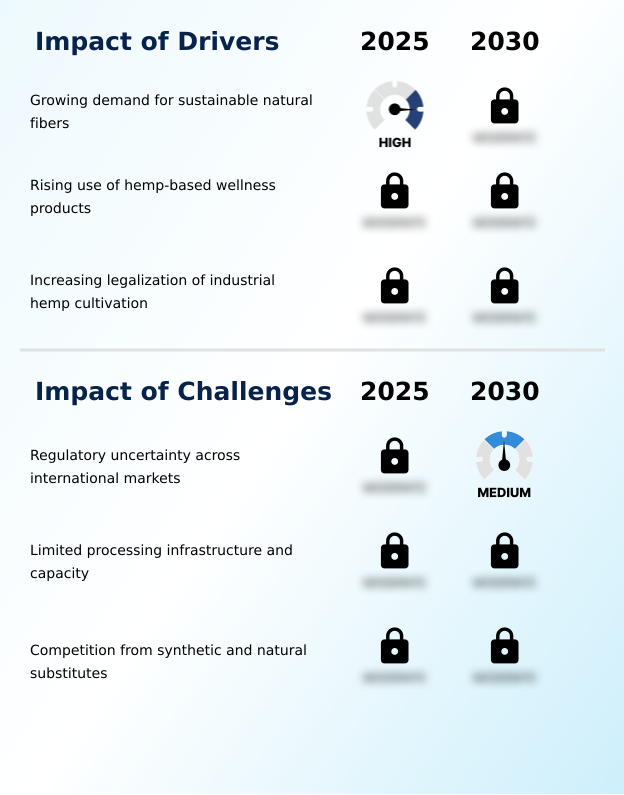
What are the key market drivers leading to the rise in the adoption of Industrial Hemp Industry?
- The growing demand for sustainable natural fibers serves as a key driver for market growth.
- Market growth is significantly influenced by the increasing adoption of hemp across diverse industries, driven by its sustainable attributes and versatile properties.
- The rising demand for plant-derived wellness products is a major factor, with the unique terpene and flavonoid content of certain strains enhancing personal care formulations and functional beverage additives.
- This has led to a 30% increase in product launches within the niche wellness category. In manufacturing, superior industrial hemp genetics are enabling the creation of advanced nonwoven textile materials and bioplastic feedstock.
- As a regenerative agriculture crop, its adoption is supported by agronomic best practices that improve farm-level sustainability. Furthermore, enhanced supply chain traceability is boosting confidence among industrial buyers, with traceable materials seeing a 15% faster adoption rate.
What are the market trends shaping the Industrial Hemp Industry?
- The expanding utilization of CBD hemp products is an emerging trend within the market. This shift reflects growing consumer adoption for wellness and therapeutic applications.
- Key market trends are centered on product diversification and sustainable cultivation practices. The expanding use of low-THC cannabis sativa strains is fueling innovation in wellness, where high-purity cannabinoid isolates are in demand. This trend has enabled some brands to achieve a 25% higher price point for certified products.
- In the food sector, hemp’s role as a plant-based protein source with a favorable omega fatty acid profile is driving its inclusion in new product lines. Concurrently, the push for sustainability is promoting hempcrete carbon sequestration in construction and the use of hemp fibers in eco-friendly packaging alternatives, which can reduce plastic use by up to 40%.
- The material is also being adopted for specialty paper production, offering a more durable and resource-efficient option.
What challenges does the Industrial Hemp Industry face during its growth?
- Regulatory uncertainty across international markets presents a key challenge to the industry's growth trajectory.
- The market faces significant structural challenges that temper its growth potential, primarily related to infrastructure and regulation. The lack of scalable industrial processing infrastructure for zero-waste whole-plant processing remains a critical bottleneck, increasing operational costs by an estimated 20% in some regions. This deficit directly impacts the ability to consistently produce high textile-grade fiber quality materials and food-grade hemp seeds.
- Furthermore, inconsistent regulatory compliance standards and complex cross-border trade policies create uncertainty, delaying market entry for new nutraceutical ingredients and bio-composite building materials. Eco-conscious consumer demand for sustainable products is high, but these supply-side constraints and the slow pace of green building certification for new materials hinder widespread adoption.
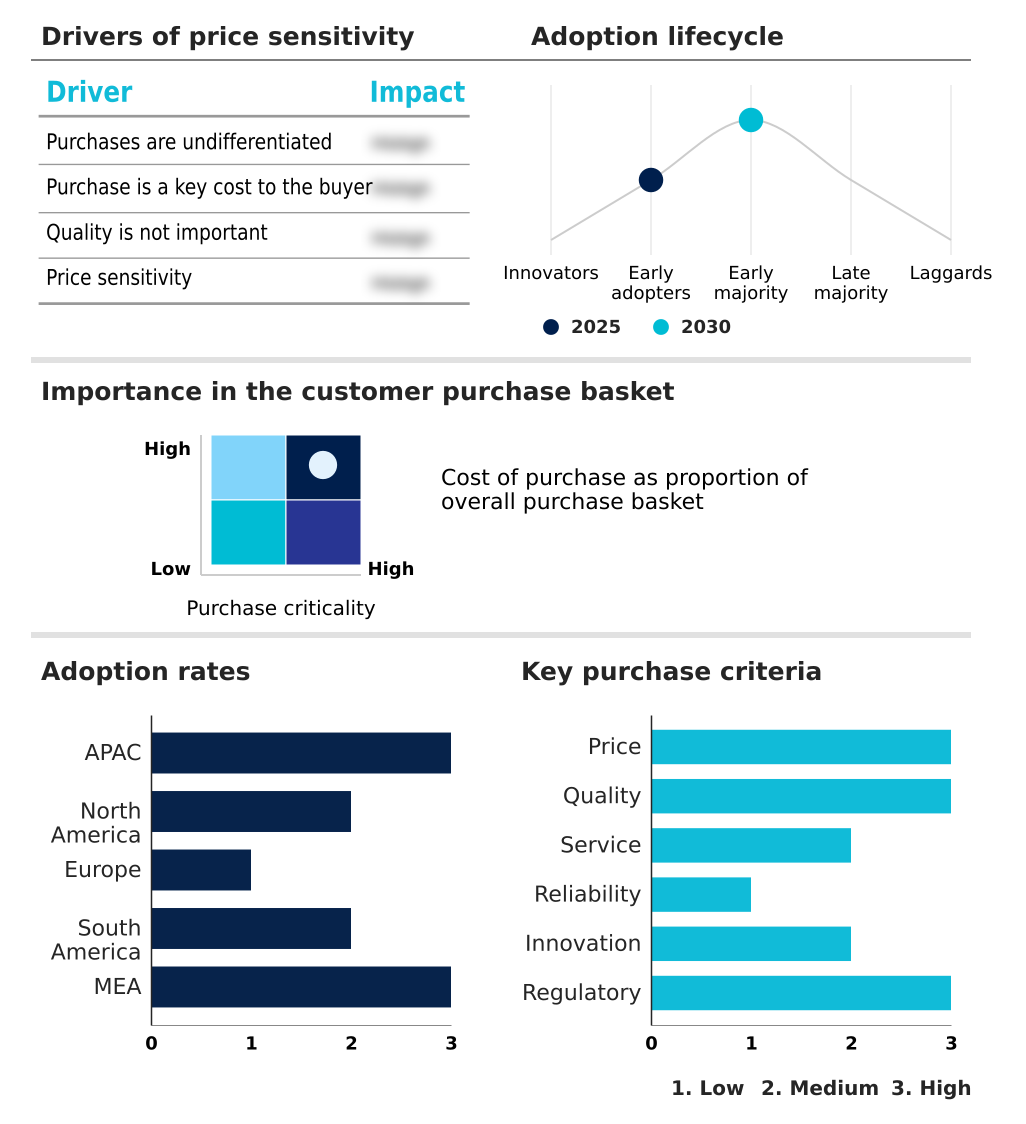
Exclusive Technavio Analysis on Customer Landscape
The industrial hemp market forecasting report includes the adoption lifecycle of the market, covering from the innovator’s stage to the laggard’s stage. It focuses on adoption rates in different regions based on penetration. Furthermore, the industrial hemp market report also includes key purchase criteria and drivers of price sensitivity to help companies evaluate and develop their market growth analysis strategies.
Customer Landscape of Industrial Hemp Industry
Competitive Landscape
Companies are implementing various strategies, such as strategic alliances, industrial hemp market forecast, partnerships, mergers and acquisitions, geographical expansion, and product/service launches, to enhance their presence in the industry.
Bast Fibre Technologies Inc. - Specializes in developing natural bast fibers for nonwoven and textile applications, providing sustainable, high-performance alternatives to synthetic materials.
The industry research and growth report includes detailed analyses of the competitive landscape of the market and information about key companies, including:
- Bast Fibre Technologies Inc.
- Blue Sky Hemp Ventures
- Charlottes Web Holdings Inc.
- Dewey Scientific
- Ecofibre Ltd.
- EcoGen BioSciences
- GenCanna
- HempFlax Group BV
- Hempro Int. GmbH
- Hemptown Naturals
- HM.CLAUSE
- Manitoba Harvest Hemp Foods
- MH medical hemp GmbH
- Oregon CBD
- Panda Biotech LLC
- Sana Hemp Juice
- South Hemp Tecno S.r.l.
- Tilray Brands Inc.
- Valley Bio Ltd
Qualitative and quantitative analysis of companies has been conducted to help clients understand the wider business environment as well as the strengths and weaknesses of key industry players. Data is qualitatively analyzed to categorize companies as pure play, category-focused, industry-focused, and diversified; it is quantitatively analyzed to categorize companies as dominant, leading, strong, tentative, and weak.
Recent Development and News in Industrial hemp market
- In August 2024, Volkswagen collaborated with a German startup to explore the use of hemp-based imitation leather for vehicle interiors, signaling growing interest from the automotive sector in sustainable materials.
- In January 2025, MaRijany Hemp Company completed a USD 25 million industrial hemp processing facility in Ukraine’s Zhytomyr region, designed to produce high-quality fibers for bioplastics, insulation, and paper with a capacity of 14,000 tons annually.
- In February 2025, the government of Himachal Pradesh in India approved a comprehensive pilot study to evaluate the controlled cultivation of industrial hemp for scientific, medicinal, and industrial purposes.
- In March 2025, Edible Arrangements launched Edibles.com, a digital marketplace dedicated to hemp-derived goods, initially serving the Texas market with plans for expansion across the Southeastern United States.
Dive into Technavio’s robust research methodology, blending expert interviews, extensive data synthesis, and validated models for unparalleled Industrial Hemp Market insights. See full methodology.
| Market Scope | |
|---|---|
| Page number | 297 |
| Base year | 2025 |
| Historic period | 2020-2024 |
| Forecast period | 2026-2030 |
| Growth momentum & CAGR | Accelerate at a CAGR of 29.1% |
| Market growth 2026-2030 | USD 24652.5 million |
| Market structure | Fragmented |
| YoY growth 2025-2026(%) | 22.6% |
| Key countries | China, India, Japan, Australia, South Korea, Indonesia, US, Canada, Mexico, France, Germany, UK, The Netherlands, Italy, Spain, Brazil, Argentina, Chile, South Africa, Turkey, UAE, Israel and Saudi Arabia |
| Competitive landscape | Leading Companies, Market Positioning of Companies, Competitive Strategies, and Industry Risks |
Research Analyst Overview
- The industrial hemp market is defined by its pivot to high-value applications, where boardroom strategies now center on leveraging its versatility. Innovations in hemp fiber decortication are unlocking new bast fiber applications, while the development of hemp hurd biocomposites addresses sustainability mandates. In parallel, refined cannabidiol (CBD) extraction and hempseed oil cold-pressing methods serve the wellness and food sectors.
- The cultivation of specific low-THC cannabis sativa strains positions hemp as one of the leading sustainable fiber alternatives. For construction, hempcrete carbon sequestration provides a clear environmental advantage. As a premier plant-based protein source with a rich omega fatty acid profile, its use is expanding. The plant’s terpene and flavonoid content is also being explored for niche applications.
- Growth is evident in nonwoven textile materials and as a bioplastic feedstock, driven by superior industrial hemp genetics. As a regenerative agriculture crop, it offers significant ecological benefits. The industry is advancing toward zero-waste whole-plant processing, ensuring high textile-grade fiber quality and availability of food-grade hemp seeds and nutraceutical ingredients.
- Its role as a bio-composite building material supports a circular economy model and a formal agricultural commodity framework. Leveraging high-yield cultivars, crop rotation benefits, and its natural phytoremediation properties is key, with some firms achieving component weight reductions of over 15%.
What are the Key Data Covered in this Industrial Hemp Market Research and Growth Report?
-
What is the expected growth of the Industrial Hemp Market between 2026 and 2030?
-
USD 24.65 billion, at a CAGR of 29.1%
-
-
What segmentation does the market report cover?
-
The report is segmented by Product (Fiber, Seeds, and Shivs), Application (Textile, Food and beverages, Personal care, Animal care, and Others), Source (Conventional, and Organic) and Geography (APAC, North America, Europe, South America, Middle East and Africa)
-
-
Which regions are analyzed in the report?
-
APAC, North America, Europe, South America and Middle East and Africa
-
-
What are the key growth drivers and market challenges?
-
Growing demand for sustainable natural fibers, Regulatory uncertainty across international markets
-
-
Who are the major players in the Industrial Hemp Market?
-
Bast Fibre Technologies Inc., Blue Sky Hemp Ventures, Charlottes Web Holdings Inc., Dewey Scientific, Ecofibre Ltd., EcoGen BioSciences, GenCanna, HempFlax Group BV, Hempro Int. GmbH, Hemptown Naturals, HM.CLAUSE, Manitoba Harvest Hemp Foods, MH medical hemp GmbH, Oregon CBD, Panda Biotech LLC, Sana Hemp Juice, South Hemp Tecno S.r.l., Tilray Brands Inc. and Valley Bio Ltd
-
Market Research Insights
- The industrial hemp market is shaped by a dynamic interplay of innovation, regulation, and evolving consumer preferences for plant-derived wellness products and sustainable raw material sourcing. Agronomic best practices and precision agriculture techniques are improving yields, with some organic operations reporting a 15% increase in crop resilience. This supports the development of advanced personal care formulations and functional beverage additives.
- Supply chain traceability is becoming a critical differentiator, as manufacturers using transparent systems have noted a 10% improvement in consumer trust metrics. Industrial processing infrastructure remains a focal point, as investment in modern facilities can reduce production costs by over 20%, enhancing the competitiveness of hemp-derived materials against traditional counterparts.
We can help! Our analysts can customize this industrial hemp market research report to meet your requirements.
 RIA -
RIA - 
